
Nitrous Oxide Emissions in Snow-covered Agricultural Soils – manure-induced fluxes


Why Study Nitrous Oxide Emissions and Manure Application?*

It is now accepted that soil nitrous oxide (N2O) emissions occur under freezing conditions (Sommerfeld et al., 1993; Pelster et al., 2012), and that overwinter N2O emissions may represent a substantial portion of the total annual emissions from agricultural soils in northern countries (Maljanen et al., 2007; Wagner-Riddle et al., 2007; Virkajärvi et al., 2010). However, the temporal dynamics during winter are poorly documented, and the question whether manure application in the fall may increase winter N2O emissions is under debate. In addition, the possible influence of soil texture in regulating N2O emissions during winter has been overlooked. Our objective was to compare N2O emissions above the snow cover on sandy and clayey soils with and without pig slurry applied in the fall.

What did we do?

The study was carried out for three consecutive winter periods (2010-2013) on a sandy loam and a silty clay soil. Soil N2O concentration and emission were monitored weekly from November to May using soil probes and static chambers, respectively. The static chambers were made of 20-cm diameter white PVC pipe. The chamber base (15 cm height) was permanently inserted to 10 cm depth. Pig slurry was applied within half of the chamber bases (5 per soil type), whereas the other half remained unamended (Control treatment). The manure was immediately incorporated into the top 5 cm of soil using hand tools; soil in control chambers was similarly disturbed. Additional sections of PVC pipe (10 cm height) were secured on the top of each chamber base as the snowpack developed, and were removed stepwise in the spring during snowmelt. The chamber base was therefore emerging above the snow cover at time of chamber deployment. On each sampling date, the accumul ation of N2O within the chamber headspace was monitored at 6-min intervals during 18-min deployments. Soil air was also collected weekly through soil probes installed at 7.5 cm depth. Air samples were withdrawn with a syringe and transferred to pre-evacuated vials. Gas samples in vials were analyzed for N2O within 48 h using a gas chromatograph.

Title: Nitrous Oxide Emissions in Snow-covered Agricultural Soils – manure-induced fluxes

Authors and affiliations:

Martin H. Chantigny, Philippe Rochette & Denis A. Angers, Agriculture and Agri-Food Canada, Québec;

Claudia Goyer, Agriculture and Agri-Food Canada, Fredericton, Canada

Table 1. Range of cumulative N2O-N emission, magnitude of emissions, and emission factors measured for three consecutive winter periods.


Sandy loam


Silty clay

Cumulative emission

(kg N2O-N/ha)


0.1 to 2.0


0.6 to 1.6

Magnitude of emissions

(% of total annual emission)

32 to 67


10 to 27

Emission factor

(% N applied)

0.3 to 3.0


0.9 to 2.4

What have we learned?

Nitrous oxide was produced in soils and emitted in all years, with a low in late fall (Nov.-Dec.) and significant increases when snow depth exceeded 20 cm (late Dec. – early Jan.) and during spring thaw (late March – early April). Ice formation on and within the soil occurred during freeze-thaw events. This phenomenon generally blocked the emission of N2O but did not prevent its production in the soil. Therefore ice formation resulted in a marked decline in N2O emissions with concurrent increase in soil N2O concentration. The temporal dynamics of N2O emissions was variable among years, and the significance of manure-induced N2O emissions was mainly explained by early winter frost penetration, which was dependent on snow accumulation in late fall. As opposed to N2O emissions measured during the growing season, sandy soils tended to emit as much N2O as clayey soils during the non-growing season. Consequently, the cumulative N2O-N emi ssions in the non-growing season (November-April) accounted for 10 to 25% of total annual emissions in clayey soils, and from 20 to 70% in sandy soils (Table 1). Soils amended with pig slurry in the fall emitted more N2O than soils without, with emissions factors up to 3%, higher than the default IPCC coefficient (1%).

References

Maljanen M., Kohonen, A.R., Virkajärvi P., Martikainen P.J. 2007. Fluxes and production of N2O, CO2 and CH4 in boreal agricultural soil during winter as affected by snow cover. Tellus, Series B: Chem. Phys. Meteor. 59, 853-859.

Pelster, D.E., Chantigny, M.H., Rochette, P., Angers, D.A., Laganière, J., Zebarth, B., Goyer, C. 2012. Crop residue incorporation alters soil nitrous oxide emissions during freeze-thaw cycles. Can. J. Soil Sci. 93:415-425.

Sommerfeld, R.A., Mosier, A.R., Musselman, R.C. 1993. CO2, CH4, and N2O flux through a Wyoming snowpack and implications for global budgets. Nature 361:140-142.

Virkajärvi P., Maljanen M., Saarijarvi K., Haapala J., Martikainen P.J. 2010. N2O emissions from boreal grass and grass-clover pasture soils. Agric. Ecosyst. Environ. 137, 59-67.

Wagner-Riddle, C., Furon, A., McLaughlin, N. L., Lee, I., Barbeau, J., Jayasundara, S., Parkin, G., von Bertoldi, B., Warland, J. 2007. Intensive measurement of nitrous oxide emissions from a corn-soybean-wheat rotation under two contrasting management systems over 5 years. Global Change Biol. 13:1722-1736.

Future Plans

Now that we evidenced the significance of N2O emissions from soils during the winter period, we are initiating field work to determine best practices for fall application of manure (e.g. early vs. late fall application; use of additives to delay nitrification of manure ammonia) that will mitigate losses and help efficiently transferring applied N to crop in the next spring.

Authors

Martin H. Chantigny, Soil Scientist, Agriculture and Agri-Food Canada, Quebec martin.chantigny@agr.gc.ca

Philippe Rochette, Denis A. Angers, Agriculture and Agri-Food Canada, Québec;

Additional information

Scientific papers and reports can be accessed through my webpage:  www.agr.gc.ca/fra/science-et-innovation/centres-de-recherche/quebec/centre-de-recherche-et-de-developpement-sur-les-sols-et-les-grandes-cultures/personnel-et-expertise-scientifiques/chantigny-martin-phd/?id=1181933396583

Acknowledgements

This project was financially supported by the Sustainable AGriculture Environmental Systems (SAGES) Initiative of Agriculture and Agri-Food Canada

The authors are solely responsible for the content of these proceedings. The technical information does not necessarily reflect the official position of the sponsoring agencies or institutions represented by planning committee members, and inclusion and distribution herein does not constitute an endorsement of views expressed by the same. Printed materials included herein are not refereed publications. Citations should appear as follows. EXAMPLE: Authors. 2015. Title of presentation. Waste to Worth: Spreading Science and Solutions. Seattle, WA. March 31-April 3, 2015. URL of this page. Accessed on: today’s date.

Feeding Strategies to Mitigate Cost and Environmental Footprint of Pig Production in the US

The livestock sector is one of main drivers of the environmental footprint. Animal feed is a key to sustainable meat production. Researchers are looking for environmentally sustainable feeding strategies that will lower diet cost, agricultural use of land, water depletion, and climate change impact. We used linear models to formulate 4 single-objective diets including least-cost, least-land use, least-water depletion, and least-climate change impact diets. Preliminary results showed that the use of wheat and wheat middlings hold potential to reduce pig diet cost and the environmental footprint.

Purpose

Demand for sustainable food, which conserves the environment and meets the needs of human development and increasing population, is growing (SCAR 2014). Livestock production is one of the major causes of the world’s environmental impacts including agricultural land use, water depletion, and climate change impact (PEW Commission on Industrial Farm Animal Production 2010). Feeding is the most important factor in livestock production cost and animal performance which includes growth, nutrition, health, sustainability, and productivity. Farmers are interested in producing animals with a better performance and need feeding strategies that will lower diet costs and conserve resource use (land and water). The objective of this study is to develop cost-effective diet formulations and mitigate the environmental footprint of pig production in the US.

What did we do?

Figure 1. Preliminary grow phase single-objective pig diets including typical US, least-cost, least-climate change impact, least-water depletion, and least-land use. Legend should be read left to right and top to bottom.

Figure 1. Preliminary grow phase single-objective pig diets including typical US, least-cost, least-climate change impact, least-water depletion, and least-land use. Legend should be read left to right and top to bottom.

Windows-based User Friendly Feed Formulation (WUFFDA) linear models are used to formulate single-objective pig diets including least-cost, least-water use, least-land use, and least-climate change impact diets (Figure 1) (Pesti et al. 2004). Models include typical feed ingredients and additional US pig industry top 50 used protein and energy feed ingredients (Table 1 and 2). Nutrient characteristics, inclusion limits, environmental footprint, and cost data for feed ingredients were obtained from the US Animal Feed Database  and incorporated into WUFFDA models (Burek et al. 2014). Theoretical diets are compared against typical US pig multi-phase diets which were obtained from a nutritionist (Figure 1).

Table 1. Typical feed ingredients in US pig diets.

Blood Plasma

L-Valine

Copper Sulfate

Milk, Lactose

Corn DDG

Milk, Whey Powder

Corn, Yellow Dent

Neo-Terramycin

Dicalcium Phosphate

Paylean

DL-Methionine

Potassium Sulfate

Ethoxiquin

Poultry By-Product

Fat (Poultry)

Ronozyme

Fish Meal

Sodium Chloride

Limestone, Ground

Soybean meal, 48%

L-Isoleucine

Trace Mineral Premix

L-Lysine-HCI

Vitamin premix

L-Threonine

Zinc Oxide

L-Tryptophan


Table 2. Top 50 protein and energy feed ingredients in US pig diets.

Alfalfa Meal

Oat Grains

Barley

Oyster Shell

Beet Pulp

Pea Protein Concentrate

Blood Meal Spray-Dried

Peas, Field Peas

Canola Meal, Expelled

Rice

Canola Oil

Rice Bran

Canola, Full Fat

Rice, Broken

Citrus Pulp

Rye

Corn Bran

Safflower Meal

Corn Gluten Feed

Sorghum

Corn Gluten Meal

Soy Protein Concentrate

Cotton Seed Meal

Soy Protein Isolate

Fat (A/V Blend)

Soybean Hulls

Fat (Beef Tallow)

Soybean Meal, 44%

Fat (Restaurant Grease)

Soybean Oil

Feather Meal

Soybean Seeds, Heat Processed

Flaxseed

Soybeans, High Protein, Full Fat

Flaxseed Meal

Sunflower Meal

Meat and Bone Meal

Sunflower, Full Fat

Milk, Casein

Wheat Bran

Milk, Whey Permeate

Wheat Middlings

Milk, Whey Protein Concentrate

Wheat Shorts

Molasses, Sugar Beets

Wheat, Hard Red

Molasses, Sugarcane

Wheat, Hard Red Winter

What have we learned?

The US producers use corn and soybean meal as a base for pig diets (Figure 1). The single-objective modeling shows that more sustainable and cost-effective diets can be formulated by diversifying protein and energy sources. For example, preliminary theoretical single-objective diets for one pig growing phase show that the use of wheat and wheat middlings may reduce multiple objectives (Figure 1). The least-cost diet includes wheat, sorghum, wheat middlings, and corn distillers grains (Figure 1). Wheat, wheat middlings, soybeans, soybean hulls, corn distillers grains are the main ingredients in the least-climate change impact diet (Figure 1). The least-water depletion diet includes wheat middlings, corn distillers grains, and canola meal (Figure 1). The least-land use includes corn distillers grains, wheat, rice bran, and corn gluten feed (Figure1). Theoretical diets serve as guidelines to develop realistic sustainable cost-effective pig diets that pig producers will be able to incorporate into their production system. 

Future Plans

The results presented in this manuscript are preliminary. Formulated diets will be analyzed using the Pig Environmental Calculator (PPEC) and Simapro 8.1 life cycle assessment (LCA) pig production model (PRé Consultants 2014; National Pork Board 2015). The PPEC calculates the actual amount of feeds and total costs (National Pork Board 2015). The Simapro 8.3 cradle-to-farm gate pig production life-cycle assessment model calculates environmental impacts of pig production (PRé Consultants 2014).

Animal feed availability, pig production practices, and environmental footprints vary for pig production regions in the US. Feed costs are dynamic including costs and geography. The intention is to develop pig diets for different pig production regions in the US. Thus, further research will focus on multi-objective analyses to evaluate potential to reduce simultaneously cost and environmental footprints under different constraints. We will verify results with nutritionists, economists, and other experts. The pig producers will have access to formulated diets through PPEC.

Authors

Jasmina Burek, Research Associate, University of Arkansas jburek@uark.edu

Greg Thoma, Jennie Popp, Charles Maxwell, Rick Ulrich

Additional information

Pig Production Environmental Calculator
Life-Cycle Assessment Modeling for the Pork Industry

References

Burek J, Thoma G, Popp J, et al. (2014) Developing Environmental Footprint, Cost, and Nutrient Database of US Animal Feed Ingredients.

National Pork Board (2015) Carbon Footprint of Pork Production Calculator – Pork Checkoff.

PEW Commission on Industrial Farm Animal Production (2010) Environmental Impact of Industrial Farm Animal Production.

PRé Consultants (2014) SimaPro 8.3.

SCAR (2014) Sustainable food. http://ec.europa.eu/environment/eussd/food.htm.

Acknowledgements

This research is part of the program “Climate Change Mitigation and Adaptation in Agriculture,” and is supported by Agriculture and Food Research Initiative Competitive Grant no. 2011-68002-30208 from the USDA National Institute of Food and Agriculture.

The authors are solely responsible for the content of these proceedings. The technical information does not necessarily reflect the official position of the sponsoring agencies or institutions represented by planning committee members, and inclusion and distribution herein does not constitute an endorsement of views expressed by the same. Printed materials included herein are not refereed publications. Citations should appear as follows. EXAMPLE: Authors. 2015. Title of presentation. Waste to Worth: Spreading Science and Solutions. Seattle, WA. March 31-April 3, 2015. URL of this page. Accessed on: today’s date.
Environmental Footprint, Cost, and Nutrient Database of the US Animal Feed Ingredients


Poster presentation BurekWhy Look at Feed Ingredients and Environmental Footprint?

The US Pig Production Environmental Calculator (PPEC) was built upon cradle-to-farm-gate life-cycle assessment (LCA) of pork production combined with the US National Resource Council (NRC 2012) swine nutrient requirements models (NRC 2012), farm operation inputs, and animal feed database. The purpose of the US Animal Feed Database is to compile environmental, economic, and nutrient content of animal feed ingredients in a single location and integrate it into a PPEC economic model of swine operations. (Click on image at right to view a handout of the poster).

What did we do?

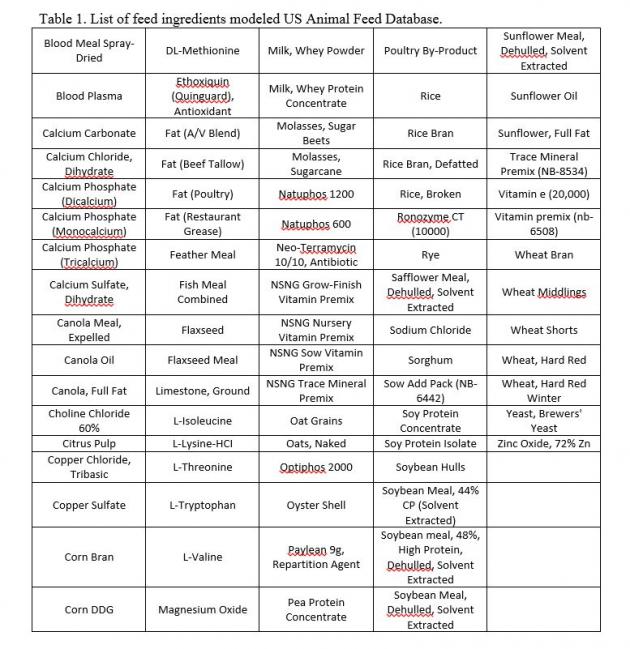
We collected data from different sources including NRC (2012) feed nutrient characteristics, Feedstuffs (2014) for feed prices, US agricultural and product LCA models built in SimaPro 7.3.3 (PRé Consultants 2011) and LCA databases (Swiss Centre for Life Cycle Inventories 2010; EarthShift 2011; Blonk Consultants 2014) for environmental footprints. Table 1 shows a list of top US pig feed ingredients.

What have we learned?

list in us databaseFeed ingredients with highest costs are additives (e.g. paylean) and amino acids. Milk by-products have the largest climate change impact, water and land use.

Future Plans

The information from this database will be used as a starting point for identifying potential mitigation options in pig diet formulation. The database will be updated as new information becomes available.

Authors

Jasmina Burek, Research Associate, University of Arkansas jburek@uark.edu

Greg Thoma, Jennie Popp, Charles Maxwell, Rick Ulrich

Additional information

National Pork Board (2015) Carbon Footprint of Pork Production Calculator – Pork Checkoff.
Pesti G, Thomson E, Bakalli R, et al. (2004) Windows User-Friendly Feed Formulation (WUFFF DA) Version1.02.
PRé Consultants (2014) SimaPro 8.3. 4555022.

Pig Production Environmental Calculator
Life-Cycle Assessment Modeling for the Pork Industry

Acknowledgements

This research is part of the program “Climate Change Mitigation and Adaptation in Agriculture,” and is supported by Agriculture and Food Research Initiative Competitive Grant no. 2011-68002-30208 from the USDA National Institute of Food and Agriculture.

The authors are solely responsible for the content of these proceedings. The technical information does not necessarily reflect the official position of the sponsoring agencies or institutions represented by planning committee members, and inclusion and distribution herein does not constitute an endorsement of views expressed by the same. Printed materials included herein are not refereed publications. Citations should appear as follows. EXAMPLE: Authors. 2015. Title of presentation. Waste to Worth: Spreading Science and Solutions. Seattle, WA. March 31-April 3, 2015. URL of this page. Accessed on: today’s date.

Fertilizer Value of Swine Manure: A Comparison of a Lagoon and a Deep Pit Slurry System

Why Compare Liquid and Slurry Systems for Pig Production?

Since 2000 the cost of fertilizer has more than doubled. According to information provided by the USDA Economic Research Service (2013), the national average price per pound of N has increased between 2000 and 2012 by a factor of 2.6. Over the same time period, phosphate price increased by a factor of 2.8, and potassium price increased by a factor of 4.0. As a result, fertilizer costs now contribute 30% to 40% of the annual variable costs to grow many cereal grains. Table 1. Fertilizer priceDuring the same time period environmental regulations have greatly decreased the construction of swine finishing facilities that use liquid manure handling systems that require the use of a lagoon or storage pond. In response to these economic and regulatory realities, some swine production companies are considering the use of deep pit slurry systems instead of an outdoor lagoon or storage. Benefits of the deep pit slurry system include the exclusion of rainfall, reduction in storage visibility, and conservation of valuable major plant nutrients (N, P, K) for the purpose of reducing production costs for feed grains. The objective of this presentation is to compare the fertilizer value of the manure produced from swine finishing barns that use a liquid manure handling with a treatment lagoon, and swine finishing barns that store manure below slotted floors in pits.
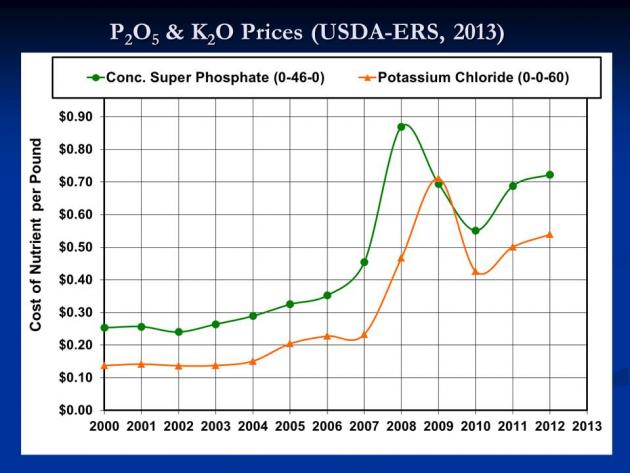
Table 2. Fertilizer priceWhat did we do?

Plant nutrient content and volume data were collected from a swine finishing farm that used a lagoon treatment system. The system was designed to provide storage of manure, anaerobic treatment of volatile solids, and storage for sludge for 3520 pigs. Treated lagoon surface water (total solids = 0.5%) was recycled through the four buildings to provide water to remove manure from the building using a pull-plug, pit-recharge design. Lagoon surface water was applied to nearby cropland annually to provide all major plant nutrients using traveling gun irrigation. Data were also collected concerning the plant nutrient content of lagoon sludge, and sludge volumes were estimated using the ASABE Standard (2011).

Image of barnThe realized value of swine manure was calculated for using lagoon water, and sludge to provide all or a portion of the N, P2O5, K2O used by corn based on typical crop needs. Only the portion of plant nutrients that met the recommendations was assigned value. No value was assigned to major plant nutrients applied in excess of plant uptake. The value was assigned based on price data obtained from USDA-ERS (2013). The prices used were $0.71/lb of N, $0.69/lb of P2O5, and $0.50/lb of K2O.

Two application rates were calculated for lagoon water. The first rate was to provide the N needs for corn and the second was to provide the P2O5 needs of the crop. The pounds of N, P2O5, and K2O applied per acre were determined and the value of the nutrients that met the fertilization rates was calculated.

Lagoon sludge (total solids = 10%) contained 4 times as much P2O5 as plant available N (PAN) per 1000 gallons (47.3 lb P2O5/1,000 gal vs 11.7 lb PAN/1,000 gal). Therefore, the only sludge application rate used was the rate needed to meet the fertilizer recommendation for P2O5. The realized value of the sludge was determined in the same way as for lagoon water.

Diagram lagoon system for finishing swineWhen lagoon water was applied to supply the N needs of one field, and sludge was applied to meet the P2O5 needs of another field the realized value of swine manure was $5.69 per hog-space per year. Application of lagoon water and sludge to meet the P2O5 needs of corn increased the annual value of manure to $6.64 per hog-space.
The analysis was repeated for the same size farm using volume and nutrient data for deep pit barns that provided 1 year of storage for swine slurry (total solids = 7.5%). The realized economic value of deep pit slurry was also calculated based on application of slurry, using direct injection, to meet the N and P2O5 needs of corn with the same price assumptions as for the lagoon system. The results indicated that spreading deep pit slurry based on the agronomic rate for N provided a realized manure value of $24.35/hog-space/yr. Application of slurry based on the agronomic rate for P2O5 yielded a manure value of $28.95/hog-space/year.

What have we learned?

Treatment lagoons were originally designed to provide treated water used to remove manure from flush or pit-recharge swine buildings. However, little consideration was given to the value of the N lost or the value of P and K. Essentially, lagoons provided the treatment needed for recycled flush or pit-recharge systems, but they wasted nitrogen that could be used to off-set fertilizer costs.

Over the last decade, fertilizer prices have increased greatly, and continue to fluctuate. As a result, the nutrients lost by manure treatment are now viewed as a valuable input for production of feed grains.

Using a deep pit barn eliminated the need for manure treatment and allowed plant nutrients to be stored until needed. It was estimated that a deep pit slurry system would allow a producer to increase nutrient value per hog-space by a factor of 4.3 from $6.68 to $28.95/hog-space per year. On a 4-house farm that provided housing for 3520 hogs the annual manure value may be as high as $101,920 per year.

Future Plans

The results from this study are being used to develop extension programs for swine producers. Information is being used to help plan farms and to encourage integration of swine and feed grain production.

Author

John P. Chastain, Ph.D., Professor and Extension Agricultural Engineer, Clemson University jchstn@clemson.edu

Additional information

Reference Cited

ASABE (2011). ANSI/ASAE EP403.4 FEB2011 Design of Anaerobic Lagooons for Animal Waste Management. In ASABE STANDARDS. ASABE, 2950 Niles Rd., St. Joseph, MI 49085-9659.

USDA-ERS (2013). Fertilizer Use and Price. United States Department of Agriculture, Economic Research Service. Available at: http://www.ers.usda.gov/data-products/fertilizer-use-and-price.aspx.

Acknowledgements

Support for this work was provided by the Confined Animal Manure Management Program of Clemson Extension, Clemson University, Clemson, SC.

The authors are solely responsible for the content of these proceedings. The technical information does not necessarily reflect the official position of the sponsoring agencies or institutions represented by planning committee members, and inclusion and distribution herein does not constitute an endorsement of views expressed by the same. Printed materials included herein are not refereed publications. Citations should appear as follows. EXAMPLE: Authors. 2015. Title of presentation. Waste to Worth: Spreading Science and Solutions. Seattle, WA. March 31-April 3, 2015. URL of this page. Accessed on: today’s date.


The Effect of Broiler Litter, Swine Effluent, and Municipal Biosolids Land Application on Small Plot Pathogen, Antibiotic Resistance, and Nutrient Levels

Purpose

Land applying agricultural and municipal wastes carries an inherent risk associated with nutrient and pathogen runoff and contamination, but with that risk comes a potentially sustainable process to reclaim otherwise residual waste material. Few studies compare the two residuals. The purpose of this study was to investigate the land application of municipal waste water treatment solids (biosolids) versus manure (broiler and swine) and their effect on pathogens, antibiotic resistance and nutrients.

What did we do?

A 5×4 randomized block design comprised of broiler litter, swine effluent, and municipal biosolids treatments were land applied at a rate of 5-8 tons ha-1 for the broiler litter and biosolids, respectively, while effluent was applied at a rate of 32 ha-cm on a cooperator farm established with forage plots over a three-year period. Swine effluent was applied to the surface or surface-applied then incorporated to approximately 7.5 cm; applications were applied once per season. Soil core samples to 15 cm were collected from plots and were specifically targeted to include waste-residual. Samples were collected in the days, weeks and months following land application. Samples were processed for heterotrophic plate count bacteria, thermotolerant coliforms, enterococci, staphylococci, gram-negative bacteria, Escherichia coli, Clostridium perfringens, Salmonella spp., Campylobacter spp., Listeria monocytogenes, antibiotic resistant bacteria and genes, and 16S rRNA.

What have we learned?

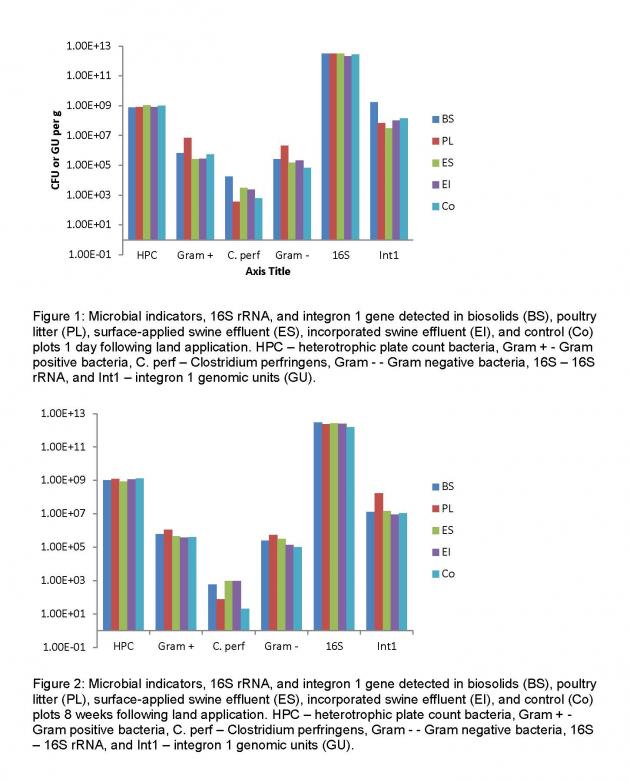
Immediately following land application, most pathogens and indicator bacteria were detected; however, by the end of the first month, most were at background levels. One day following land application (Figure 1), most indicators were noticeably enriched, but following 1 week, levels began to drop to background by week 8 (Figure 2). Pathogens were rarely dependent on waste, for instance, Salmonella was rarely detected, but was detected in both effluent and biosolids-applied plots. Clostridium perfringens, on the other hand was typically found in swine effluent-applied plots, though biosolids-applied plots were also positive for C. perfringens. Campylobacter spp. was not detected at any time point, and E. coli was fleetingly detected. Differences in phenotypic antibiotic resistance weren’t detected, while antibiotic resistance genes were equally detected in most applied treatments. Overall, the influence of waste didn’t alter 1 6S rRNA levels. Microbial ecology, only briefly investigated via terminal restriction fragment length polymorphisms, yielded slight differences between plot treatments. Overall, waste type had a small influence on pathogen/indicator presence and levels following land application, most likely as a result of minimal pathogen levels and application rates such that detection was limited. The overarching results of this study indicate microbial risks associated with any of the tested waste types will be similar, given overall low pathogen levels; however, further investigation into antibiotic resistance, which should be dependent on waste type, will be a focus of interest. Additionally, given the variability of manures, pathogen levels may vary significantly based on region, climate, and concentrated animal feeding operation.Microbial indicators detected

Future Plans

Quantitative microbial risk assessment modeling will be conducted on data, projecting the risks associated with each practice, taking into account a function of waste and time.

Authors

Brooks, John P., Research Microbiologist, Genetics and Precision Agriculture Unit, USDA-ARS, Mississippi State, MS 39762 john.brooks@ars.usda.gov

McLaughlin, M.R., Adeli, A., and Read, J.J.

Additional information

John Brooks
john.brooks@ars.usda.gov
662-320-7411
Manure Pathogens and Microbial Byproducts

Acknowledgements

The authors would like to thank the work of Cindy Smith, Renotta Smith, Jim Robbins, and our farm and wastewater treatment cooperators.

The authors are solely responsible for the content of these proceedings. The technical information does not necessarily reflect the official position of the sponsoring agencies or institutions represented by planning committee members, and inclusion and distribution herein does not constitute an endorsement of views expressed by the same. Printed materials included herein are not refereed publications. Citations should appear as follows. EXAMPLE: Authors. 2015. Title of presentation. Waste to Worth: Spreading Science and Solutions. Seattle, WA. March 31-April 3, 2015. URL of this page. Accessed on: today’s date.

Effect of Wood Biochar Amendment to Sand on Leachate Water Quality with Repeated Dairy Manure Application: A Soil Column Study

Purpose            

Agricultural operations can pose a threat to the quality of nearby water sources, particularly from nitrogen and phosphorus losses following land application of manure. Biochar application to soils has the potential to ameliorate degraded soils and reduce nutrient leaching to groundwater. The effects of amending sand soil columns with hybrid poplar biochar made by a slow pyrolysis process at 450°C at varying rates (0, 1, 2 and 5% by weight) with repeated dairy manure applications over a 56-week period was examined to evaluate the impact to leachate water quality.

What did we do? 

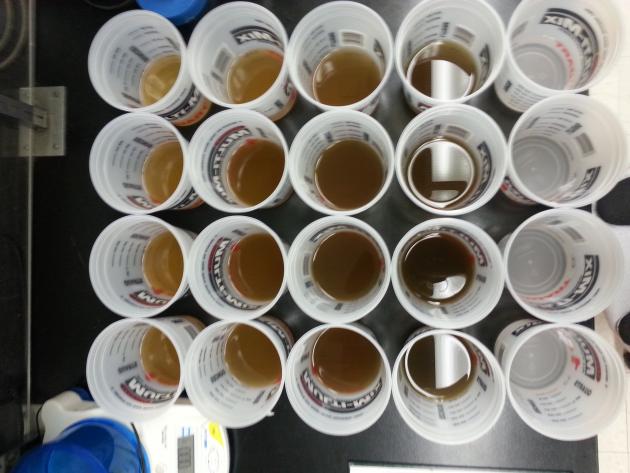
Four biochar treatments and a control were mixed and packed into soil columns by weight to a depth of 20 cm. Leachate from columns were measured in quadruplicate to assess differences in water quality over a 56-week study duration. Each treatment column received an initial manure application followed by additional applications at 14 week intervals, totaling four manure applications. All columns received a 300 mL DI water application once every two weeks.

The total volume of leachate, leachate pH and BOD5 and concentrations of nitrite (NO2-N), nitrite+nitrate (NO2-N+NO3-N), total nitrogen (TN), and total phosphorus (TP) were measured for each column after each leaching event. After the first 14 week cycle (starting with the second manure application), leachate samples were also analyzed for ammonia+ammonium (NH3-N+NH4-N). After each application, manure samples were analyzed for these same parameters. At the end of the study, retention of the same nutrients was determined for mass balance analysis.

Leachate photo

Leachate photo

What have we learned?

Increasing levels of biochar amendment to sandy soil with repeated dairy manure application decreased leachate pH throughout the study and decreased peak levels of BOD5 after manure application. Increased levels of biochar also decreased cumulative TN, NH3-N+NH4-N and NO3-N in leachate, but slightly increased TP leaching. Nutrient retention in the columns at the end of the study indicated that N reduction in leachate was not due to increased retention in the columns. These results indicate that biochar could be a viable option to reduce N leaching from agricultural fields or treatment systems. However, more research is needed on the effect of biochar on gaseous N emissions and other biochar/soil interactions before amending soil with biochar can be recommended as a nutrient management strategy.

Future Plans 

Future work should focus on uncovering the mechanisms for N cycle changes in soils with biochar amendment, such as tracking N-labelled fertilizers in column leaching and emissions. Due to its high cost, biochar may be a more feasible option for treatment systems, such as filter strips or tile drains, which should be explored as a means to reduce nutrient leaching from agricultural fields in an economical manner. Field trials should also be conducted to determine appropriate biochar amendment methods, effects on plant growth and any differences in leaching and emissions under field conditions.

Authors

Alysa Bradley, PhD Student, Biological Systems Engineering Department, University of Wisconsin-Madison alysa.bradley@wisc.edu

Rebecca Larson and Troy Runge, Assistant Professors, Biological Systems Engineering Department, University of Wisconsin-Madison

Additional information                

Alysa Bradley, Biological Systems Engineering Department, University of Wisconsin-Madison, 460 Henry Mall, Madison, WI 53706, alysa.bradley@wisc.edu

Acknowledgements      

This material is based upon work supported by the National Institute of Food and Agriculture, United States Department of Agriculture, under ID number WIS01760.

The authors are solely responsible for the content of these proceedings. The technical information does not necessarily reflect the official position of the sponsoring agencies or institutions represented by planning committee members, and inclusion and distribution herein does not constitute an endorsement of views expressed by the same. Printed materials included herein are not refereed publications. Citations should appear as follows. EXAMPLE: Authors. 2015. Title of presentation. Waste to Worth: Spreading Science and Solutions. Seattle, WA. March 31-April 3, 2015. URL of this page. Accessed on: today’s date.

Northwest Winter Feeding Assessment Tool


Can Grazing Operations Be an AFO Based on Winter Feeding Practices?

Assessment of and protection for water quality resource concerns impacted by livestock winter feeding practices

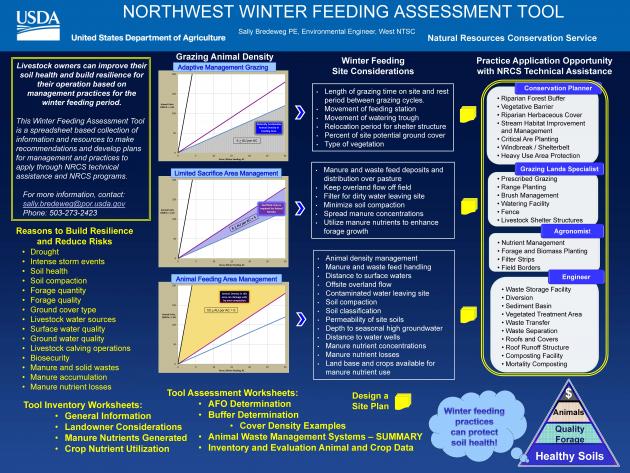
Grazing lands management assistance with NRCS focuses on forage and range conditions for livestock producers and management practices during the growing season. Animal waste management system installations with NRCS have focused on water quality protection associated with confined animal feeding operations. The winter feeding management strategies of grazed livestock can also have a significant seasonal impact on the quality of nearby surface water resources.

In northern regions, winter is a dormant season for forage and a time when significant precipitation can occur. In recent years EPA has clarified the regulatory definition of an Animal Feeding Operation (AFO). The winter feeding management practices employed by grazing operations may risk water quality resource concerns and meet the EPA definition of an AFO.

A planning tool to identify sites where livestock density during the winter feeding period could create a resource concern can facilitate addressing this water quality issue. This assessment tool can review the applicability of NRCS practices for an animal waste management system and if appropriate move the planning process forward for a site design to protect surface water quality resources as needed for the seasonal feeding period.

What did we do? 

As the Environmental Engineer at the West National Technology Support Center I am developing the planning tool for livestock winter feeding sites. The landowner can participate in developing the concerns to be considered for their natural resources and operational practices. Animal manure and the nutrient balance with forage crops can be checked. A review is made if the winter feeding operation approaches the EPA definition of an AFO. The buffer quality conditions can be checked between the feeding site and the surface water sources. This tool can help engage the landowner in a conversations about adaptive management options for pasture or waste storage facility structures as might be recommended for higher animal density management over winter.

What have we learned?             

Resource planning must include the concerns and values of the landowner and the practice must fit with the characteristics of their operation. Animal production and natural resource management is ultimately effected by landowner decisions for the management of livestock and protection of natural resources.

Northwest winter feeding assessment tool

Northwest winter feeding assessment tool

Future Plans    

Continue to test the winter feeding assessment tool and make revisions for utilization.

Authors   

Sally Bredeweg PE, Environmental Engineer, NRCS West National Technology Support Center sally.bredeweg@por.usda.gov

Additional information                

NRCS – Agricultural Waste Management Field Handbook

NRCS – Comprehensive Nutrient Management Planning Procedure

EPA – Animal Feeding Operation (AFO) as defined in the EPA Technical Manual for Concentrated Animal Feeding Operations, EPA 833-F12-001, February 2012

Acknowledgements      

NRCS Range Management Consortia West Region

NRCS staff in WA, CO, UT, CA

EPA region 10

Growing Forward, British Columbia Init

The authors are solely responsible for the content of these proceedings. The technical information does not necessarily reflect the official position of the sponsoring agencies or institutions represented by planning committee members, and inclusion and distribution herein does not constitute an endorsement of views expressed by the same. Printed materials included herein are not refereed publications. Citations should appear as follows. EXAMPLE: Authors. 2015. Title of presentation. Waste to Worth: Spreading Science and Solutions. Seattle, WA. March 31-April 3, 2015. URL of this page. Accessed on: today’s date.

Horse Manure Composting: Facilities and Methods

Managing horse manure may involve mechanical equipment, physical labor and conveying of manure. It is generally practiced outdoors in all types of weather. Composting is the aerobic decomposition of organic materials by microorganisms under controlled conditions. Microorganisms consume oxygen while feeding on organic matter and as a result, give off heat and CO2. In conventional composting, composters manage the process variables, feedstock, air, moisture and shelter, to optimize the natural decay process. Green, wet, nitrogenous feedstocks are mixed with brown, dry, carbonaceous material creating a carbon to nitrogen (C:N) ratio in the range of 20 to 30:1 along with the proper amount of moisture.

Horse manure happens to be one of the easiest manures to compost. There are several methods in and out of structures that can facilitate the compost process. The process can be simple properly shaped static piles, aerated and turned; and you can even compost to capture and use the heat or energy.  Imagine capturing the heat from your manure to warm barns! The windrows or piles are then managed via monitoring and/or turning for proper air-flow and temperature in order to speed up decomposition, eliminate odors and destroy pathogens and weed seeds. Composting horse manure can be as simple or complicated as you choose. It can be used on site or exported for sale.

Authors

Bonhotal, Jean  jb29@cornell.edu            Cornell Waste Management Institute

Additional Information

The authors are solely responsible for the content of these proceedings. The technical information does not necessarily reflect the official position of the sponsoring agencies or institutions represented by planning committee members, and inclusion and distribution herein does not constitute an endorsement of views expressed by the same. Printed materials included herein are not refereed publications. Citations should appear as follows. EXAMPLE: Authors. 2015. Title of presentation. Waste to Worth: Spreading Science and Solutions. Seattle, WA. March 31-April 3, 2015. URL of this page. Accessed on: today’s date.

Composting Horse Mortality and Mortality Disposal Alternatives

With the decline of the rendering industry, managing routine livestock mortality in an effective, economical and environmentally sound manner has become more difficult.  Over 900,000 horses have to be properly managed annually in the US. Disposal should be done in a manner that is most acceptable to the owner, protects public health and safety, does not create a nuisance, prevents the spread of disease, or have adverse effects on water and air quality.

Composting mortality is an option when done properly. It requires a carbon source such as wood chips or other chunky carbon and should be located in a well-drained area along field edges or other dry convenient areas.  The carcass is then covered and left to passively compost. When managed properly, composting will deter domestic and wild animals from scavenging carcasses. Mortality composting, has been proven effective in deactivating pathogens, limits the risk of groundwater and air pollution contamination, and on-site composting reduces the potential for farm to farm disease transmission. On site composting also decreases transportation costs and tipping fees associated with off-site disposal. There is also the added benefit of producing a usable product. As with any farm operation health and safety issues exist in mortality composting. Proper training is the best means to reduce those health and safety issues.

In addition to routine mortality, every year we face animal related disasters including barn collapses, fires, lightning strikes, floods and winter storms. Composting provides an alternative to traditional carcass disposal as it is self-sufficient and can be “biosecure”.  The temperatures achieved through the composting process will eliminate or greatly reduce pathogens, hindering the spread of disease.  Research continues to demonstrate effective destruction of nearly all livestock diseases of concern. Being prepared ahead of time and considering the “what if’s” is important. 

Authors

Bonhotal, Jean  jb29@cornell.edu            Cornell Waste Management Institute 

For Additional Information

The authors are solely responsible for the content of these proceedings. The technical information does not necessarily reflect the official position of the sponsoring agencies or institutions represented by planning committee members, and inclusion and distribution herein does not constitute an endorsement of views expressed by the same. Printed materials included herein are not refereed publications. Citations should appear as follows. EXAMPLE: Authors. 2015. Title of presentation. Waste to Worth: Spreading Science and Solutions. Seattle, WA. March 31-April 3, 2015. URL of this page. Accessed on: today’s date.   

Converting Manure, Food Wastes and Agricultural Production Wastes into Bio-Secure Fertilizer, feed, and/or beeding


Purpose

To find a way to completely eliminate bio-hazards in manure, food wastes, municipal sludge, and agricultural production wastes.

What did we do? 

We adapted existing dry extrusion technology to bio-hazard agricultural wastes. To test the hypothesis we developed [ Dry Extrusion Technology can be adapted to convert bio-degradable hazardous wastes into Bio-Secure class “A” fertilizer, feed, and/or bedding more economically, with less environmental impact, greater sustainability, and in less time with a smaller foot print]

Once we proved our Hypothesis we further developed the process to allow the technology to be utilized in a large stationary plant suitable for a large waste generator and in a portable plant that can be used to assist smaller waste generators, such as, most agricultural producers and smaller municipalities.

What have we learned? 

Our tests showed that we could validate our hypothesis by:

1) utilizing finely ground dry agricultural production wastes, mixed with the wet food and manure to reduce the moisture content of the wet wastes to a level compatible to the requirements of the dry extruder,
2) The Dry extruder effectively sterilized the wastes by high temperature, high pressure inside the extruder, and sudden drop in atmospheric pressure inside the cell walls of all the materials when exiting the Dry Extruder, thereby destroying the cell walls of not only the bio-mass materials but also of all micro organisms ova, and pathogens inside the final product.

Future Plans 

Develop new niche markets for agricultural waste generators by adding additional value to their wastes.

Authors

Joe E. Busby joebusby@wfeca.net 

Moses Braxton, Bill Ansley, William Andrews, Duncan Nesbit, and Dr. Carm Parkhurst

Acknowledgements

Insta Pro International, North Carolina State University

The authors are solely responsible for the content of these proceedings. The technical information does not necessarily reflect the official position of the sponsoring agencies or institutions represented by planning committee members, and inclusion and distribution herein does not constitute an endorsement of views expressed by the same. Printed materials included herein are not refereed publications. Citations should appear as follows. EXAMPLE: Authors. 2015. Title of presentation. Waste to Worth: Spreading Science and Solutions. Seattle, WA. March 31-April 3, 2015. URL of this page. Accessed on: today’s date.