
Economics of Nitrogen Sources and Rates in a Long Term Cropping System

Purpose

The main goal of the study is to determine the singular or combined effects of crop rotation, tillage system, N fertility levels and sources on crop grain and biomass production, crop diseases, and soil attributes (nitrogen, phosphorus, organic matter and pH). Secondly, our goal is to assess the economics of some of the crops grown in the experimental area during the period of time from 2008-2014. The results presented in this summary show that composted manure can replace commercial fertilizer applications in a crop rotation system, maintaining the same level of yields and increasing profits during a 7-year period. Related: Manure value & economics

What did we do?

In 1987, a long-term cropping system study was initiated at the North Dakota State University (NDSU) Carrington Research Extension Center (CREC). The study takes place on approximately 40 acres and consists of cycles of three, 4-year crop rotations with three replicates. The base rotation is hard red spring wheat (HRSW) – sunflower – barley – soybean. Other rotations are composed of HRSW – field pea – corn – soybean and HRSW – corn – soybean – canola. Each crop within each rotation is planted every year. Tillage treatments (conventional tillage-CT, minimum tillage-MT and no-tillage-NT) are imposed along the north-south direction and fertility treatments (nitrogen rates and sources) are imposed along the east-west direction. Nitrogen sources are urea (applied each spring to non-leguminous crop plots at 0, 50, or 100 lbs of N/ac) and composted beef feedlot manure (applied once in the spring at a rate of 200 lbs of N/ac on the first year of each cycle).

The crops (barley, corn, field peas, soybean and HRSW) and period of time (from 2008 to 2014) were selected based on data available to compute production costs (tillage, fertilizer, seeds, chemicals, seeding, combining, overhead and land) and gross return (crop yields and prices). Due to a lack of protein data, barley and HRSW from 2008 were not included in the calculations. The economics were calculated based on two scenarios for the composted manure treatment: Scenario 1 (CompSCN 1) – the producer owns the compost and the only cost associated with it is the application cost; Scenario 2 (CompSCN 2) – the producer pays for each unit of N in the compost the same price paid per unit of N as commercial fertilizer. Barley was graded according to its protein content as feed (protein >12%) or malting barley (protein ≤12%). For HRSW, we used an average discount of $0.08/bu for each 1/5% of protein lower than 14% across all years.

What have we learned?

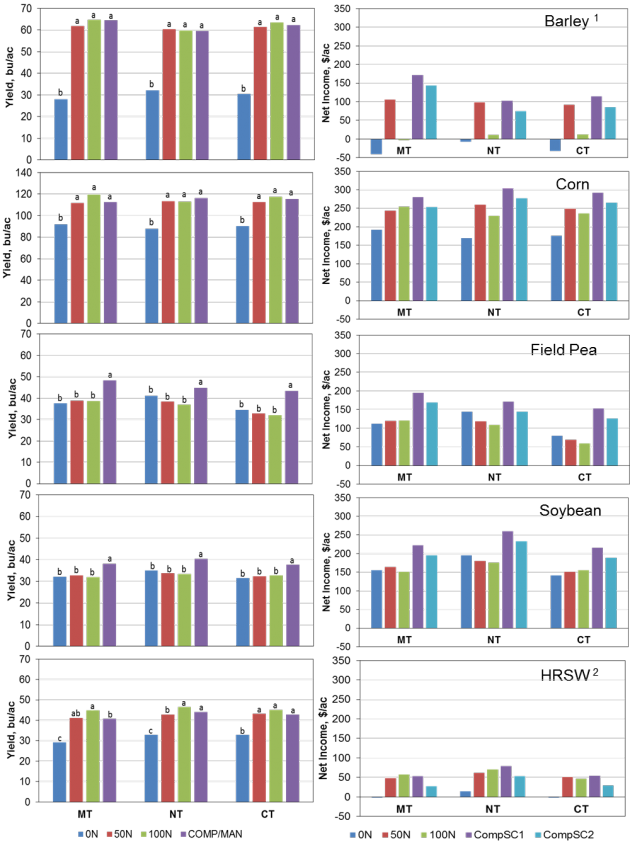
Figure 1. Average (2008-2014; 2009-2014 for barley and HRSW) yield3 (left) and net income (right) for crops in a long term cropping system at the NDSU Carrington REC, Carrington, ND. 0,50, and 100 N represent, respectively, 0, 50 and 100 lbs of N/ac. COMP

Figure 1. Average (2008-2014; 2009-2014 for barley and HRSW) yield3 (left) and net income (right) for crops in a long term cropping system at the NDSU Carrington REC, Carrington, ND. 0,50, and 100 N represent, respectively, 0, 50 and 100 lbs of N/ac. COMP/MAN= composted manure. MT= minimum tillage; NT= no tillage; CT= conventional tillage. CompSC1 and CompSC2 are compost manure scenarios 1 and 2, respectively. Averages followed by the same letter are not significantly different (Tukey Test, p=0.05). 1 Protein content: >12%= feed barley, <=12%= malting barley. 2 Wheat protein discount= $0.08/bu per 1/5 below 14%. 3 Provisional data.

Barley and corn yields were increased by nitrogen application, but there was no response to either N rates or source across the tillage systems (Figure 1). The field pea and soybean yield differences between the sources of N (Figure 1) was likely due to composted manure application every four years (2007 and 2011) regardless of the crop growing on those plots, while N fertilizer is applied only to non-leguminous crops. The composted manure (COMP/MAN) treatment produced similar HRSW yields to the highest N rate (100 lbs N/ac) treatment under no-till and conventional tillage and it was out yielded by the same treatment under minimum tillage.

The CompSC1 was the most profitable treatment across the tillage systems for the majority of the crops, except for HRSW. Similar results were seen even when the compost was paid for based on its N content (CompSC2). The lower income for barley with 100 lbs N/ac was due to the high protein in the kernel (feed barley=lower selling price). For HRSW, the CompSC1 treatment showed lower net income than the highest N rate under minimum tillage and higher net income under the other two tillage systems, while the CompSC2 treatment showed much lower income than the other N treatments. The higher income when using composted manure is due to both similar yields and lower production cost when using that product in comparison with the other N treatments. Protein content in HRSW was lower when using composted manure, which resulted in large protein discounts, which were over $50/ac in some cases.

Future Plans

In the future, we would like to investigate strategies for N application during the wheat growing season to boost protein content and net income per acre in areas fertilized with fresh feedlot manure.

Authors

Paulo Flores, Nutrient Management Specialist at NDSU Carrington Research Extension Center, paulo.flores@ndsu.edu.

Ezra Aberle, Research Specialist – Crop Systems at NDSU Carrington Research Extension Center

Additional information

For more information about the field research conducted on the long term cropping system, described on this summary, you are welcomed to contact Ezra Aberle (ezra.aberle@ndsu.edu) at the Carrington Research Extension Center (CREC, Phone: 701.652.2951). For more information about this summary please contact Paulo Flores (paulo.flores@ndsu.edu) at the CREC.

The authors are solely responsible for the content of these proceedings. The technical information does not necessarily reflect the official position of the sponsoring agencies or institutions represented by planning committee members, and inclusion and distribution herein does not constitute an endorsement of views expressed by the same. Printed materials included herein are not refereed publications. Citations should appear as follows. EXAMPLE: Authors. 2015. Title of presentation. Waste to Worth: Spreading Science and Solutions. Seattle, WA. March 31-April 3, 2015. URL of this page. Accessed on: today’s date.
 

Wisconsin Professional Manure Applicator Education

Why Look at Manure Applicator Educational Programs?

Based on 2013 statistics, Wisconsin has a dairy herd of 1.2 million cows that produce 12,000,000,000 gallons of manure and waste water. Custom manure haulers in Wisconsin handle an estimated fifty percent of the dairy manure and forty per cent of all livestock manure generated in Wisconsin. Because custom manure applicators are a critical component of nutrient management plan (NMP) implementation, University of Wisconsin Extension initiated manure hauler education across the state in the early 1990’s. In 2000, the applicators sought UW – Extension advisory support in forming the Professional Nutrient Applicators Association of Wisconsin (PNAAW). This began a long term relationship between UW – Extension and the professional applicators in Wisconsin and across the upper Midwest.

Following a needs assessment of the industry, the board of directors of PNAAW expressed an interest in a voluntary training and certification program. The overall goal of the training was to educate the custom manure haulers and their employees in safe handling and application practices, spill response, regulations and nutrient management. Road safety, neighbor relations, and confined space safety education modules were added later.

What did we do?

In March of 2002, the board of directors of the PNAAW and a group of Michigan manure applicators independently approached Extension in each state to initiate a voluntary certification and training program. Over the next 5 months, applicators and Extension staff examined the 5 existing manure applicator certification programs and created the program currently in use in Wisconsin, Illinois and Michigan.

Field photo 2012

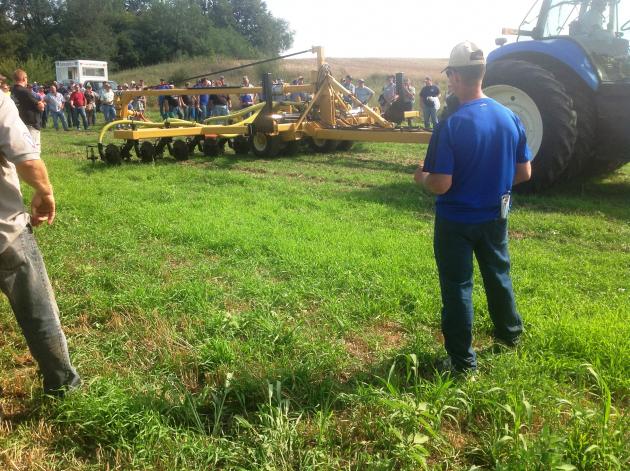
Manure expo 2012, checking out a new dragline applicator.

The UW – Extension Nutrient Management Team’s Custom Manure Hauler Workgroup joined with Extension faculty in Illinois and Michigan to develop a three-state certification program with three levels of training/certification. The certification includes a partnership with the insurance industry to provide a market-based incentive to participate. Business and employee management issues are addressed during an annual multi-state regional symposium coordinated by UW-Extension.

Certification: The program is segmented into three certification levels. Firms must meet level 1 requirement to gain level 2, and meet level 2 requirements to achieve level 3.

  • Level 1: Requires each employee to be trained and tested on spill response techniques, state specific regulations (including CAFO regulations) and common sense application techniques. Firms that document compliance are eligible for a 10% vehicle liability premium reduction. Training is ~3 hours in length and is completed annually.
  • Level 2: Requires crew supervisors and business owners to attend 6 hours of continuing education over a 2 year period. Classes are offered at field days and the annual conference. Once a firm has achieved Level 2, they may conduct Level 1 training in-house.
  • Level 3: Develop and implement an EMS (Environmental Management System). The EMS requires the firm to document their process and ensure all employees know their job responsibilities. Insurance auditors will evaluate each firm’s EMS annually to insure compliance. Premium reductions include 10-40% on vehicle liability and 50% on environmental liability.

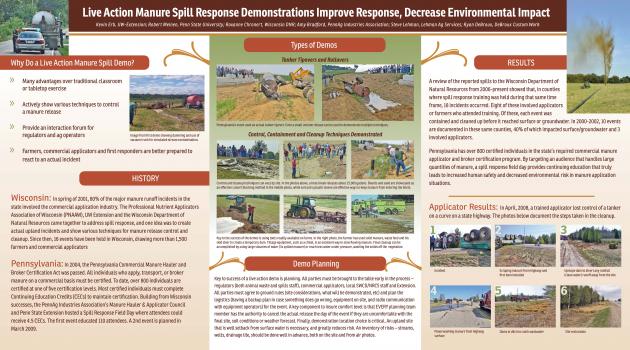
Not your typical Wisconsin “boat” show. PNAAW 2014 manure boat agitation demonstration, organized with UW-Extension.

All certification levels also require that the firm complete the PNAAW Performance Standards Checklist at least once per year.

Membership in the state’s applicator association is required for certification, as certification is granted by the association and not by Extension. Each state association may also require additional performance standards, such as documentation of equipment calibration, to grant certification.

One area of continuing education began in 2002, when UW – Extension with permission from Wisconsin Department of Natural Resources (WDNR), conducted manure spill response training using actual manure. The basic educational focus was containing, controlling, cleaning up, and then meeting reporting requirements of a spill. Since 2002, 20 live action demonstrations have occurred. Training has expanded to include calibrating of manure equipment and determining manure application rate per acre.

What have we learned?

PNAAW requested that Extension assist in filling an educational need not met by current farm shows – being able to compare different manure agitation and application equipment side by side in the field (using actual manure) to help determine which best meets individual needs. The result was the first Manure Expo in August 2001, which drew 432 people from 5 states and Canada.

The Manure Expo has grown to an annual 2-day educational and demonstration event. 2015 is the 13th Expo; the event has been hosted by Extension and custom applicators in Wisconsin, Michigan, Minnesota, Ohio, Iowa, Missouri, Nebraska, and Pennsylvania in the US and Guelph, Ontario, Canada. An average Expo will draw over 1,000 people from industry, university, farm, and application professionals.

PNAAW 2014

PNAAW 2014

The pit before the boat demonstration begins 2014.

The voluntary certification program has saved Wisconsin and Michigan over $100,000 annually because regulatory mandates require state finances for staff and office to run mandated programs. In addition to the sharing of curriculum in multiple Midwestern universities the training and educational sessions are a success in the formation/enhancement of three state associations in Michigan (now inactive), Pennsylvania, and Indiana/Ohio.

Applicator and industry partnerships contributed to a multi – state agriculture weight study based at the Minnesota DOT/University of Minnesota, MN Road Research Center. Over $640,000 was pooled from applicators and Applicator Associations (WI, MI, MN, IA, and OH), industry and agencies to fund research on the impact of larger manure hauling and agriculture equipment on pavement.

Custom manure applicators are a key component in the environmental application of manure. The Wisconsin Department of Agriculture, Trade, and Consumer Protection (DATCP) has tracked crop acres managed with a NMP. In 2004, 0.7 million crop acres were managed using a NMP; in 2014 the NMP managed acres increased to 2.58 million acres in Wisconsin.

Future Plans

Each year a new need will arise. Education will be provided for employee relations, business planning, family/work balance and the need to review new technology. A few projects that began in 2014: manure boat agitation field day and precision manure application. Education will be developed in the future as a need arises from the manure application industry.

Authors

Richard Halopka, CCA, Clark County UW-Extension Crops & Soils Agent richard.halopka@ces.uwex.edu

George Koepp, Columbia County UWEX Agriculture Agent, Jerry Clark,Chippewa County UWEX Crops/Soils Educator, Ted Bay, Grant County UWEX Crops/Farm Management Agent, Kevin Erb, UWEX Conservation Professional Devp. & Training Cord., Becky Larsen, UW Biowaste Specialist, Jim Leverich, UW On Farm Research, Kim Meyer, UW Arlington ARS, Cheryl Skjolaas, UW Agriculture Safety Specialist

Additional information

In 2014, over 400 custom manure applicators in Wisconsin were certified in at least one level of the program. Eight PNAAW member application firms revised their level 3 status in 2013 and are saving $44,000 annually on pollution insurance policies, while PNAAW firms achieving level 1 and level 2 certification reduced pollution insurance policies premiums by an additional $78,000 per year.

The collaboration of PNAAW, University of Wisconsin Extension, University of Wisconsin Specialists, WDNR, DATCP and UW – Extension County Agents has provided the foundation of a proactive approach to education and training, leading to problem solving results from a knowledgeable application industry.

https://www.facebook.com/pages/category/Nonprofit-Organization/Professional-Nutrient-Applicators-Association-of-Wisconsin-2223955430983054/  

2009 U.S.A. water quality poster, manure spills

2009 U.S.A. water quality poster, manure spills

Bulletin for manure spill response developed by UW-Extension nutrient management team PNAAW workgroup.

The authors are solely responsible for the content of these proceedings. The technical information does not necessarily reflect the official position of the sponsoring agencies or institutions represented by planning committee members, and inclusion and distribution herein does not constitute an endorsement of views expressed by the same. Printed materials included herein are not refereed publications. Citations should appear as follows. EXAMPLE: Authors. 2015. Title of presentation. Waste to Worth: Spreading Science and Solutions. Seattle, WA. March 31-April 3, 2015. URL of this page. Accessed on: today’s date.
Evaporation Ponds – Waste Storage Facility Design Spreadsheet

Purpose

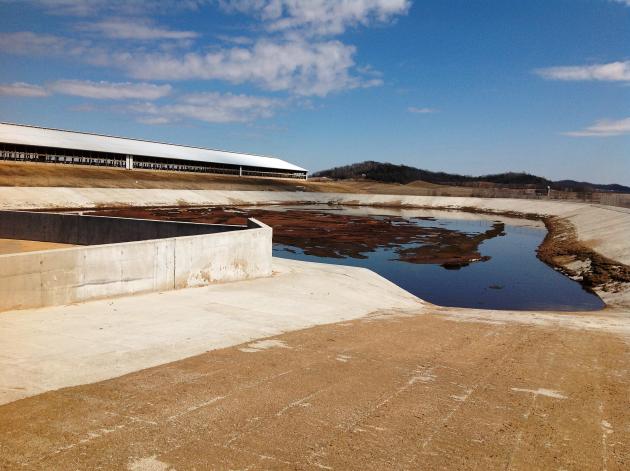
An assessment tool was developed to simplify the process of determining minimum waste storage pond (WSP) dimensions in conjunction with assuring adequate evaporation of stored runoff over time. In contrast to typical WSP designs that require intermittent pumping and handling of waste water, evaporation ponds (EPs), as waste storage facilities used to contain storm runoff from feedlots, offer long-term passive management and may be acceptable alternatives where annual evaporation exceeds rainfall and where landowners deem typical WSP designs as impractical.

What did we do?

EPs are passive management structures that allow landowners to avoid having to periodically evacuate accumulated water from typical WSPs via pumping or other means (active management). Both EP and WSP systems are designed to collect and store contaminated runoff and sediment from feedlots, but it is assumed that the use or disposal of the contaminated water is practical in the case of WSPs. It is not always practical. Some ranchers operating in arid areas who manage small feedlots during the winter have expressed interest in EPs over WSPs stating that the passive management method will keep their costs low while fitting better with their current operating systems.

At the onset of our first EP project, we found no NRCS tool specific to the design of EPs. The principles outlined in our Agricultural Waste Management Handbook (United States Department of Agriculture, NRCS, 1999) regarding waste storage facility design and our guidance for runoff produced during a 25-year, 24-hour precipitation event using the NRCS Curve Number Method (United States Department of Agriculture, NRCS, 2004) still apply. Next, we chose to build a spreadsheet that allows the designer to perform the multitude of computations needed to consider distinct EP geometric configurations, time periods, and hydrology in the design of EPs. In a nutshell, the model consists of estimating amounts of water and sediment that the EP retains while accounting for water losses due to evaporation and any periodic removal of sediment (Figure 1) over time. For any given EP geometry, the design is considered viable so long as the water level does not supersede the elevation of the embankment top minus freeboard.

The mathematical functions applied are deterministic and follow Natural Resource Conservation Service (NRCS) guidelines (United States Department of Agriculture, NRCS, 1999). Mean monthly evaporation and precipitation data are available via the National Oceanic and Atmospheric Administration website, and runoff from the 25-year, 24-hour precipitation event is estimated using the NRCS Curve Number Method (United States Department of Agriculture, NRCS, 2004).

What have we learned?

1) The design of evaporation ponds, to be used as waste storage facilities, is complex, entails many variables, and typically requires multi-year tests.

2) Simulation of waste storage pond storage levels over time provides visual results that allow the designer to observe expected behavior of these systems and judge whether or not evaporation ponds are viable alternative systems to typical waste storage facilities in which frequent evacuation of storage materials is required.

3) Calculations using a spreadsheet are simplified to the extent that dozens of scenarios can be assembled and executed within a reasonable timeframe. This allows designers to study the results from such sensitivity analyses where one or more variables must be examined at numerous levels/values due to uncertain data at particular sites.

Future Plans

1) Train NRCS field staff regarding the potential pros and cons pertinent to these systems in comparison to others.

2) Encourage landowners to consider evaporation ponds as viable alternatives in areas with low precipitation/runoff.

3) Monitor site input variable values and the evaporation pond sediment and water levels over time to assess whether or not the models applied forecast overall evaporation pond behavior.

Author

Donald Hanson, Design Engineer, Natural Resources Conservation Service donald.hanson@wa.usda.gov

Additional information                

Author’s contact via telephone: (509) 323-2949.

References

United States Department of Agriculture, NRCS (1999). National Engineering Handbook, Part 651, Agricultural Waste Management Field Handbook. Washington D.C.: Author. Retrieved 3/14/2014 at: http://directives.sc.egov.usda.gov/RollupViewer.aspx?hid=17092.
United States Department of Agriculture, NRCS (2004). National Engineering Handbook, Part 630, Estimation of Direct Runoff from Storm Rainfall. Washington D.C.: Author. Retrieved 1/6/2015 at: http://directives.sc.egov.usda.gov/RollupViewer.aspx?hid=17092.

Acknowledgements

I extend thanks to these NRCS cohorts for their cooperation and assistance during development of the tool and their comments and suggestions during reviews of this technical paper: Larry Johnson (State Conservation Engineer, Washington State), Joe Gasperi (State Geologist, Washington State), Sally Bredeweg (Environmental Engineer, West National Technical Service Center, Oregon State), Leigh Nelson (Water Management Engineer, National Water Management Center, Arkansas), and Noller Herbert (Director, Conservation Engineering Division, Washington, D.C.).

Waste storage pond sediment accumulation and water dynamics (10 years) chart

Waste storage pond sediment accumulation and water dynamics (10 years) chart

The authors are solely responsible for the content of these proceedings. The technical information does not necessarily reflect the official position of the sponsoring agencies or institutions represented by planning committee members, and inclusion and distribution herein does not constitute an endorsement of views expressed by the same. Printed materials included herein are not refereed publications. Citations should appear as follows. EXAMPLE: Authors. 2015. Title of presentation. Waste to Worth: Spreading Science and Solutions. Seattle, WA. March 31-April 3, 2015. URL of this page. Accessed on: today’s date.
Practical Use and Application of the Poultry Carbon Footprint Calculation Tool


Why Study Carbon Footprint on Poultry Farms?*          

The poultry industry is a major part of the agricultural industry in the United States, and an awareness of the carbon footprint of the industry is important for future growth and development. With carbon footprint estimated to be as high as 18% of total Green House Gas (GHG) emissions, changes in U.S. animal production systems will be a component in mitigating the impacts of the industry on climate change. Changes in GHG emissions from the poultry industry can be achieved only if the industry knows the levels of greenhouse gas emissions contributed as a result of poultry production.

What did we do? 

The Poultry Carbon Footprint Calculation Tool (PCFCT) was developed and designed specifically for poultry production farms. The tool can be used to estimate the greenhouse gas (GHG) emissions from pullet, breeder and broiler grow-out farms. While several life-cycle assessments have been completed for the production of poultry meat, there is no industry specific carbon footprint calculation tool available for the production phase of the poultry industry and since the poultry farmer only has control over the activities that take place on his farm, he can only make reductions of emissions at the farm-gate level. It is therefore important that a tool such as the PCFCT is available to deal with the farm level emissions.

The GHGs that are assessed are carbon dioxide, nitrous oxide and methane which are the gases of major concern in agriculture. The specific objectives of this study was to develop a computer-based, user-friendly calculation tool to assess greenhouse gas emissions from poultry farms and also to identify abatement strategies in on-farm management practices to reduce the footprint on farms. The user friendly PCFCT is an Excel spreadsheet into which the user will enter farm data to calculate the annual carbon footprint (Figure 1). The research included an assessment of the carbon footprint of test farms under industry management standards with focus placed on management practices and farm-expense data, particularly with regard to expenditures for energy-intensive inputs such as electricity and fuel which are the largest contributors to GHG emissions for poultry farms. This was used to identify potential areas of change.

The calculation tool was developed and then used to estimate the emissions from 30 test farms from three poultry companies in three different regions in Georgia.

What have we learned? 

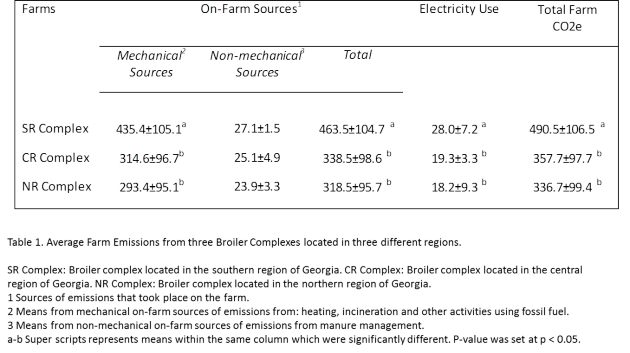
We observed that the major sources of greenhouse gas that are emitted on poultry production farms were from gas use and manure management. Based on these observations, the tool was then equipped to recommend improvements to the farm, which would in turn show the user potential reductions in GHG emissions and cost savings if the recommended improvements were implemented. The results from the study showed that there were significant differences in emissions from mechanical sources and electricity use between the southern region and the northern and central regions of the state (Table 1). The differences observed could be a result of; climatic differences, the dead bird disposal methods and also the duration of time the flock is kept on the farm.

Table 1. Average Farm Emissions from three Broiler Complexes located in three different regions.

The tool is also very useful for record keeping as it is designed with a printable inventory which will allow users to track and compare their emissions from year to year. It is also equipped with bar charts to show the user their current emissions compared to projected emissions if they apply the recommended changes. A second graph shows the percentage of emission from each source.

Future Plans    

The tool will be made available on the departmental website (uga.poultry.edu) for poultry producers, poultry company environmental personnel and extension personnel to utilize. Articles relevant to the subject will also be made available to users of the tool. Other future plans include incorporation of other segments of the industry (layer and turkey) into the tool.

Authors       

Claudia Dunkley, Ext. Poultry Scientist cdunkley@uga.edu

Brian Fairchild, Ext. Poultry Scientist, Casey Ritz, Ext. Poultry Scientist, Brian Kiepper, Ext. Poultry Scientist, John Worley, Ext. Engineer

Additional information                

www.poultry.uga.edu

C. S. Dunkley, University of Georgia, 2360 Rainwater Rd., Tifton, GA 31793-0478

Acknowledgements      

Funded by US Poultry & Egg Association

Figure 1. The PCFCT Interface page showing areas where farm data will be inputted, recommendations can be tried and an inventory showing the emissions and projections based on recommendations can be seen.

The authors are solely responsible for the content of these proceedings. The technical information does not necessarily reflect the official position of the sponsoring agencies or institutions represented by planning committee members, and inclusion and distribution herein does not constitute an endorsement of views expressed by the same. Printed materials included herein are not refereed publications. Citations should appear as follows. EXAMPLE: Authors. 2015. Title of presentation. Waste to Worth: Spreading Science and Solutions. Seattle, WA. March 31-April 3, 2015. URL of this page. Accessed on: today’s date.

The Importance of Nitrogen Stabilization

This session will highlight the importance of nitrification inhibitors and how they help delay the conversion of the ammonium form of nitrogen into the nitrate form which then can lead to leaching and denitrification. By using a nitorgen stabilizer, the plant has access to the ammonium form of nitrogen for a longer period of time in the root zone, where it needs it the most.

What Did We Do?

The active ingredient in Instinct II and N-Serve, nitrapyrin, is formulated to put the bacteria known as nitrosomonas, which convert the ammonia form of nitorgen to nitrate nitrogen in the soil, in a static state so that the ammonia form can be uptaken by the plant in the most stable form of nitrogen. Our product treats the soil, not the nitrogen, but uses nitrogen as the carrier, to prevent leaching and denitrification that can occur from warm, wet soils in the spring season. Our product has been tested and approved by the EPA for 40 years and has have numerous (189+) 3rd party and university data that supports that it does what we say it does, inhibits nitrification. In addition, there are other advantages to protecting your nitrogen investment which can lead to higher yields, faster dry down, higher test weight in corn and wheat and in addition, has no negative effect on protein on wheat. Instinct II can be used in UAN, Urea, or Liquid Manure. N-Serve is used on anhydrous ammonia.

What Have We Learned?

Based on the 189+ different 3rd party and university trials, plus the meta-anaylsis published in 2004, we have proven to increase crop yield by 7%, increase soil retention by 28%, decrease nitrogen leaching by 16%, and decease greenhouse gas emission by 51%. Our retention is extremely high on his product, and has proven to be a significant benefactor when used in manure (this year along, our averages on yield increase have been 12+ bushels). Future plans further expansion to outside of US markets, Canada, China, UK, and Australia alongside other EU countries. Further market expansion in the United States into other crops such as specialty crops markets, improvement on formulation for newer, expanding markets.

Author

Tiffany Galloway tlgalloway@dow.com

Additional Information

The authors are solely responsible for the content of these proceedings. The technical information does not necessarily reflect the official position of the sponsoring agencies or institutions represented by planning committee members, and inclusion and distribution herein does not constitute an endorsement of views expressed by the same. Printed materials included herein are not refereed publications. Citations should appear as follows. EXAMPLE: Authors. 2015. Title of presentation. Waste to Worth: Spreading Science and Solutions. Seattle, WA. March 31-April 3, 2015. URL of this page. Accessed on: today’s date.
The Natural Farming Concept: A New Economical Waste Management for Small Family Swine Farms


Why Look at Inoculated Deep Litter Systems?

The most critical issue facing livestock and other small family operations nationwide is the development and implementation of cost effective pollution prevention technology. Our livestock producers, especially swine, continue to seek a best management practice (BMP) that is effective, economical, and practical, and in compliance with new US EPA laws. The Department of Health, Natural Resource Conservation Service, Hawaii Soil and Water Conservation Districts and the Cooperative Extension Service have been working diligently to address both federal and state waste management compliance needs of the local pork producer. As a result, the industry currently implements effluent irrigation, composting, deep litter technology, lagoon storage and solid separation as possible solutions for on-farm nutrient management. Unfortunately, due to new and revised EPA regulations, which now include nuisance odor and vector components, many of these strategies no longer meet federal criteria for BMPs.

In 2006, a system of waste management, with the potential to be implemented as a BMP under federal regulations, was discovered in Korea during a visit to the Janong Natural Farming Institution. The concepts of naturally collected micro-organisms, green waste deep litter, and a piggery design with strategic solar and wind positioning was being practiced in several countries in Asia and the Pacific Basin. Over the past six years, these concepts have been tested in Hawaiʻi to provide small swine farms with another BMP that is in compliance with current EPA regulations.

What did we do? 

For the past six years, the Extension Service has been touring many hog farms and conducting numerous educational seminars on the Inoculated Deep Litter System (IDLS). The number of IDLS piggery operators has increased dramatically due to farmers coming out of retirement, producers retrofitting and replacing their wash-down swine operations as well as new farmers trying their hand at raising hogs. A major factor of the great interest toward the IDLS piggery is the minimal labor and time to operate the system compared to the traditional style of raising hogs with daily wash downs of the pig pens. Other important factors include the concept of collected micro-organisms, a layering of the deep litter green waste system, and designing piggery housing with strategic solar and wind positioning to keep the facility cool and dry. The success of the IDLS system is exemplified by the following: 1) Low maintenance since litter pens never have to be cleaned, 2)has no odor or ve ctor problems if managed correctly and 3) development of cost effective housing.

What have we learned? 

IDLS incorporates four components: 1) self-collected, site-specific (or indigenous) micro-organisms (IMOs), 2) green waste, 3) natural ventilation, and 4) facility positioning relative to sunlight. The livestock facility is kept dry with natural ventilation and sunlight, which promotes proper fermentation of the pen litter (combination of green waste and livestock waste) thus preventing nuisance fly breeding and odors generated by proliferation of undesirable organisms.

Solar positioning. The building’s foundation is positioned from north to south, with the south end serving as the entrance to the facility. This takes advantage of maximizing sunlight traveling east to west, which provides adequate ultraviolet light, heating, and drying. Sunlight and ventilation help to promote drying, thus preventing liquid accumulation (from livestock waste, watering nipples or troughs, rain) in the litter, which deters the fermentation process from turning anaerobic, and eliminates conditions ideal for odor and fly breeding. (Note: orientation applies to the Northern Hemisphere and positioning should be reversed for application in the Southern Hemisphere.)

Natural ventilation. The building is designed with a high (14 ft H), vented roof, and walls (10 ft H) which have openings to the outside. Cool trade winds are allowed to blow through the building, forcing warm air to rise and be eliminated through the vented roof. This helps to dissipate heat generated from microbial fermentation in the litter, keeps the litter dry through constant air movement, and cools the facility during the hot season. During the rainy season, simple roll-down siding can be installed to keep rain out.

Deep Litter. In order to fulfill EPA regulations that require an impervious bottom to all waste handling facilities, there must be either a concrete slab or a thick (30 mil) plastic liner as the base of the building. Green waste, with a minimum depth of 4 feet, is then strategically layered to start the IDLS. The first layer consists of roughly a half foot of cinders mixed with bio-char (not charcoal briquettes). The second layer consists of 2 feet of cut logs. Logs should be at least 3 to 4 feet long and can range in diameter from 2” or more (larger, longer logs deter pigs from rooting them to the surface). The third layer is comprised of either leaves or fronds covered with assorted green waste. The next step is too lightly spread about one pound of IMO-4 and soil to every 50 square feet of surface area in the IDLS pen. For example, a 100 sq ft pen will require 2 pounds of IMO-4 applied in the third layer. The final step is to add about a half foot of sawd ust. Two weeks before introducing animals into the pens, activate the microbes once with a mist spray of lactic acid bacteria (LAB) and fermented plant Juice (FPJ). You can add animals to the pen once you smell a yeasty odor in the litter, a sign that the microbes have been activated and are at work in the pen.

Micro-organisms: The only micro-organisms used are self-collected by the producer from the specific site of the facility. The profile of indigenous micro-organisms may vary greatly from place to place, from windward to leeward coasts, and even between neighboring properties. The initial, one-time misting with lactic acid bacteria (LAB) and fermented plant juice (FPJ) activates the microbes to increase in numbers. To learn how to make these activators, please attend a Natural Farming Input-Making class, or contact the Hawaiʻi Cooperative Extension Service (mduponte@hawaii.edu).

LAB and FPJ: These are self-made inputs. Go to CTAHR website for free publication

Future Plans 

Adaptation of concept overcome a major hurdle when the IDLS piggery became cost sharable with the federal government on November 15, 2012 and deemed a best management practice. Hog farmers who practice the IDLS are eligible in entering into a cost-share agreement with the U.S. Department of Agriculture (USDA) for Environmental Quality Incentive Program (EQIP) assistance and may file an application at any time and will further enhance the participation in the IDLSTo date nearly 50 retrofitted or new operations have been established in Hawaii. The IDLS has been introduced and being practiced in 11 states, Micronesia and various countries of the world. Future plans include implementing the technology to large scale operations, making of feed utilizing other natural farming techniques and evaluating the compost for organic plant propagation. The system is currently being tested with Poultry Production

Author   

Michael DuPonte, Extension Agent University of Hawaii at Manoa, College of Tropical Agriculture and Human Resources (CTAHR). mduponte@hawaii.edu

Additional information 

Publications

H. Park and M.W. DuPonte., 2010., How to Cultivate Indigenous Microorganisms, Biotechnology, CTAHR., June, BIO-9.

M. DuPonte and D. Fischer., Most Frequently Asked Questions on the IDLS Piggery, The Natural Farming Concept A New Economical Waste Management Stem for the Small Family Swine Farms in Hawaii., 2012., Livestock Management., Sept. , LM-23

D. M. Ikeda, Weinert Jr., E., Chang K.C.S., Mc Ginn, J.M., Miller S., Keliihoomalu, and DuPonte, M.W., 2013., Natural Farming: Fermented Plant Juice, Sustainable Agriculture, CTAHR., July, SA-7.

S. Miller, Ikeda, D.M., Weinert Jr., E., Chang K.C.S., Mc Ginn, J.M., Keliihoomalu, and DuPonte, M.W., Natural Farming: Lactic Acid Bacteria, Sustainable Agriculture, CTAHR., August, SA-8.

Acknowledgements      

Kang Farms of Kurtistown, Hawaii, David Fischer (NRCS), Justin Perry III (NRCS) and Lehua Wall (CTAHR)

The authors are solely responsible for the content of these proceedings. The technical information does not necessarily reflect the official position of the sponsoring agencies or institutions represented by planning committee members, and inclusion and distribution herein does not constitute an endorsement of views expressed by the same. Printed materials included herein are not refereed publications. Citations should appear as follows. EXAMPLE: Authors. 2015. Title of presentation. Waste to Worth: Spreading Science and Solutions. Seattle, WA. March 31-April 3, 2015. URL of this page. Accessed on: today’s date.

Composting Swine Slurry to Reduce Indicators and Antibiotic Resistance Genes


Purpose 

Over the last twenty years there have been considerable increases in the incidence of human infections with bacteria that are resistant to commonly used antibiotics. This has precipitated concerns about the use of antibiotics in livestock production. Composting of swine manure has several advantages, liquid slurries are converted to solid, the total volume of material is reduced and the stabilized product is more easily transported off-site. The goal of this study was to determine if composting can also be used to reduce the concentration of indicators and bacteria containing genes for antibiotic resistance (AR) in swine manure.

What did we do? 

Sample Analysis:

Compost trials were conducted in either fall (FT) or spring (ST) and piles were turned once, three times or upon reaching 65 ºC. Microbial indicators and populations with AR genes for tetracycline, erythromycin and sulfonamide resistance were quantified by culture and/or quantitative, real-time (qPCR) analysis.

Compost materials and conditions:

Decomposed materials (a mixture of swine slurry and woodchips) were obtained on two separate occasions from swine high-rise finishing facilities (HRFF) located in western Kentucky. The HRFF houses between 4,000 and 4,800 swine which are placed in the facility at 18 to 20 kg and are removed after three months (weighing about 105 kg). The high-rise floor raises the living area 3.7 m above the ground. Manure, excess feed, water and wastewater drop through slatted floors into 2.5 cm screened woodchips (average size 1.9 ± 0.9 cm). The slurry-woodchip material was turned up to three times per week while under the HRFF. When the material was visibly moist, reducing its ability to absorb additional waste materials, it was removed from the facility for finishing in windrows. In fall 2011 (FT) and Spring 2012 (ST), HRFF slurry-woodchip mix (approximately 60 m3 weighing 48.4 Mg) was brought by semi-trailer trucks to the Western Kentucky University Agricultural complex where ma terials were divided into three or four windrow piles. In the FT, swine slurry-woodchip mixes having a bulk density of 849.6 kg m-3 and consisting of around 19.6 m3 of material were formed into three piles of approximately 10.4 m x 2.1 m x 0.9 m (L x W x H). In the ST, swine slurry-woodchip mixes having a bulk density of 778.4 kg m-3 and consisting of around 18.8 m3 of material were formed into three piles of approximately 5.8 m x 2.7 m x 1.2 m (L x W x H) and a fourth batch (unturned) was left piled at the side (0X; 3.6 m3). In each study, piles were turned using a windrow compost turner either once per week (1X), three times per week (3X) or upon the internal compost temperature reaching 65 ºC (@65). Compost for the FT @65 treatment heated to 65 ºC by day 14 and was turned 11 times over the course of the trial. However, during the ST, the @65 pile did not heat for the first 63 days (mean temperature 27 ± 8 ºC) therefore weekly turning was initiated at that time. Samples were taken on days 0 and three and then weekly for the first 12 weeks and bi-weekly until composting was stopped at day 112 for the FT and day 142 for the ST.

What have we learned? 

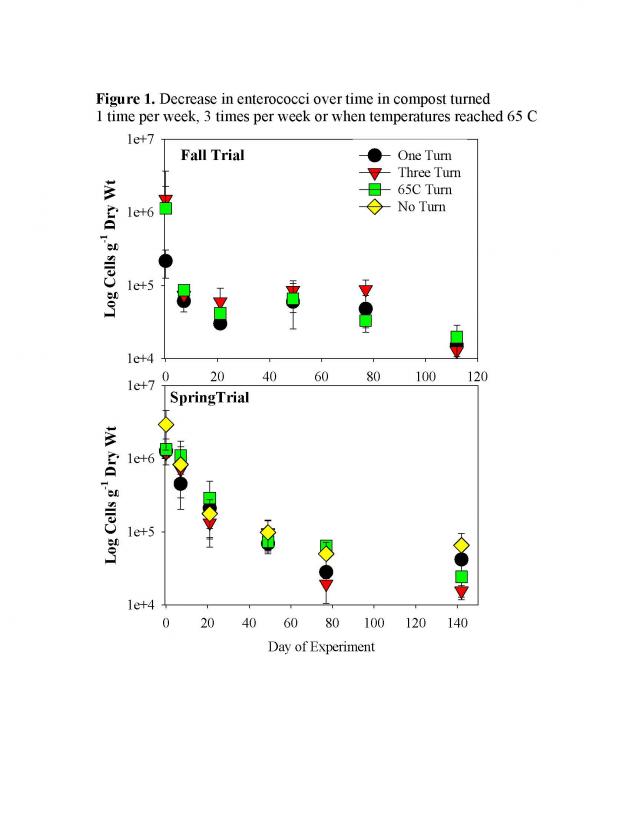
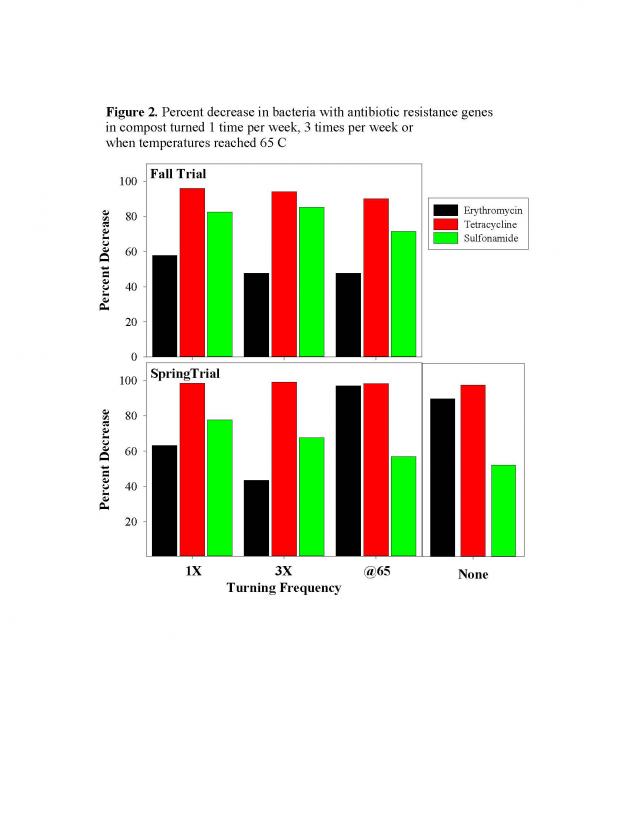
In the FT, concentrations of enterococci decreased below culturable detection within 21 days, corresponding with a 99% decrease in detection by qPCR (Fig. 1). Similar decreases in qPCR detection in the ST took longer (day 49 or day 77 of composting). Changes in the concentration of bacteria with AR genes varied by antibiotic type (erythromycin (36% – 97%), tetracycline (94% to 99%) and sulfonamide (53% to 84%) and compost season (greater decreases in ST). There were few differences based on turning regime. Even the unturned compost pile had 90%, 98% and 56% reduction in bacteria resistant to erythromycin, tetracycline and sulfonamide, respectively.

Results suggest that composting effectively decreases the concentration of indicators and AR genes in swine manure. As concerns over antibiotic resistance and pathogens increase, composting provides a valuable manure management tool for decreasing contaminants and improving the value of this material as a soil conditioner.

Future Plans    

Volume reduction, low moisture and low readily degradable organic matter suggest that the finished compost would have lower transportation costs and should provide value as a soil conditioner. Studies are warranted to evaluate its agronomic value as an alternative source of plant nutrients. Future studies will be conducted to evaluate the nutrient value this compost as an organic fertilizer for row crop production.

Authors       

Kimberly Cook, Research Microbiologist, USDA ARS kim.cook@ars.usda.gov

Carl Bolster, USDA ARS; Karamat Sistani, USDA ARS

Additional information                

http://www.ars.usda.gov/main/site_main.htm?modecode=50-40-05-00

Acknowledgements      

This research was conducted as part of USDA-ARS National Program 214: Agricultural and Industrial By-products: CRIS 6445-12630-004-00D. Mention of trade names or commercial products in this article is solely for the purpose of providing specific information and does not imply recommendation or endorsement by the USDA.

Proceedings cook figures 1

Proceedings cook figures 1
Proceedings cook figures 2

Proceedings cook figures 2


The authors are solely responsible for the content of these proceedings. The technical information does not necessarily reflect the official position of the sponsoring agencies or institutions represented by planning committee members, and inclusion and distribution herein does not constitute an endorsement of views expressed by the same. Printed materials included herein are not refereed publications. Citations should appear as follows. EXAMPLE: Authors. 2015. Title of presentation. Waste to Worth: Spreading Science and Solutions. Seattle, WA. March 31-April 3, 2015. URL of this page. Accessed on: today’s date.
Economic Recovery of Nitrogen and Phosphorus from Anaerobic Digestate as Concentrated Ammonium Hydroxide and Hydroxyapatite

The  paper describes the laboratory and pilot studies of an autotrophic fixed film reactor, the rotating photo-bioreactor (RPB), that reclaims concentrated ammonia and phosphorus from anaerobic digestate.

Why Recover Nutrients from Anaerobic Digestion?

All of the nitrogen and phosphorus present in an anaerobic digester’s influent can be found in the effluent digestate. However, during the digestion process the organic nitrogen is by and large converted to ammonia, and the organic phosphorus converted to soluble orthophosphate. The ammonia and phosphorus are normally discharged to holding ponds prior to field application. The pH increases in the holding ponds due to the loss of CO2 resulting in a shift of the ammonium (NH4+) to toxic  ammonia gas (NH3) that is subsequently lost to the atmosphere. Upon land application additional ammonia losses occur and dissolved orthophosphate leached.

Anaerobic digestion does not recover the nutrients as often claimed. Some of the nutrients accompanied by pathogens, hormones, and antibiotics are land applied to improve agricultural yields. The remaining nutrients are lost to the environment. Methods to reclaim ammonia are limited to high temperature ammonia stripping, or ion exchange with acid stripping of NH3 to form dilute solutions of ammonium sulfate or ammonium nitrate. Those methods require chemical reactants and produce products having little economic value. Other options include recovery of a portion (< 15%) of the nitrogen and a majority of the orthophosphate found in digestate, with the addition of magnesium, as crystalline struvite (MgNH4PO4.6H2O). However, that process is expensive, requires reactants, removes only a portion of the nitrogen and may be inhibited by the presence of calcium in the digestate requiring acidification.

Figure 1. laboratory scale rotating photo bioreactorWhat Did We Do?

This work was performed to verify a process for recovering ammonia as a highly concentrated and valued ammonium hydroxide and the orthophosphate as solid hydroxyapatite. Based on both previous pilot investigations, and the work of others, the RPB process was expected to remove and recover 80% to 90% of the ammonia and phosphate without the addition of chemicals, at normal digestate temperatures, and ambient pressures. Products that had a value greater than the cost of recovery were expected to be produced. The process uses a single reactor containing concentrated phototrophic organisms (cyanobacteria) that consume the bicarbonate alkalinity of the substrate for growth and thereby raise the pH, shifting the digestate ammonium to ammonia gas that can be stripped at low temperatures. The high pH and low bicarbonate concentration used in ammonia recovery are also required for the precipitation of orthophosphate as calcium carbonate or hydroxyapatite.  The removal and reclamation of both ammonia and phosphate require an elevated pH and low bicarbonate alkalinity produced by the cyanobacteria.

Three laboratory scale rotating photo bioreactors, shown in Figure 1, were constructed to verify the removal and recovery of ammonia as a highly concentrated ammonium hydroxide solution that could be sold as diesel exhaust fluid. The lab scale pilot used cyanobacteria to increase the solution pH and shift the ammonium to ammonia gas that was continuously removed by recycled air flowing over the plates. The bioreactors were operated at 3.5 RPM using different attached growth media, under different lighting (30 – 80 PAR) conditions, stripping gas flow rates, and Hydraulic Retention Times (HRT). Concentrated, turbid, anaerobic centrate, having an ammonia concentration between 1,000 and 2,400 mg/L, was utilized as the substrate.

What We Have Learned?

The laboratory scale pilot bioreactors were able to establish that carbon fiber was the best fixed film media from a variety of inorganic fabrics.  The operation further established that the stripping gas flowing over the cyanobacteria growth plates was sufficient to strip essentially all of the ammonia gas and thus eliminate ammonia toxicity to the cyanobacteria. Light intensity controlled the cyanobacteria growth rates, and thus the pH of the solution. The optimum HRT is yet to be determined. The system is currently operating at a 6 hour HRT but the final value may be significantly lower.  Concentrated (15%) ammonia is currently being recovered but the final values are expected to be greater.

Future Plans

This study investigated most of the variables associated with stripping and recovering ammonia from a turbid, highly concentrated, digestate using a fixed film autotrophic system.  The optimum rotation rate was one of the few variables not thoroughly investigated. The results obtained have established the basis for the design and construction of a pilot facility that will reclaim ammonia as a valued diesel exhaust fluid for Selective Catalytic Reduction (SCR) of combustion NOx thus eliminating, the two primary sources of reactive nitrogen discharged to the environment. Future work will focus on removing and reclaiming sufficient quantities of ammonia as diesel exhaust fluid and testing the fluid in diesel engines that use SCR to remove exhaust NOx.

Author

Dennis A. Burke PE, CEO, Environmental Energy & Engineering Company;  waeng@me.com

Nutrient Management aka, Nutrient Reclamation from all organic waste

The authors are solely responsible for the content of these proceedings. The technical information does not necessarily reflect the official position of the sponsoring agencies or institutions represented by planning committee members, and inclusion and distribution herein does not constitute an endorsement of views expressed by the same. Printed materials included herein are not refereed publications. Citations should appear as follows. EXAMPLE: Authors. 2015. Title of presentation. Waste to Worth: Spreading Science and Solutions. Seattle, WA. March 31-April 3, 2015. URL of this page. Accessed on: today’s date.
Reducing the Costs and Environmental Footprint of Pig Diets with the Experimental Optimum Synthetic Amino Acid Inclusion


Why Look at Reducing Crude Protein in Pig Diets

Nitrogen (N2) compounds from swine feces and urine are oxidized and reduced by soil and air, whereas some N2 is released into the atmosphere as nitrous oxide (N2O). Research has demonstrated that reducing crude protein (CP) and maximizing synthetic amino acids (SAA) in swine diets can reduce N2 excretion. Thus, there is strong push for more sustainable production of soy or replacement with other protein sources.

The preliminary cost and environmental evaluation showed that pig diets with higher amounts of SAAs have higher cost, climate change impact (CCI), and water depletion (WD) than the typical US diet defined. This is due to the increased amounts of corn in a diet. Thus, a list of alternative energy and protein feed ingredients were tested in WUFFDA with the goal to replace corn and further reduce the amount of soybean meal in pig diets.

What did we do? 

Windows-based User Friendly Feed Formulation (WUFFDA) linear models were used to formulate single-objective least cost and least environmental footprint pig. Control diet is a typical soybean-corn formulation which was used as a baseline to evaluate cost and environmental footprint of an alternate diet. The test diet is a reduced crude protein diet with max 0.75% added Lysine-HCL in nursery and max 0.56 % added Lysine-HCL grower-finisher phases. We also added the US pig industry top 80 most used feed ingredients to the WUFFDA. Nutrient characteristics, inclusion limits, environmental footprint, and cost data for feed ingredients were obtained from the US Animal Feed Database and incorporated into WUFFDA models.

What have we learned? 

It was found that reduction in cost of a diet formulation can be achieved by omitting the use of milk whey powder (nursery phase). Replacing corn with wheat middlings could reduce cost and CCI. CCI can be reduced by use of corn gluten meal, and corn gluten feed (grow phases).

Future Plans 

The projected diets will be further investigated for nutrient constraints, validated through PPEC, and Simapro 8.1. life cycle assessment (LCA) model as well as with other experts such as nutritionists and economists. The projected diets will be will be available in the Pig Production Environmental Calculator (PPEC).

Authors

Jasmina Burek, Research Associate, University of Arkansas jburek@uark.edu

Greg Thoma, Jennie Popp, Charles Maxwell, Rick Ulrich

Additional information 

Pig Production Environmental Calculator:

http://www.pork.org/production-topics/environmental-sustainability-effor…

Life-Cycle Assessment Modeling for the Pork Industry:

https://lpelc.org/life-cycle-assessment-modeling-for-the-pork-industry

National Pork Board (2015) Carbon Footprint of Pork Production Calculator – Pork Checkoff.

Pesti G, Thomson E, Bakalli R, et al. (2004) Windows User-Friendly Feed Formulation (WUFFF DA) Version1.02.

PRé Consultants (2014) SimaPro 8.3. 4555022.

Acknowledgements

This research is part of the program “Climate Change Mitigation and Adaptation in Agriculture,” and is supported by Agriculture and Food Research Initiative Competitive Grant no. 2011-68002-30208 from the USDA National Institute of Food and Agriculture.

The authors are solely responsible for the content of these proceedings. The technical information does not necessarily reflect the official position of the sponsoring agencies or institutions represented by planning committee members, and inclusion and distribution herein does not constitute an endorsement of views expressed by the same. Printed materials included herein are not refereed publications. Citations should appear as follows. EXAMPLE: Authors. 2015. Title of presentation. Waste to Worth: Spreading Science and Solutions. Seattle, WA. March 31-April 3, 2015. URL of this page. Accessed on: today’s date.

Overwinter transformation and fate of fall-applied manure nitrogen

There is growing evidence that soil nutrient cycling is sustained during the non-growing season in the northern regions of Canada. However, the extent of the transformations and loss of fall-applied manure N is not well documented. The NH4-N fraction of liquid dairy cattle manure, liquid swine manure, and ammonium sulfate was enriched with 15N radioactive isotope, and all N sources were applied to bare sandy loams in early November at sites located in contrasted climate (mean annual temperature 1 to 10°C; mean annual precipitation 300 to 1300 mm; mean snow cover depth <5 to 70 cm). The experiment was replicated over two years at each site. Soils were sampled on the week of application, in November, and at intervals until next May. The recovery of applied 15N in soil NH4-N, NO3-N and organic N pools was measured in the 0-30 cm depth. Soil temperature was also monitored at the 5, 20 and 50 cm depths. Although the transformation of applied ammonium was delayed in colder areas, the transformation of 15NH4-N was generally completed by April, generally before seeding of the next crop. Both nitrification and immobilization of fall-applied 15NH4-N occurred throughout the non-growing season at all sites. As a result, residual 15N was essentially recovered as NO3-N and organic N in the following spring. In most cases, more than 50% of fall-applied 15N was not recovered in the following spring. In general, more 15NH4-N was immobilized with manures than ammonium sulfate, possibly because of the presence of fresh carbon in the manure. As a result, more 15N was recovered in the spring with the manure, and this was particularly obvious at the warmer sites. We conclude that a significant portion of fall-applied NH4-N may be lost during the non-growing season, even in areas with cold and long winter period.

Purpose

It is now recognized that biological processes involved in nitrogen (N) cycling are sustained in agricultural soils under frozen conditions (Clark et al., 2009; Maljanen et al., 2007; Virkajärvi et al., 2010), and that a significant portion of N present in soils in the fall may be transformed and lost during the non-growing season (Jayasundara et al., 2010; Chantigny et al., 2014). However, the extent to which fall-applied N fertilizer, and especially manure-N, can be lost as a function of local winter conditions (e.g. snow cover depth, frost penetration) is not known. Climate models are currently predicting that global warming will result in reduced snow fall, deeper frost penetration and more freeze-thaw cycles in soils of North America (Henry, 2008). This will have impacts on soil biological processes (Groffman et al., 2001), but it is not possible to predict how it may influence the fate of fall-applied N. Our objective was to use a multi-site approach to determine the extent of transformation and loss of fall-applied N during the non-growing season under contrasted winter conditions.

What did we do?

Pig slurry and dairy cattle slurry were enriched with 15N by adding a small amount of ammonium sulfate (99 atom% 15N). This approach allowed tracing of the readily available fraction of manure N (ammonia-N) in the soil N pools. Ammonium sulfate labelled at 5 atom% 15N was also included in the experiment as a no-carbon control treatment. The three treatments were applied to bare loamy soils (top 10 cm) in late fall (first week of November) at four sites located in different climatic zones of Canada: Pacific Maritimes [Mean annual temperature (MAT), 10.5°C; Mean annual precipitation (MAP), 1755 mm; average snow depth (ASD), < 1cm]; Prairies [MAT, 5.7°C; MAP, 383 mm; ASD, 3 cm]; Mixed Wood Plain [MAT, 6.3°C; MAP, 914 mm; ASD, 13 cm]; Boreal Shield [MAT, 4.2°C; MAP, 1213 mm; ASD, 44 cm]. The experiment was repeated in 2009-10 and 2010-11 at all sites. Soils were sampled to 30 cm depth on the week of application, and at intervals until early May to determine the amount of manure N recovered in the NH4, NO3 and organic (immobilized) N pools, as a function of time since application.

Overwinter transformation and fate of fall-applied manure nitrogen

What have we learned?

Fall-applied N was transformed and lost throughout the non-growing season at all sites (Fig. 1). Losses were rapid at the warmest site (Pacific Maritimes), and more gradual at the other sites where colder soil temperatures were recorded. Yet, six months after application (late April – early May) only 10 to 50% of fall-applied 15N was recovered in the top 30 cm of soil suggesting very significant loss of manure N during this period. Immobilization and nitrification of applied 15NH4 occurred throughout the non-growing season at all sites (data not shown), and 15N recovered in the next spring was essentially present as NO3 and organic N. At two sites, a greater proportion of applied 15N was recovered in the spring with the manures than ammonium sulfate, and more of this residual 15N was in the organic form in the manure treatments. This suggests that carbon present in the manure stimulated immobilization and retention of fall-applied N in soil. Overall, the results indicate that the readily available fraction of fall-applied N is at high risk of loss during winter, and that changes in soil conditions induced by global warming may not have a great influence on this process or on the manure-N transformation during winter.

References

Chantigny M.H., Angers D.A., Rochette P., Pomar C., Pelster D.E. 2014. Evidencing overwinter loss of residual organic and clay-fixed nitrogen from side-dressed, 15N-labelled pig slurry. Can. J. Soil Sci. 94:1-8.

Clark K., Chantigny M.H., Angers D.A., Rochette P., Parent L.E. 2009. Nitrogen transformations in cold and frozen agricultural soils following organic amendments. Soil Biol. Biochem. 41:348-356.

Groffman P.M., Driscoll C.T., Fahey T.J., Hardy J.P., Fitzhugh R.D., Tierney, G.L. 2001. Colder soils in a warmer world: A snow manipulation study in a northern hardwood forest ecosystem. Biogeochemistry 56, 135-150.

Henry, H.A.L. 2008. Climate change and soil freezing dynamics: Historical trends and projected changes. Climatic Change 87, 421-434.

Jayasundara, S., Wagner-Riddle, C., Parkin, G., Lauzon, J., Fan, M.Z. 2010. Transformations and losses of swine manure 15N as affected by aopplication timing at two contrasting sites.

Maljanen M., Kohonen, A.R., Virkajärvi P., Martikainen P.J. 2007. Fluxes and production of N2O, CO2 and CH4 in boreal agricultural soil during winter as affected by snow cover. Tellus, Series B: Chem. Phys. Meteor. 59, 853-859.

Virkajärvi P., Maljanen M., Saarijarvi K., Haapala J., Martikainen P.J. 2010. N2O emissions from boreal grass and grass-clover pasture soils. Agric. Ecosyst. Environ. 137, 59-67.

Future Plans

Now that we evidenced the significance of losses of fall-applied N from soils during the winter period under varied climatic conditions, we are initiating field work to determine best practices for fall application of manure (e.g. early vs. late fall application; use of additives to delay nitrification of manure ammonia) that will mitigate losses and help efficiently transferring applied N to crop in the next spring.

Corresponding author, title, and affiliation

Martin H. Chantigny, Soil Scientist, Agriculture and Agri-Food Canada, Quebec

Corresponding author email

martin.chantigny@agr.gc.ca

Other authors

Frank J. Larney, Agric. and Agri-Food Canada, Lethbridge; Shabtai Bittman, Agric. and Agri-Food Canada, Agassiz; David Lapen, Agric. and Agri-Food Canada, Ottawa; Denis A. Angers, Philippe Rochette, Agric. and Agri-Food Canada, Quebec

Additional information

Scientific papers and reports can be accessed through my webpage:  www.agr.gc.ca/fra/science-et-innovation/centres-de-recherche/quebec/centre-de-recherche-et-de-developpement-sur-les-sols-et-les-grandes-cultures/personnel-et-expertise-scientifiques/chantigny-martin-phd/?id=1181933396583

Acknowledgements

This project was financially supported by the Sustainable AGriculture Environmental Systems (SAGES) Initiative of Agriculture and Agri-Food Canada

The authors are solely responsible for the content of these proceedings. The technical information does not necessarily reflect the official position of the sponsoring agencies or institutions represented by planning committee members, and inclusion and distribution herein does not constitute an endorsement of views expressed by the same. Printed materials included herein are not refereed publications. Citations should appear as follows. EXAMPLE: Authors. 2015. Title of presentation. Waste to Worth: Spreading Science and Solutions. Seattle, WA. March 31-April 3, 2015. URL of this page. Accessed on: today’s date.