World Agriculture is currently faced with the challenge of feeding a rapidly increasing global population, predicted to peak at 9.2 billion by 2075, while meeting an obligation to reduce greenhouse gas (GHG) emissions. The emission of GHG can cause many serious problems, such as global temperature rise, sea level rise and ocean acidification.
Agriculture releases significant amounts of CO2, CH4 and N2O to the atmosphere. It is estimated that the agriculture sector contributes around 10-12% (~ 5-6 Gt CO2-equivelents yr-1 in 2005) of total global anthropogenic GHG emissions, which is about 50 and 60% of methane and nitrous oxide emissions, respectively. UGA made a commitment to reduce the GHG emissions. These emissions are currently calculated using a model called campus-carbon-calculator. However this model is limited in agricultural applications because it does not account for many management changes that might reduce GHG emissions. The purpos e of our project was to select or develop a model for estimating the GHG emissions from UGA farms. It was necessary for this model to account for crop production, dairy production and swine production and desirable for the model to have limited data requirements, be easy to use and allow for a variety of management options to reduce GHG emissions.
What did we do?
We selected four models (Cool Farm Tool (Version 2.0), COMET-FARM Tool, Farm Smart (Version 1.5) and Pig Production Environmental Footprint Calculator (Version 3.X)) and also used the current-used model Clean Air-Cool Planet Campus Carbon Calculator (Version 6.9) to calculate GHG emissions on the UGA swine farm and dairy farm. We gathered inputs needed in both farms based on models with the help of farm managers, experts and references. Some inputs needed to be calculated and summarized and this was done using best available information. We entered information about swine farm into selected models and compared results on GHG emissions.
What have we learned?
GHG emissions for the swine farm calculated using four different models are shown in Table 1. Estimates for GHG emissions in 2013 varied from 328228.06 kg CO2-equivalent (Pig Production Environmental Footprint Calculator (Version 3.X)) to 575000 kg CO2-equivalent using Clean Air-Cool Planet Campus Carbon Calculator (Version 6.9). While the Clean Air-Cool Planet Campus Carbon Calculator (Version 6.9) was the simplest one to use with only two inputs needed, it provided the highest estimates. Conversely, the Pig Production Environmental Footprint Calculator (Version 3.X) was the most complex and difficult to use but was the only tool that could adequately account for the anaerobic digester at this farm.
We will finish calculating GHG emissions on the dairy farm and compare models based on carbon footprints and time and effort required. We will investigate a variety of proposed management changes on both farms to determine the resulting impacts on carbon footprints.
Authors
Lin Ma, master student in Department of Crop and Soil Science, University of Georgia malin12@uga.edu
Mark Risse, professor in Department of Crop and Soil Science, University of Georgia
Thanks to Drs. Lane Ely and Robert Dove and the employees and managers at the UGA Swine and Dairy Centers for supplying information and time to us for this effort.
The authors are solely responsible for the content of these proceedings. The technical information does not necessarily reflect the official position of the sponsoring agencies or institutions represented by planning committee members, and inclusion and distribution herein does not constitute an endorsement of views expressed by the same. Printed materials included herein are not refereed publications. Citations should appear as follows. EXAMPLE: Authors. 2015. Title of presentation. Waste to Worth: Spreading Science and Solutions. Seattle, WA. March 31-April 3, 2015. URL of this page. Accessed on: today’s date.
Our long term goal is to develop a robust phosphorus (P) recovery technology suitable for use on dairy farms of all sizes through an integrated research and extension program for manure nutrient recovery. Enrichment of water bodies by P in agricultural runoff has been and remains the focus of water quality protection. Animal feeding operations (AFOs), regardless of size, especially in sensitive ecosystems and the Chesapeake Bay (Bay) in particular, have been identified as major contributors to water and air pollution. These operations are facing extra scrutiny by state and federal regulation agencies with regards to nutrient management. Although nutrient management plans have not been required for most dairy farms in Virginia, this status is changing rapidly. Nutrient reductions in unregulated small dairies has been identified as part of the strategy to clean up the Bay. Our project focuses manure P management on dairy farms and will particularly benefit dairy farms in Shenandoah Valley, Virginia and Lancaster County, Pennsylvania, where excess P in manure is a huge challenge. The dairies in these localities are predominantly small and are key drivers of local economies. About 1,928 (averaging 60 milking cows per farm) and 321 (averaging 80 cows per farms) facilities are located in Lancaster county and central Shenandoah Valley, respectively (USDA NASS, 2014). If implemented on farms, our project will help remove the excess P and allow the continued use of manure as a fertilizer in areas that may be restricted by the P-based manure application regulations. Also, it will help prevent over application of P, which is a typical result of applying manure to meet crop N needs.
What did we do?
We use the “designer manures” approach as a guiding philosophy to manure nutrient management. Our working definition of designer manure is “a manure based product with the appropriate balance of N and P fertilizer values that meet specific requirements of different crops”. We conducted lab scale tests using chemical salts of aluminum, iron and calcium to identify the most effective chemical and method to recover manure P in scraped dairy manure. In the state of Virginia, the total solids (TS) content of manure from most dairies ranges between 4 to 6%. This TS range requires dilution to bring the levels to about 2% for chemicals to precipitate manure effectively. Dilution was achieved using supernate (process liquid) to dilute 4% TS dairy manure to recover P. Our lab studies have shown aluminum to be the best chemical.
What have we learned?
Some of our results are shown in Figure 1 for aluminum chloride and aluminum sulfate. Using 600 mg Al/L we are able to remove over 95% of the total P (supernate liquid). No significant accumulation of metal salts or solids was observed in the supernate even after eight passes. Iron based chemicals produced too much foam and the resulting sludge with very poor settling characteristics. This project has the potential of concentrating manure P into small volumes and quantities that can be transported off farm and positively impact the nutrient management practices on farms.
Chemical precipitation has not been widely adopted for agricultural purposes because (1) they require a very dilute manure stream and require some sort of automated application, (2) cost of the chemicals may be high and not enough expertise on the farm to handle chemicals, and (3) solids and nutrients precipitated still need to be managed appropriately. We are actively seeking funds to install a demonstration unit on a farm where producers and other interested parties can come learn how to overcome these challenges and experience the technology.
Sampath Karunarathne, Graduate Student; Madonna Yoder, Research Assistant
Additional information
DeBusk, J.A., J.A. Ogejo, K.F. Knowlton, N.G. Love. 2008. Chemical phosphorus removal for separated flushed dairy manure. Applied Engineering in Agriculture 24(4): 499-506
The authors are solely responsible for the content of these proceedings. The technical information does not necessarily reflect the official position of the sponsoring agencies or institutions represented by planning committee members, and inclusion and distribution herein does not constitute an endorsement of views expressed by the same. Printed materials included herein are not refereed publications. Citations should appear as follows. EXAMPLE: Authors. 2015. Title of presentation. Waste to Worth: Spreading Science and Solutions. Seattle, WA. March 31-April 3, 2015. URL of this page. Accessed on: today’s date.
To illustrate a case study design and construction of a phosphorus removal structure on a poultry farm, and to present the basics of how to properly design a structure.
What did we do?
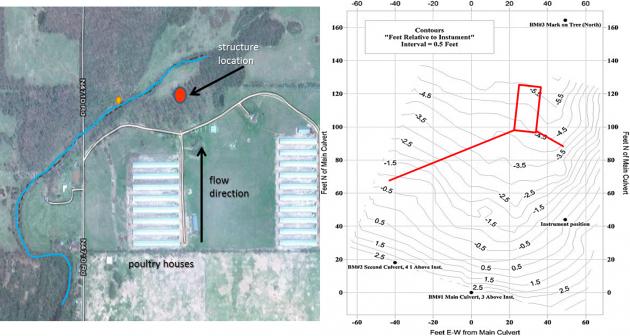
We constructed a phosphorus (P) removal structure on a poultry farm in Eastern OK; this is a BMP that can remove dissolved P loading in the short term until soil legacy P concentrations decrease below levels of environmental concern. A P removal structure contains P sorbing materials (PSMs) and are placed in a location to intercept runoff or subsurface drainage with high dissolved P concentrations. As high P water flows through the PSMs, dissolved P is sorbed onto the materials by several potential mechanisms, allowing low P water to exit the structure. While they vary in form, P removal structures contain three main elements: 1) use of a filter material that has a high affinity for P, 2) containment of the material, and 3) the ability to remove that material and replace it after it becomes saturated with P and is no longer effective.
A site was identified which met all criteria for justification of construction of a P removal structure: 1) elevated dissolved P concentrations in runoff (>0.2 ppm), 2) hydraulic connectivity between the runoff/drainage produced and a surface water body, and 3) flow convergence: the site possessed potential to channel the runoff water to a single point in order to treat the water. This site was located on a poultry farm in Eastern OK.
The site was surveyed in order to obtain the necessary inputs for properly designing the P removal structure. This involved a basic NRCS survey to estimate watershed size, peak flow rates, and average annual runoff volume. In addition, several runoff grab samples were taken and analyzed for dissolved P. This information was used to determine the average annual dissolved P load, which was 45 lbs.
Knowing flow and P load parameters, we additionally chose P removal targets and desired lifetime of the structure. We chose to design a structure that would remove 20 lbs of dissolved P during the first year and be able to handle 700 gpm flow rate. Several hypothetical designs were made based on the available P sorbing materials (PSMs), such as drinking water treatment residuals, acid mine residuals, and gypsum. We chose to use a treated steel slag material as the PSM in the structure; this required about 35 tons of material.
After construction, the performance of the structure was monitored by measuring flow rates and dissolved P concentrations at the inlet and outlet. In addition, we developed software to aid in proper design of a site specific P removal structure using any PSM, in order to meet desired P removal goals and lifetime. Alternatively, this software can be used to predict the performance and lifetime of a P removal structure that has been already constructed. Licensing of software is available for private industry.
We constructed a P removal structure on a poultry farm in Eastern OK; this is a BMP that can remove dissolved P loading in the short term until soil legacy P concentrations decrease below levels of environmental concern. A P removal structure contains P sorbing materials (PSMs) and are placed in a location to intercept runoff or subsurface drainage with high dissolved P concentrations. As high P water flows through the PSMs, dissolved P is sorbed onto the materials by several potential mechanisms, allowing low P water to exit the structure. While they vary in form, P removal structures contain three main elements: 1) use of a filter material that has a high affinity for P, 2) containment of the material, and 3) the ability to remove that material and replace it after it becomes saturated with P and is no longer effective.
A site was identified which met all criteria for justification of construction of a P removal structure: 1) elevated dissolved P concentrations in runoff (>0.2 ppm), 2) hydraulic connectivity between the runoff/drainage produced and a surface water body, and 3) flow convergence: the site possessed potential to channel the runoff water to a single point in order to treat the water. This site was located on a poultry farm in Eastern OK.
The site was surveyed in order to obtain the necessary inputs for properly designing the P removal structure. This involved a basic NRCS survey to estimate watershed size, peak flow rates, and average annual runoff volume. In addition, several runoff grab samples were taken and analyzed for dissolved P. This information was used to determine the average annual dissolved P load, which was 45 lbs.
Knowing flow and P load parameters, we additionally chose P removal targets and desired lifetime of the structure. We chose to design a structure that would remove 20 lbs of dissolved P during the first year and be able to handle 700 gpm flow rate. Several hypothetical designs were made based on the available P sorbing materials (PSMs), such as drinking water treatment residuals, acid mine residuals, and gypsum. We chose to use a treated steel slag material as the PSM in the structure; this required about 35 tons of material.
After construction, the performance of the structure was monitored by measuring flow rates and dissolved P concentrations at the inlet and outlet. In addition, we developed software to aid in proper design of a site specific P removal structure using any PSM, in order to meet desired P removal goals and lifetime. Alternatively, this software can be used to predict the performance and lifetime of a P removal structure that has been already constructed. Licensing of software is available for private industry.
What have we learned?
The P removal structure has removed approximately 67% of all dissolved P that has flowed into it over a 16-month time period. In addition, it has handled all flow volume from every event, including a runoff event that resulted in 600 gpm. That single event delivered 2/3 lb of dissolved P, in which the structure removed 66%. While the structure is removing P as predicted based on P loading, the structure has greatly outlasted the goal of removing 45% of cumulative dissolved P in one year. This is due to the below average rainfall received over the last two years.
We also learned about the potential positives and negatives of using certain PSMs. For example, although we could have used other PSMs, in much smaller quantities (2-10 tons) that would remove equal amounts of P, we would have had to build a structure that was much larger in surface area, due to the fact that the hydraulic conductivity of these PSMs is relatively low. It is also possible to build these structures with other materials for the frame, such as concrete, earth, or wood. Structures can be constructed in ditches or potentially in the subsurface to treat tile drainage.
Last, we have some sense of economics for P removal structures and the general cost of P removal compared to other BMPs.
Future Plans
We will continue to monitor the structure. In addition, we are cooperating with several people throughout the US in helping to design P removal structures. We are also releasing design software for licensing in an attempt to promote commercialization of this BMP through private industry. A NRCS standard is currently underway and the goal is for this BMP to become cost-shared. Last, we are continuing to investigate the economics of P removal structure over a large scale area.
Authors
Chad Penn, Associate professor of agricultural and environmental chemistry, Oklahoma State University chad.penn@okstate.edu
Josh Payne, Animal waste specialist, Oklahoma State University; James Bowen, graduate assistant; Stuart Wilson, senior research specialist, Oklahoma State University; Josh McGrath, associate professor of nutrient management, University of Kentucky
The authors are solely responsible for the content of these proceedings. The technical information does not necessarily reflect the official position of the sponsoring agencies or institutions represented by planning committee members, and inclusion and distribution herein does not constitute an endorsement of views expressed by the same. Printed materials included herein are not refereed publications. Citations should appear as follows. EXAMPLE: Authors. 2015. Title of presentation. Waste to Worth: Spreading Science and Solutions. Seattle, WA. March 31-April 3, 2015. URL of this page. Accessed on: today’s date.
The anaerobic digestion (AD) industry often is in need of laboratory testing to assist them with issues related to project development, digester performance and operation, and co-digestion incorporation. This presentation will highlight laboratory procedures that can be carried out through a University partnership, including biochemical methane productivity (BMP), specific methane activity assays (SMA), anaerobic toxicity assays (ATA), solids, nutrient and elemental proximate analysis for inputs, outputs and co-products, as well as a host of other activities. The presentation will illustrate the lessons that can be learned from the results of these tests, using real-life examples of testing already completed for industry partners.
Why Provide Guidance on Laboratory Testing for Anaerobic Digestion?
Laboratory testing allows characterization of anaerobic digestion (AD) inputs, outputs, and process stability. Testing can be carried out within AD industry laboratories, and they can also be carried out through partnerships with active AD research laboratories at academic institutions. The purpose of this project was to provide a document that summarizes common laboratory procedures that are used to evaluate AD influents, effluents, and process stability and to illustrate real-life examples of laboratory test results.
What did we do?
The overview of common laboratory procedures was written based on the need to introduce third-party AD developers and government agencies to evaluating AD outputs and process stability. The authors are practiced at performing AD laboratory tests and have expertise and valuable information concerning these types of evaluations. Following a description of each test, we included the purpose of the test and an example of how the test results can be interpreted.
What have we learned?
Laboratory testing of AD samples is performed to determine the concentration of certain constituents such as organic carbon, volatile fatty acids, ammonia-N, organic-N, phosphorus, and methane. Contaminants can be tested for such as fecal coliform indicator pathogens, pesticides, and pharmaceuticals. Understanding the concentration of specific constituents enables informed decisions to be made about appropriate effluent management.
Biochemical methane potential (BMP) and specific methanogenic activity (SMA) tests are used to estimate the biogas and methane that can be produced from an organic waste or wastewater during AD. These tests are often used by industry during the design phase to predict total biogas output, allowing for correct sizing of engines and estimation of potential revenue.
Anaerobic toxicity assays (ATAs) test the effect of different materials on biogas production. Unknown inhibitors may reside within new feedstock materials which can lead to an unanticipated reduction in digester performance, so it is important to use ATAs to test the effect of new feedstock material on the AD system before it is used. A common example is when energy-rich organic materials are added to a digester that practices co-digestion.
Future Plans
Future plans are to prepare an extension fact sheet about the basics of anaerobic digestion effluents and processes, including the overview of common laboratory testing used to evaluate AD influents, effluents, and process stability.
This research was supported by funding from USDA National Institute of Food and Agriculture, Contract #2012-6800219814; and by Biomass Research Funds from the WSU Agricultural Research Center.
The authors are solely responsible for the content of these proceedings. The technical information does not necessarily reflect the official position of the sponsoring agencies or institutions represented by planning committee members, and inclusion and distribution herein does not constitute an endorsement of views expressed by the same. Printed materials included herein are not refereed publications. Citations should appear as follows. EXAMPLE: Authors. 2015. Title of presentation. Waste to Worth: Spreading Science and Solutions. Seattle, WA. March 31-April 3, 2015. URL of this page. Accessed on: today’s date.
Gaseous emissions from animal feeding operations (AFOs) can create adverse impacts ranging from short-term local effects on air quality, to long-term effects due to greenhouse gas generation. This study evaluates gaseous emissions from manure application with differing times to incorporation. The purpose of the study is to identify ways to improve manure management and land application BMPs in semi-arid regions with a high soil pH.
What did we do?
Manure application and incorporation methods were evaluated in a field setting on a soil with high pH. Scraped dairy manure was surface applied at a rate of 50 tons/acre to a Millville silt loam. Incorporation events occurred immediately, 24hrs after application, 72 hrs after application, and no incorporation. Gaseous emissions were monitored using a closed dynamic chamber with a Fourier Transformed Infrared (FTIR) spectroscopy gas analyzer, which is capable of monitoring 15-pre-programmed gases simultaneously including ammonia, carbon dioxide, methane, nitrous oxide, oxides of nitrogen, and volatile organic compounds. Emissions were monitored for 15 days.
What have we learned?
Emissions for methane (CH4) and ammonia (NH3) stopped when the manure was incorporated. For methane, 33% of the emissions occurred within the first 24 hours, 61% within the first 72 hrs. For ammonia, 50% of the emissions occurred within the first 24 hours, 88% within the first 72 hours. Carbon dioxide (CO2) emissions were reduced, but continued at a baseline level after incorporation. Immediate incorporation reduced total CO2 emissions for the 15 days by approximately 50%. Incorporation within 24 hours and 72 hours, reduced total CO2 emissions for the 15 days by 40% and 18%, respectively. Based on this data, incorporation greatly reduces NH3, CH4, and CO2 emissions. Rapid incorporation is needed to have a meaningful impact on NH3 and CH4 emissions. Best management practices should emphasize the need for immediate incorporation.
Examine the impact of tannins on gaseous emissions.
Authors
Rhonda Miller, Ph.D.; Agricultural Systems Technology and Education Dept.; Utah State University rhonda.miller@usu.edu
Pakorn Sutitarnnontr, Ph.D.; South Florida Water Management District; Naples, FL Markus Tuller, Ph.D.; Soil, Water, and Environmental Science Dept.; University of Arizona Jim Walworth, Ph.D.; Soil, Water, and Environmental Science Dept.; University of Ar
Additional Information
Sutitarnnonntr, P., E. Hu, R. Miller, M. Tuller, and S. B. Jones. 2013. Measurement Accuracy of a Multiplexed Portable FTIR- Surface Chamber System for Estimating Gas Emissions. ASABE 2013 Paper and Presentation No. 131620669. St. Joseph, MI: American Society of Agricultural and Biological Engineers.
The authors gratefully acknowledge support from a USDA-CSREES AFRI Air Quality Program Grant #2010-85112-50524.
The authors are solely responsible for the content of these proceedings. The technical information does not necessarily reflect the official position of the sponsoring agencies or institutions represented by planning committee members, and inclusion and distribution herein does not constitute an endorsement of views expressed by the same. Printed materials included herein are not refereed publications. Citations should appear as follows. EXAMPLE: Authors. 2015. Title of presentation. Waste to Worth: Spreading Science and Solutions. Seattle, WA. March 31-April 3, 2015. URL of this page. Accessed on: today’s date.
The purpose of this research was to investigate the degradation of four animal husbandry antibiotics during anaerobic digestion (AD) and study biogas inhibition from the antibiotics. This study was designed to fill information gaps related to AD inhibition by different antibiotic classes in diluted manures received by anaerobic digesters, particularly cattle manure, and the need to more thoroughly investigate antibiotic degradation products from the AD process.
What did we do?
We conducted AD bench-scale experiments that investigated biogas inhibition and antibiotic degradation. First, cattle manure was added to glass bottles. A known amount of antibiotic standard was added to the manure. A small amount of dilution water was added and the manure-antibiotic slurry was mixed briefly. Then, anaerobic digestion inoculum was added to the bottle. The air in the bottle was purged with nitrogen gas. Finally, the bottles were sealed and placed in an incubator set at 37°C. Biogas measurements and small liquid samples for antibiotic analysis were taken daily. At the end of the 40 day AD study, the solids were extracted to determine the amount of antibiotic adsorbed to the solids.
What have we learned?
Results from our research showed that three out of four antibiotics degraded within 5 days of AD. Several degradation products were detected, some of which could be biologically active. The antibiotic that did not degrade was mostly found in the liquid phase of the AD reactor slurry and a small portion was adsorbed to the solids. Our results suggest that when antibiotic contaminated feedstocks are added to AD reactors, persistent antibiotics and transformation products may contaminate the liquid and solid effluents.
Our results showed the one of the antibiotics tested was more toxic to the AD process. Approximately 6.4-36 mg/L florfenicol lowered biogas production by 5-40%. Greater than 91 mg/L of the other antibiotics was needed to lower biogas production. These higher concentrations can be found in urine and feces of treated animals but they are not typical for the AD reactor following the addition of multiple feedstocks, inoculum, and dilution water. Our results suggest that there is little concern for these antibiotics to lower biogas production when cattle manure is used as an AD feedstock because the antibiotic concentration should be below inhibitory concentrations.
Future Plans
Future research plans are to investigate the microbial population change in anaerobic digesters due to antibiotic contaminated cattle manure.
This research was supported by Biomass Research Funds from the WSU Agricultural Research Center; and by the BioAg (Biologically Intensive Agriculture and Organic Farming) Grant Program of the Washington State University Center for Sustaining Agriculture and Natural Resources.
The authors are solely responsible for the content of these proceedings. The technical information does not necessarily reflect the official position of the sponsoring agencies or institutions represented by planning committee members, and inclusion and distribution herein does not constitute an endorsement of views expressed by the same. Printed materials included herein are not refereed publications. Citations should appear as follows. EXAMPLE: Authors. 2015. Title of presentation. Waste to Worth: Spreading Science and Solutions. Seattle, WA. March 31-April 3, 2015. URL of this page. Accessed on: today’s date.
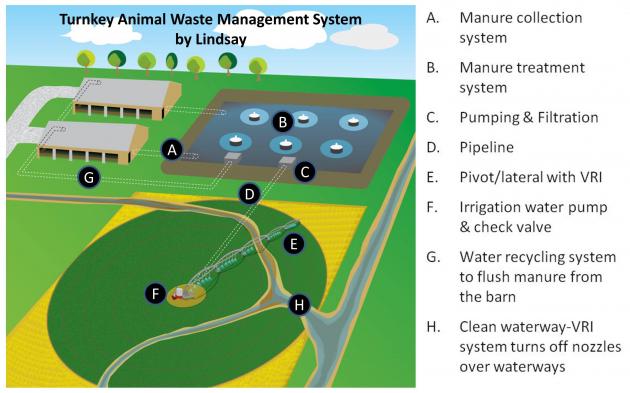
Applying livestock manure from lagoon storage through center pivot irrigation has long been considered a low-labor, uniform method of application that can deliver nutrients in-season to a growing crop. Three challenges with this system have been odor, pivot nozzle clogging and loss of nitrogen. A new innovation in lagoon treatment addresses these challenges. Low-power circulators were installed at a Northeast Nebraska commercial hog finishing facility and used to aerate the lagoon by moving oxygen-rich water and beneficial microbes to the bottom of the lagoon, reducing odor and potent greenhouse gases while lowering disease pathogen risk. This process preserved nitrogen and made it 40-60% more available in the first year of application. Circulation also reduced lagoon solids and bottom sludge, resulting in reduced agitation and dredging expense. Having a continuously well-mixed lagoon facilitated accurate manure nutrient sampling and consistent nutrient concentration delivery to the irrigation system. Combined with the ease of calibration of the center pivots, precision uniform nutrient application was achieved. Center pivot application had several additional advantages over tractor-based systems: less soil compaction, optimal nutrient timing during plant growth, higher uniformity, lower labor and energy costs, and eliminating impact on public roads. The circulators combined with flush barns and center pivot irrigation creates a complete turn-key manure management system.
Do Circulators Make a Difference in Liquid Manure Storage?
The purpose of the project was to evaluate the effectiveness of low powered circulators to treat livestock waste in lagoons. The objective was to evaluate how the addition of circulators to a livestock pond would change: 1. Odor levels, 2. Pivot nozzle clogging problems, and 3. Nitrogen loss.
What did we do?
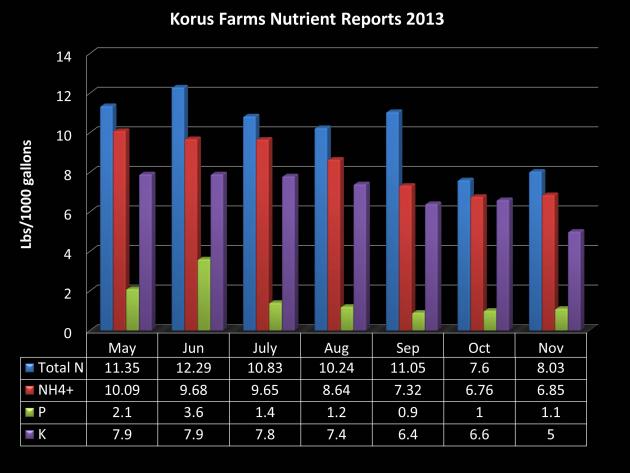
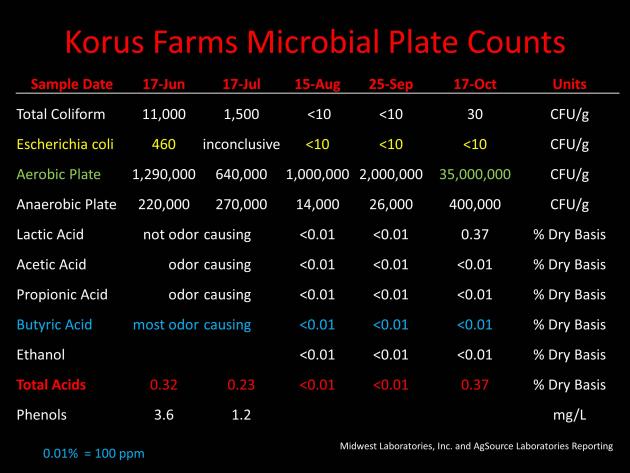
A demonstration was conducted by installing five circulators on a lagoon receiving manure from a 3000 pig finisher facility. The lagoon is owned by a Lindsay customer that was already pumping the top water from the pond through pivots, but was having difficulty with plugging nozzles and was hiring a commercial pumper to agitate and pump solids. The circulators were installed in May of 2013. Starting with the day of installation and each month after through November 2013, effluent lab samples were collected, photos of the pond and effluent were taken, and odor level estimated.
The effluent was pumped through pivots where odor and nozzle clogging problems were evaluated on August 15th and December 2nd of 2013. The pond was refilled with fresh water, circulated for a few days, and re-pumped right after the August 15th event so more of the nutrients could be utilized by the crops.
What have we learned?
The benefits of using aerobic lagoons with livestock waste have been known for many years. The challenge has been finding a cost effective and reliable method to facilitate the process. The cost to run all five circulators was about $3300 per year figuring $0.10 per kWh.
The circulators facilitated the following changes in the pond:
Reduced dry matter in effluent to <0.4%-starting at 0.57% and ending at 0.37%
Greatly reduced hog hair and soybean hulls caught in the filter resulting in virtually eliminating nozzle and pressure regulator clogging on the pivot
Reduced solids and bottom sludge-sonar indicated a 5+ ft reduction in bottom solids in 5 months
Doubled 1st year availability of nitrogen-%NH4 to total N was >80% compared to average book values of 40%
Greatly reduced offensive manure odor-downwind from pivot applying effluent, very little odor was observed
Reduced disease pathogens-Total Coliform went 11,000 to 30 CFU/g & Escherichia coli went from 460 to <10 CFU/g
Reduced flies-virtually eliminated floating solids and fly habitat on the pond
Reduced severe greenhouse gasses (GHGs)
Generated safer and lower odor water to recycled back through the barn for manure removal
Future Plans
We would like to continue evaluating the system for more precise odor reduction ratings, nitrogen preservation during pond storage, and affect on disease pathogens.
Call Steve Melvin at 402-829 6815 for additional information.
The authors are solely responsible for the content of these proceedings. The technical information does not necessarily reflect the official position of the sponsoring agencies or institutions represented by planning committee members, and inclusion and distribution herein does not constitute an endorsement of views expressed by the same. Printed materials included herein are not refereed publications. Citations should appear as follows. EXAMPLE: Authors. 2015. Title of presentation. Waste to Worth: Spreading Science and Solutions. Seattle, WA. March 31-April 3, 2015. URL of this page. Accessed on: today’s date.
How Does Management Impact Ammonia, Hydrogen Sulfide & Greenhouse Gases In Dairy Barns?
Emissions of pollutant gases from dairy barns are dependent on manure retention time in the barn and the quality of flushing water (for manure-flush systems). Strategies for mitigating air emissions from barns thus are a function of manure management either via optimal flushing or scraping, and pretreatment of flushing water.
What did we do?
Ammonia (NH3), hydrogen sulfide (H2S), and greenhouse gases (CO2, CH4, and N2O) emissions, under different manure collection strategies, from a naturally ventilated dairy barn housing about 850 lactating Holstein cows were measured using an on-site real-time monitoring system. The manure collection strategies evaluated included: (i) altering manure-flushing frequency, (ii) alternating flushing and scraping to remove manure, and (iii) manure solids separation system via centrifugation of the flush water.
What have we learned?
Doubling flushing frequency (every 3 h flushing) did not significantly affect NH3 emission (25.5 g cow-1 d-1) compared to the normal every 6 h flushing (24.5 g cow-1 d-1) but reduced CO2 emission by 7.3%. On the hand, H2S, CH4, and N2O emissions were 1.3, 176% and 18.5% higher at the 3-h flushing schedule than at the normal 6-h flushing schedule. Flushing at half the frequency (every 12 h) reduced H2S, CO2, and CH4 by 59.4, 19.8 and 28.5%, respectively. Alternating manure flushing and manure scraping (or vacuuming) every 6 h, decreased CO2, CH4, and N2O emissions by 13.0, 7.8 and 19.5% compared to normal 6-h manure flushing alone. Use of centrifuged water for manure flushing significantly improved emissions mitigations more than all other strategies. Emissions of all the five gases decreased by 43.0 % for NH3, 37.3 % for H2S, 1.2% for CO2, 3.7% for CH4, and 51.7 % for N2O under the latter practice.
Future Plans
Evaluation of other manure management practices which have not previously or adequately been tested at full-scale facilities or operations.
Authors
P.M. Ndegwa, Associate Professor, Biological Systems Engineering, Washington State University, PO Box 646120, Pullman, WA 99164, USA ndegwa@wsu.edu
H.S Joo, G.M. Neerackal, X. Wang; Department of Biological Systems Engineering, Washington State University, Pullman, WA.; and J.H. Harrison; Department of Animal Sciences, Washington State University, Puyallup, WA.
Additional information
• Joo H., P. Ndegwa, G. Neerackal, X. Wang, J. Harrison, J. Neibergs. 2013. Effects of manure management on ammonia, hydrogen sulfide, and greenhouse gases emissions from naturally ventilated dairy barns. ASABE Annual International Conference. Paper number 131593447; Kansas City, Missouri, July 21 – July 24. (doi: http://dx.doi.org/10.13031/aim.20131593447).
• Neerackal, G.M., H.S. Joo, P.M. Ndegwa, J.H. Harrison. 2014. Manure-pH management for mitigating ammonia emissions from manure-flush dairy barns. ASABE and CSBE/SCGAB Annual International Meeting. Paper number 1892636; Montreal, Quebec, Canada, July 13-17.
Acknowledgements
This study was partially supported by funds from USDA-NRCS-CIG program (Grant No. 69-3A75-11-210), and Washington State University Agricultural Research Center. The cooperation and assistance of the collaborating producer is also acknowledged.
The authors are solely responsible for the content of these proceedings. The technical information does not necessarily reflect the official position of the sponsoring agencies or institutions represented by planning committee members, and inclusion and distribution herein does not constitute an endorsement of views expressed by the same. Printed materials included herein are not refereed publications. Citations should appear as follows. EXAMPLE: Authors. 2015. Title of presentation. Waste to Worth: Spreading Science and Solutions. Seattle, WA. March 31-April 3, 2015. URL of this page. Accessed on: today’s date.
Rotational grazing is a recommended strategy to improve pasture health and animal performance. Previous studies have reported improved forage quality in rotationally grazed pastures compared to those continuously grazed by cattle, but data are limited for horse pastures.
What did we do?
A study at the University of Tennessee was conducted to evaluate the effects of rotational grazing on the nutrient content of horse pastures. A 2.02 ha rotational grazing pasture (RG) and a 2.02 ha continuous grazing pasture (CG) were each grazed by three adult horses at a stocking rate of 0.6 ha/horse over a two year period. The RG system was divided into four 0.40 ha paddocks and a heavy use area. Pastures were maintained at uniform maximum height of 15 to 20 cm by mowing. Horses were rotated between the RG paddocks every 10 to 14 d, or when forage was grazed to a height of approximately 8 cm. Pasture forage samples (n = 520) were collected and composited monthly (n = 14) during the growing season (April to November) by clipping forage from randomly placed 0.25 m2 quadrates from RG and CG, as well as before and after grazing each RG paddock. Botanical composition and percent ground cover were visually assessed. Forage samples were oven dried at 60°C in a forced air oven for 72 h to determine DM. Forage biomass yield (kg/ha), digestible energy (DE, Mcal/kg), crude protein (CP), acid detergent fiber (ADF), neutral detergent fiber (NDF), lignin, calcium (Ca), phosphorous (P), potassium (K), magnesium (Mg), ash, fat, water soluble carbohydrates (WSC), sugar and fructan were measured using a FOSS 6500 near-infrared spectrometer. Data were analyzed using paired T-tests and differences were determined to be significant at P < 0.05. Data are reported as means ± SEM as a percent of DM.
What have we learned?
Table 1. Nutrient content of continuously grazed (CG) pasture and rotationally grazed (RG) pasture. Data are summarized as means ± SE.
Nutrient
Continuous
Rotational
DM, %
91.72 ± 0.36
91.89 ± 0.34
DE, Mcal/kg
2.31 ± 0.064
2.42± 0.039*
CP, %
14.92 ± 0.77
15.79 ± 0.64
ADF, %
33.16 ± 1.21
30.81 ± 0.82*
NDF, %
56.80 ± 1.75
53.53 ± 1.65*
Lignin, %
3.47 ± 0.38
2.88 ± 0.32*
Ca, %
0.69 ± 0.11
0.68 ± 0.11
P, %
0.25 ± 0.009
0.27 ± 0.008*
K, %
1.92 ± 0.10
2.11 ± 0.087*
Mg, %
0.25 ± 0.009
0.26 ± 0.007
Ash, %
9.35 ± 0.83
9.39 ± 0.66
Fat, %
2.65 ± 0.12
2.83 ± 0.08
WSC, %
4.95 ± 0.60
6.72 ± 0.71*
Sugar, %
3.33 ± 0.50
4.86 ± 0.55*
Fructan, %
1.61 ± 0.15
1.59 ± 0.16
*means within rows differ; P < 0.05
Forage biomass yield did not differ between RG and CG (2,125 ± 52.2; 2,267 ± 72.4 kg/ha, respectively). The percentage of grass species was greater in RG compared to CG (81.7 ± 3.9; 73.9 ± 4.5, respectively) and the percentage of weed species was lower in RG compared to CG (3.4 ± 0.8; 12.0 ± 1.5, respectively). Tall fescue, kentucky bluegrass, bermudagrass and white clover were the dominant forage species. Rotational grazing increased forage quality compared to continuous grazing. The RG system was higher in DE (Mcal/kg), phosphorous (P), potassium (K), water soluble carbohydrates (WSC), and sugar compared to the CG system (Table 1). While there wasn’t a significant difference in crude protein (CP) content between RG and CG, the numerical difference could potentially affect animal performance. The RG pasture was lower in acid detergent fiber (ADF), neutral detergent fiber (NDF) and lignin compared to the CG pasture. Within the RG pasture, forage nutrient content declined following a grazing period, but recovered with rest. Paddocks were lower in DE, CP, P, K, Fat, WSC and sugar while they were higher in ADF and NDF after grazing compared to before grazing (Table 2).
Table 2. Nutrient content of rotational grazing (RG) paddocks before and after grazing. Data are summarized as means ± SE.
Nutrient
Before
After
DM, %
91.84 ± 0.27
91.84 ± 0.39
DE, Mcal/kg
2.34 ± 0.03
2.21 ± 0.02*
CP, %
14.98 ± 0.39
13.71 ± 0.43*
ADF, %
32.24 ± 0.54
34.33 ± 0.48*
NDF, %
55.97 ± 0.88
59.24 ± 0.89*
Lignin, %
2.79 ± 0.20
3.41 ± 0.25*
Ca, %
0.58 ± 0.05
0.59 ± 0.05
P, %
0.28 ± 0.004
0.25 ± 0.006*
K, %
2.11 ± 0.08
1.72 ± 0.07*
Mg, %
0.26 ± 0.007
0.26 ± 0.009
Ash, %
8.76 ± 0.19
8.79 ± 0.21
Fat, %
2.64 ± 0.05
2.45 ± 0.06*
WSC, %
6.05 ± 0.47
4.85 ± 0.39*
Sugar, %
4.40 ± 0.38
3.22 ± 0.30*
Fructan, %
1.67 ± 0.15
1.69 ± 0.16
*means within rows differ; P < 0.05
Future Plans
Rotational grazing may be a preferred alternative to continuous grazing as it favors grass production, suppresses weeds and increases energy and nutrient content of pastures. While rotational grazing may be beneficial from an environmental and animal production standpoint, an increase in DE and WSC may pose a risk for horses prone to obesity and metabolic dysfunction. Appropriate precautions should be taken in managing at risk horses under rotational grazing systems. This work is being continued at Virginia Tech and other universities to further understand the use of rotational grazing systems for horses.
Authors
Bridgett McIntosh, Equine Extension Specialist, Virginia Tech bmcintosh@vt.edu
Matt Webb, Ashton Daniel, David McIntosh and Joe David Plunk, University of Tennessee
The authors thank the University of Tennessee Middle Tennessee Research and Education Center and the Tennessee Department of Agriculture’s Nonpoint Source Pollution 319 Water Quality Grant for their support of this project.
The authors are solely responsible for the content of these proceedings. The technical information does not necessarily reflect the official position of the sponsoring agencies or institutions represented by planning committee members, and inclusion and distribution herein does not constitute an endorsement of views expressed by the same. Printed materials included herein are not refereed publications. Citations should appear as follows. EXAMPLE: Authors. 2015. Title of presentation. Waste to Worth: Spreading Science and Solutions. Seattle, WA. March 31-April 3, 2015. URL of this page. Accessed on: today’s date.
Escherichia coli transported in surface runoff from dissolution of applied poultry litter is a major variable in assessing fecal contamination of streams. However, the relative magnitude of the E. coli concentration from a specific poultry litter application and relative to the time lag between litter application and rainfall are not completely understood. This research investigated E. coli transport in runoff on fourteen 2 m × 2 m pastureland plots. Poultry litter was manually applied (4,942 kg ha‐1) in twelve plots followed by artificial rainfall with intensities equivalent to 2‐year and 5‐year storm events. Rainfall was applied in duplicate plots immediately after poultry litter application and 24 and 120 h after litter application. Experiments were also conducted on two control plots without poultry litter application. Surface runoff was collected using a flume installed in a trench. E. coli was quantified from sampled runoff and used as an indicator of fecal contamination by the most probable number (MPN) technique. Significant differences in the average event mean concentrations (EMCs) for the various treatments were determined using ANOVA. No significant differences were observed in average EMCs relative to storm intensity. Statistically significant differences were observed in average EMCs relative to time lag between litter application and rainfall (P < 0.05). A nonlinear relationship was observed between average E. coli EMC and time lag, with the EMC decreasing between 0 h (1.6 × 10⁵ MPN/100 mL) and 24 h (1.3 × 10⁴ MPN/100 mL) and then increasing at 120 h (4.3 × 10⁴ MPN/100 mL). E. coli were always detected in the control plots (average EMC of 6.8 × 10³ MPN/100 mL), indicating the presence and transport of fecal bacteria from sources independent of the immediate poultry litter application. Even though poultry litter application may increase E. coli concentrations in runoff, other sources of fecal contamination serve as a significant component of the total E. coli EMC, especially as the time lag between litter application and rainfall events increases.
Purpose
Poultry litter is recognized as an excellent source of the plant nutrients nitrogen, phosphorus and potassium. In addition, litter returns organic matter and other nutrients such as calcium, magnesium and sulphur to the soil, building soil fertility and quality.
Questions exist concerning E. coli contamination of waterways following manure land application events. Oklahoma State University researchers conducted a field study evaluating surface runoff transport of E. coli following poultry litter application to pastureland.
What did we do?
Pasture plots, which consisted of ryegrass, fescue grass, bermudagrass and some Johnsongrass, were established at the Eastern Oklahoma Research Station located in Haskell, OK. Cattle had not been allowed access to the pasture for over one year and poultry litter had previously been applied one year prior to the study. Broiler litter was applied to 14 plots at a rate of 2.2 tons/acre. Two control plots received no litter application.
An artificial rainfall simulator was used to produce 2 yr and 5 yr storm events. Rainfall was applied at 0 h, 24 h and 120 h after litter application. Surface runoff was collected using a flume installed in a trench (Figures 1 and 2). Water samples were tested for E. coli populations.
What have we learned?
Results of this study showed that E. coli event mean concentrations (EMC) in sampled runoff decreased at 24 h and 120 h when compared to 0 h after litter application (Table 1). However, a slight increase in populations was observed at 120 h as compared to 24 h. This slight growth may have been due to litter in contact with the soil surface and protected from ultraviolet light and moisture loss by vegetative cover.
In control plots, E. coli was always detected, indicating other sources of E.coli aside from poultry litter. Other sources may include rodents, birds, and other small mammals.
In conclusion, poultry litter applications may contribute to runoff of E. coli when rainfall events occur shortly after litter application. However, other sources of fecal contamination may serve as a significant component of the total E. coli EMC, especially as the time lag between litter application and rainfall event increases. The implications of this study may affect poultry litter application timing decisions based on predicted rainfall events.
Future Plans
Future studies using more advanced biological analysis techniques (i.e., DNA profiling) should be conducted to identify sources of background E. coli concentrations.
Authors
Josh Payne, Area Animal Waste Managment Specialist, Oklahoma State University joshua.payne@okstate.edu
Jorge Guzman, Senior Engineer, Waterborne Environmental; Garey Fox, Professor, Oklahoma State University
Additional information
Guzman, J. A., G. A. Fox and J. B. Payne, 2010. Surface runoff transport of Escherichia coli after poultry litter application on pastureland. Trans. ASABE. 53(3):779-886.
The authors are solely responsible for the content of these proceedings. The technical information does not necessarily reflect the official position of the sponsoring agencies or institutions represented by planning committee members, and inclusion and distribution herein does not constitute an endorsement of views expressed by the same. Printed materials included herein are not refereed publications. Citations should appear as follows. EXAMPLE: Authors. 2015. Title of presentation. Waste to Worth: Spreading Science and Solutions. Seattle, WA. March 31-April 3, 2015. URL of this page. Accessed on: today’s date.
Manage Cookie Consent
To provide the best experiences, we use technologies like cookies to store and/or access device information. Consenting to these technologies will allow us to process data such as browsing behavior or unique IDs on this site. Not consenting or withdrawing consent, may adversely affect certain features and functions.
Functional
Always active
The technical storage or access is strictly necessary for the legitimate purpose of enabling the use of a specific service explicitly requested by the subscriber or user, or for the sole purpose of carrying out the transmission of a communication over an electronic communications network.
Preferences
The technical storage or access is necessary for the legitimate purpose of storing preferences that are not requested by the subscriber or user.
Statistics
The technical storage or access that is used exclusively for statistical purposes.The technical storage or access that is used exclusively for anonymous statistical purposes. Without a subpoena, voluntary compliance on the part of your Internet Service Provider, or additional records from a third party, information stored or retrieved for this purpose alone cannot usually be used to identify you.
Marketing
The technical storage or access is required to create user profiles to send advertising, or to track the user on a website or across several websites for similar marketing purposes.

 Agriculture releases significant amounts of CO2, CH4 and N2O to the atmosphere. It is estimated that the agriculture sector contributes around 10-12% (~ 5-6 Gt CO2-equivelents yr-1 in 2005) of total global anthropogenic GHG emissions, which is about 50 and 60% of methane and nitrous oxide emissions, respectively. UGA made a commitment to reduce the GHG emissions. These emissions are currently calculated using a model called campus-carbon-calculator. However this model is limited in agricultural applications because it does not account for many management changes that might reduce GHG emissions. The purpos e of our project was to select or develop a model for estimating the GHG emissions from UGA farms. It was necessary for this model to account for crop production, dairy production and swine production and desirable for the model to have limited data requirements, be easy to use and allow for a variety of management options to reduce GHG emissions.
 What have we learned?

 gpm flow rate. Several hypothetical designs were made based on the available P sorbing materials (PSMs), such as drinking water treatment residuals, acid mine residuals, and gypsum. We chose to use a treated steel slag material as the PSM in the structure; this required about 35 tons of material.
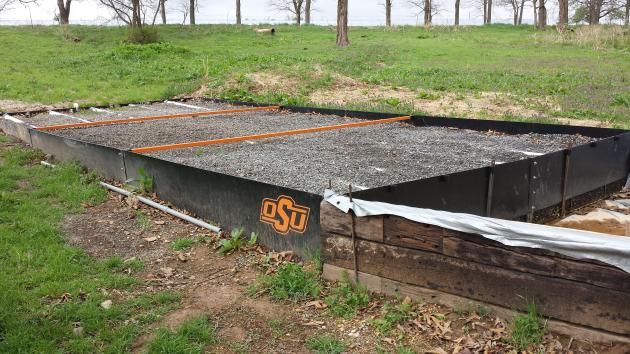 We constructed a P removal structure on a poultry farm in Eastern OK; this is a BMP that can remove dissolved P loading in the short term until soil legacy P concentrations decrease below levels of environmental concern. A P removal structure contains P sorbing materials (PSMs) and are placed in a location to intercept runoff or subsurface drainage with high dissolved P concentrations. As high P water flows through the PSMs, dissolved P is sorbed onto the materials by several potential mechanisms, allowing low P water to exit the structure. While they vary in form, P removal structures contain three main elements: 1) use of a filter material that has a high affinity for P, 2) containment of the material, and 3) the ability to remove that material and replace it after it becomes saturated with P and is no longer effective.
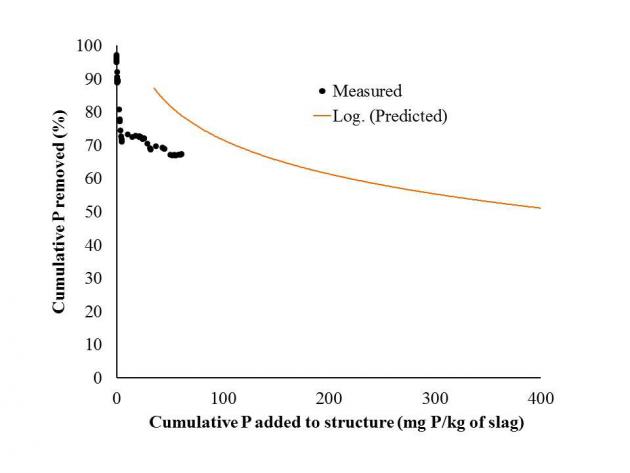 The P removal structure has removed approximately 67% of all dissolved P that has flowed into it over a 16-month time period. In addition, it has handled all flow volume from every event, including a runoff event that resulted in 600 gpm. That single event delivered 2/3 lb of dissolved P, in which the structure removed 66%. While the structure is removing P as predicted based on P loading, the structure has greatly outlasted the goal of removing 45% of cumulative dissolved P in one year. This is due to the below average rainfall received over the last two years.
 We will continue to monitor the structure. In addition, we are cooperating with several people throughout the US in helping to design P removal structures. We are also releasing design software for licensing in an attempt to promote commercialization of this BMP through private industry. A NRCS standard is currently underway and the goal is for this BMP to become cost-shared. Last, we are continuing to investigate the economics of P removal structure over a large scale area.
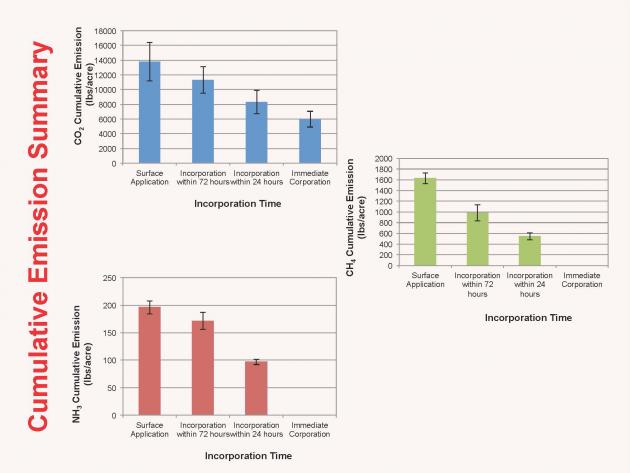
 Applying livestock manure from lagoon storage through center pivot irrigation has long been considered a low-labor, uniform method of application that can deliver nutrients in-season to a growing crop. Three challenges with this system have been odor, pivot nozzle clogging and loss of nitrogen. A new innovation in lagoon treatment addresses these challenges. Low-power circulators were installed at a Northeast Nebraska commercial hog finishing facility and used to aerate the lagoon by moving oxygen-rich water and beneficial microbes to the bottom of the lagoon, reducing odor and potent greenhouse gases while lowering disease pathogen risk. This process preserved nitrogen and made it 40-60% more available in the first year of application. Circulation also reduced lagoon solids and bottom sludge, resulting in reduced agitation and dredging expense. Having a continuously well-mixed lagoon facilitated accurate manure nutrient sampling and consistent nutrient concentration delivery to the irrigation system. Combined with the ease of calibration of the center pivots, precision uniform nutrient application was achieved. Center pivot application had several additional advantages over tractor-based systems: less soil compaction, optimal nutrient timing during plant growth, higher uniformity, lower labor and energy costs, and eliminating impact on public roads. The circulators combined with flush barns and center pivot irrigation creates a complete turn-key manure management system.
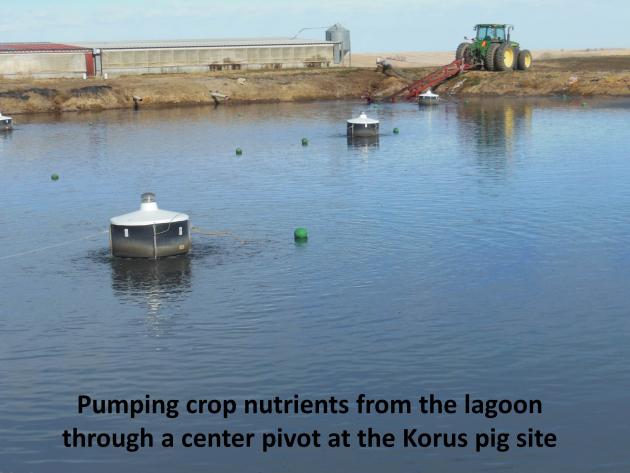 The purpose of the project was to evaluate the effectiveness of low powered circulators to treat livestock waste in lagoons. The objective was to evaluate how the addition of circulators to a livestock pond would change: 1. Odor levels, 2. Pivot nozzle clogging problems, and 3. Nitrogen loss.
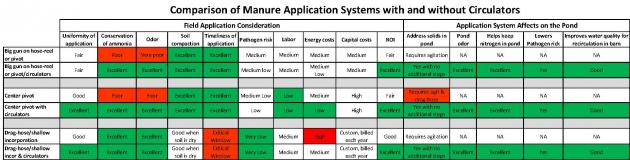
 What did we do?
