
The presentation provides an overview of the tool with a demo and discuss how it can be used by NRCS field staff and others in evaluating and tracking effectiveness of conservation practices in improving water quality over time and space. This presentation was originally broadcast on March 7, 2014. More… Continue reading “Water Quality Index for Agricultural Runoff Tool”
Thermal Conversion of Animal Manure to Biofuel
Continued advances in technology have facilitated new avenues to access and extract energy (in various forms) from materials such as animal manure and crop residues that have not traditionally been considered viable fuel sources. This presentation discusses the use of thermochemical processes, including gasification, to produce biofuels from animal manure and was originally broadcast on February 28, 2014. More… Continue reading “Thermal Conversion of Animal Manure to Biofuel”
Capturing Valuable Nutrients from Manure: Part 3
This webcast is the last in a series of 3 webcasts that provide information on: the need to capture nutrients for recycling off-farm, global phosphorus supplies, and technologies that are being used on-farm to capture nitrogen and phosphorus from manure. This presentation was originally broadcast on January 17, 2014. More… Continue reading “Capturing Valuable Nutrients from Manure: Part 3”
Capturing Valuable Nutrients from Manure: Part 2
This webcast is the second in a series of 3 webcasts that provide information on: the need to capture nutrients for recycling off-farm, global phosphorus supplies, and technologies that are being used on-farm to capture nitrogen and phosphorus from manure. This presentation was originally broadcast on December 13, 2013. More… Continue reading “Capturing Valuable Nutrients from Manure: Part 2”
Capturing Valuable Nutrients from Manure: Part 1
This webcast is the first in a series of 3 webcasts that will provide information on: the need to capture nutrients for recycling off-farm, global phosphorus supplies, and technologies that are being used on-farm to capture nitrogen and phosphorus from manure. This presentation was originally broadcast on November 15, 2013. More… Continue reading “Capturing Valuable Nutrients from Manure: Part 1”
Prediction of Bioavailability of Phosphorus for Dairy Cattle
This webcast includes presentations based on a project to enhance “Prediction of Bioavailability of Phosphorus for Dairy Cattle”. The project is an integrated approach to increase the adoption of “Precision Phosphorus Feeding” on dairy farms. This presentation was originally broadcast on September 20, 2013. More… Continue reading “Prediction of Bioavailability of Phosphorus for Dairy Cattle”
Results of Mono-Slope Beef Barn Air Quality Research – Archived Webcast
 Researchers and university specialists from South Dakota State University, USDA’s Meat Animal Research Center (USMARC), and Iowa State University Extension are wrapping up a four-year study looking at concentration and emission measurements in comparison with management techniques for mono-slope beef barns and will share the results of their study. This presentation was originally broadcast on July 19, 2013. More… Continue reading “Results of Mono-Slope Beef Barn Air Quality Research – Archived Webcast”
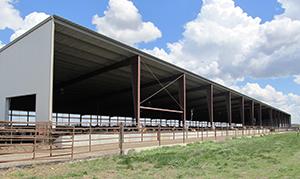
Mono-Slope Beef Barn Design and Management
 What is a mono-slope beef barn? It’s a newer style barn for cattle that is becoming increasingly popular in the upper Midwest.
This webinar allows you to discover what exactly is a mono-slope barn and why beef producers are building them. This presentation is part of a four-year mono-slope air quality research project and was originally broadcast on May 17, 2013. More… Continue reading “Mono-Slope Beef Barn Design and Management”
Designing Structures to Remove Phosphorus from Drainage Waters
Waste to Worth home | More proceedings….
Abstract
Several groups have developed P removal structures, which are units filled with P sorbing materials and designed to channel runoff water through them while retaining the filter material and P. The goal is to prevent P from entering a surface water body and allow filtered P to be removed from the watershed after the P-saturated material is removed. The P sorbing materials utilized are typically by-products from various industries and include steel slag, FGD gypsum, drinking water treatment residuals, and acid mine drainage residuals. A modeling tool has been developed for (1) sizing a structure based on filter media properties and watershed characteristics, (2) predicting the lifetime of a P removal structure, and (3) estimating total P removal. In addition to the modeling tool, data from full scale filters will be presented.
Why Are We Concerned About Phosphorus in Water?
Excessive phosphorus (P) in surface waters can result in algae growth, fish kills, eutrophication, and overall poor water quality. This problem is especially evident in the Illinois River Basin and Chesapeake Bay. Sources of P to aquatic ecosystems include wastewater treatment plants and also non-point runoff sources (agriculture, horticulture, urban/suburban landscapes).
Soils that have continuously received excess P beyond plant needs typically become “built up” to high levels of soil P. These soils release dissolved P during rainfall/runoff events. Current best management practices (BMPs) mostly address particulate P (i.e. P bound to soil particles) transport, not dissolved P. Dissolved P is more damaging than particulate P because it is immediately 100% available to aquatic life. Even if all P applications to high P soils are ceased and BMPs are implemented to reduce erosion (i.e. particulate P transport), dissolved P transport will continue to occur for at least 15 years, assuming that plants are harvested from the site. If plants are not harvested and removed from the site, then dissolved P concentrations may remain elevated in runoff for much longer.
Because soil P levels will remain high for many years, even if P applications cease and efforts are made to “mine” the soil P using plants, the system will continue to “leak” dissolved P during every runoff event. This has resulted in the need to develop a new BMP that can reduce the transport of dissolved P.
What Did We Do?
Through use of various industrial by-products, we constructed landscape “filters” that remove dissolved P in runoff from “hot spots” before it reaches streams and lakes. Many industrial by- products that are typically land-filled, including materials produced during drinking water treatment, power generation, and steel production have a beneficial re-use in improving surface water quality by adsorbing P from passing water.

Phosphorus removal structure located at Stillwater Country Club, which utilizes steel slag as the P sorbing material |
Several P removal structures were constructed in residential and agricultural watersheds. Industrial by-products such as flu gas desulfurization gypsum and steel slag were used as P sorbents in the filters. These filters can be placed in locations known to produce high dissolved P concentrations in runoff; the materials are contained within the structure, which allows them to be removed after they are no longer effective at filtering P (i.e. “saturated” with P). The materials can then be replaced with fresh materials. This represents a true removal of P from the system instead of simply tying up the P temporarily.
Automatic samplers and flow meters were used to monitor flow rates and collect samples for measurement of dissolved P and other parameters. Samples were collected throughout runoff events at both inlet (pre-treatment) and outlet (post-treatment) of structures. Based on flow volumes and measured P concentrations at the inlet and outlet of structures, P load and P load reductions were calculated.
In addition, approximately 16 different P sorbing materials were tested under flow-through conditions in the laboratory in order to quanitify P removal under different inflow P concentrations and retention times. With this data set, we have produced a user-friendly model to aid in construction of P removal structures, predict how much P they will remove, and how long they will last until the material is saturated with P.

Phosphorus box filters designed to treat runoff from a poultry farm located in Maryland |
What Have We Learned?
Over 8 months of monitoring at the Stillwater site, dissolved P concentrations varied from 0.3 to 1.5 mg L-1 for a residential watershed. The structure located at that site was able to remove 25% of all the dissolved P that entered the structure over a time period of 8 months. Other materials can adsorb much more P, but the hydraulic conductivity is much lower, therefore limiting the amount of water that can be treated. Depending on the material and conditions, P removal structures can pay for themselves if a P trading credit program is ever implemented for non-point source total maximum daily loading (TMDLs).
Future Plans
The computer program model will eventually be made available on the web for practitioners, especially the Natural Resources Conservation Service (NRCS), to aid in P removal structure design. We are also developing a new P sorbing material that will have greater P sorption capacity and a large hydraulic conductivity, enabling it to both remove P and treat large amounts of water. A large P removal structure is under construction on an eastern Oklahoma poultry farm, where it will capture and treat runoff from areas directly around the poultry houses.

Canister filters placed in a drainage ditchlocated in Maryland |
Authors
Chad Penn, Associate professor of soil and environmental chemistry, Oklahoma State University,
Josh Payne, Area animal waste management specialist, Oklahoma State University
Josh McGrath, Associate professor of soil fertility, University of Maryland
Jeff Vitale, Associate professor of agricultural economics, Oklahoma State University
Additional Information
Stoner, D., C.J. Penn, J.M. McGrath, and J.G. Warren. 2012. Phosphorus removal with by-products in a flow-through setting. J. Environ. Qual. 41:654-663.
Penn, C.J., J.M. McGrath, E. Rounds, G. Fox, and D. Heeren. 2012. Trapping phosphorus in runoff with a phosphorus removal structure. J. Environ. Qual. 41:672-679.
Grubb, K.L., J.M. McGrath, C.J. Penn, and R.B. Bryant. 2012. Effect of land application of phosphorus saturated gypsum on soil phosphorus. Applied and Environmental Soil Science. vol. 2012, Article ID 506951, 7 pages, 2012. doi:10.1155/2012/506951
Grubb, K.L., J.M. McGrath, C.J. Penn, and R.B. Bryant. 2011. Land application of spent gypsum from ditch filters: Phosphorus source or sink? Agricultural Sciences: 2:364-374.
Penn, C.J. and J.M. McGrath. 2011. Predicting phosphorus sorption onto normal and modified slag using a flow-through approach. J. Wat. Res. Protec. 3:235-244.
Penn, C.J., R.B. Bryant, M.A. Callahan, and J.M. McGrath. 2011. Use of industrial byproducts to sorb and retain phosphorus. Commun. Soil. Sci. Plant Anal. 42:633-644.
Penn, C.J., R.B. Bryant, P.A. Kleinman, and A. Allen. 2007. Removing dissolved phosphorus from drainage ditch water with phosphorus sorbing materials. J. Soil Water Cons. 62:269-276.
Penn, C.J., J.M. McGrath, and R.B. Bryant. 2010. Ditch drainage management for water quality improvement. In “Agricultural drainage ditches: mitigation wetlands for the 21rst century”. Ed. M.T. Moore. 151-173.
Acknowledgements
The authors are grateful to the NRCS, the National Slag Association, The United States Golf Association, and the USDA-ARS for their support of this work.
The authors are solely responsible for the content of these proceedings. The technical information does not necessarily reflect the official position of the sponsoring agencies or institutions represented by planning committee members, and inclusion and distribution herein does not constitute an endorsement of views expressed by the same. Printed materials included herein are not refereed publications. Citations should appear as follows. EXAMPLE: Authors. 2013. Title of presentation. Waste to Worth: Spreading Science and Solutions. Denver, CO. April 1-5, 2013. URL of this page. Accessed on: today’s date.
Minnesota Watershed Nitrogen Reduction Planning Tool
Abstract
Using the nitrogen reduction planning model involves three steps. The first step is to select a watershed, enter hypothetical adoption rates for each BMP, and compare the effectiveness and cost of the individual BMPs. The second step is to compare suites of the BMPs that would attain any given reduction in the N load at minimum cost. The third step is to “drill down” to the details and assumptions behind the models of effectiveness and costs of any particular BMP and make any adjustments to reflect your particular situation.
Why Develop a Nitrogen Reduction Planning Tool?
A watershed-level nitrogen reduction planning tool (Excel spreadsheet) compares the effectiveness and cost of nine different “best management practices” (BMPs), alone and in combination, for reducing N loads leaving a Minnesota watershed. The Minnesota Pollution Control Agency is developing a new set of standards for nitrate nitrogen in surface waters based on aquatic life toxicity. The tool was developed to assist the agency and local resource managers to better understand the feasibility and cost of various “best management practices” to reduce N loading from Minnesota cropland.
What Did We Do?
The BMPs are: reducing corn N fertilizer rates to extension recommended rates, changing fertilizer application timing, seeding cover crops, installing tile line bioreactors or controlled drainage, planting riparian buffers, or converting some corn and soybean acres to a perennial crop. The spreadsheet does its analysis for a watershed that the user selects. However, the N loadings and crop economic calculations are done first by agroecoregion before aggregating the results into the watershed of interest. Agroecoregions are units having relatively homogeneous climate, soil and landscapes, and land use/land cover. The spreadsheet includes area data for the fifteen high-N HUC8 watersheds that make up roughly the southern half of the state, along with the state as a whole. When the user selects a watershed for analysis, formulas retrieve results as an area-weighted average of the agroecoregions making up that watershed. Each of the fifteen HUC8 watersheds includes between four and nine agroecoregions.
The N loadings from each agroecoregion are calculated in three categories: drainage tile discharges, leaching from cropland, and runoff. Nitrogen loading amounts modeled are “edge-of-field” measures that do not account for denitrification losses that occur beyond the edge of field as groundwater travels towards and is discharged to streams. The BMPs consider only loading from cropland, but loading from forests and impervious urban and suburban land is also included in the totals.
What Have We Learned?
The EPA’s Science Advisory Board has said that a 45% reduction in both N and P is needed in the Mississippi River to reduce the size of the Gulf of Mexico hypoxic zone. This tool suggests that the BMPs considered are not likely to achieve much more than half that reduction even at high adoption rates. Reducing N fertilizer rates on corn down to extension-recommended levels and shifting from fall to spring or sidedressed applications tend to be among the cheaper BMPs to adopt, but the results vary across watersheds and weather scenarios. Various other factors such as crop and fertilizer prices also affect the results, hence the need for a computer tool.
Future Plans
The tool and results of a larger project will be reviewed during the first half of 2013. The tool may then play a role in implementation of the new N state standards in the state.
Authors
William F. Lazarus, Professor and Extension Economist, University of Minnesota wlazarus@umn.edu
Geoff Kramer, Research Fellow, Department of Biosystems and Bioproducts Engineering, University of Minnesota
David J. Mulla, Professor, Department of Soil, Water, and Climate, University of Minnesota
David Wall, Senior Hydrologist, Watershed Division, Minnesota Pollution Control Agency
Additional Information
The latest version of the tool and an overview paper are available at the author’s project page.
Davenport, M. A., and B. Olson. “Nitrogen Use and Determinants of Best Management Practices: A Study of Rush River and Elm Creek Agricultural Producers Final Report, submitted to the Minnesota Pollution Control Agency as part of a comprehensive report on nitrogen in Minnesota Surface Waters.” Department of Forest Resources, University of Minnesota, St. Paul, Minnesota, September 2012.
Fabrizzi, K., and D. Mulla. “Effectiveness of Best Management Practices for Reductions in Nitrate Losses to Surface Waters In Midwestern U.S. Agriculture. Report submitted to the Minnesota Pollution Control Agency as part of a comprehensive report on nitrogen in Minnesota Surface Waters.” September 2012.
Lazarus, W. F., et al. “Watershed Nitrogen Reduction Planning Tool (NBMP.xlsm) for Comparing the Economics of Practices to Reduce Watershed Nitrogen Loads.” December 11, 2012, http://wlazarus.cfans.umn.edu/.
Mulla, D. J., et al. “Nonpoint Source Nitrogen Loading, Sources and Pathways for Minnesota Surface Waters. Report submitted to the Minnesota Pollution Control Agency as part of a comprehensive report on nitrogen in Minnesota Surface Waters.” Department of Soil, Water & Climate, University of Minnesota, September 2012.
Acknowledgements
Partial support for this project was provided by the Minnesota Legislature.
The authors are solely responsible for the content of these proceedings. The technical information does not necessarily reflect the official position of the sponsoring agencies or institutions represented by planning committee members, and inclusion and distribution herein does not constitute an endorsement of views expressed by the same. Printed materials included herein are not refereed publications. Citations should appear as follows. EXAMPLE: Authors. 2013. Title of presentation. Waste to Worth: Spreading Science and Solutions. Denver, CO. April 1-5, 2013. URL of this page. Accessed on: today’s date.