The MAnure PHosphorus EXtraction (MAPHEX) System for Removing Phosphorus, Odor, Microbes, and Alkalinity from Dairy and Swine Manures

Abstract

Animal manures contain nutrients [primarily nitrogen (N) and phosphorus (P)] and organic material that are beneficial to crops. Unfortunately, for economic and logistics reasons, liquid dairy and swine manure tends to be applied to soils near where it is generated. Over time, P concentrations in soils where dairy manure is applied builds up, often in excess of crop demands. We previously (Church et al., 2016, 2017) and have subsequently built, a full-scale version of a MAnure PHosphorus EXtraction (MAPHEX) System capable of removing greater than 90 percent of the P from manures. While originally designed to remove phosphorus, we have also shown that the MAPHEX System was also capable of removing odor and microbes, and of concentrating alkalinity into a solid, economically transported form. We have also lowered daily operating costs by testing the effect of lower-cost chemicals as alternatives to ferric sulfate, and by showing that the diatomaceous earth (DE) filtering material can be recycled and reused. We are currently building a system capable of treating over 100,000 gallons of Dairy Manure per day. This system is planned to be operational for demonstrating starting summer 2022.

Purpose

Swine and dairy manures are typically in slurry form and contain nutrients [primarily nitrogen (N) and phosphorus (P)] and organic material that are beneficial to crops. Unfortunately, the concentrations of nutrients in both manures are too low to make transportation of bulk manures over large distances economically viable. Furthermore, since it must be transported in tanks, that transportation is inconvenient as well. Therefore, these manures tend to be applied to soils near where they are generated, and, over time, P concentrations in soils increase to the point that soil P concentrations are often in excess of crop demands. Furthermore, because of the implication that P runoff from agricultural operations plays an important role in eutrophication of streams and other water bodies, farmers are experiencing increasing pressures and regulation to not apply animal manures to those soils.

We previously reported on an invention that 1) is designed to be a solution to the P overloading that happens when unnecessary P is added to agricultural soils, 2) is scalable such that it can be used as a mobile system, and 3) has shown to be capable of removing greater than 90 percent of the P from a wide range of dairy manures, while retaining greater than 90% of the N in the final effluent for beneficial use by the farmer.

What Did We Do?

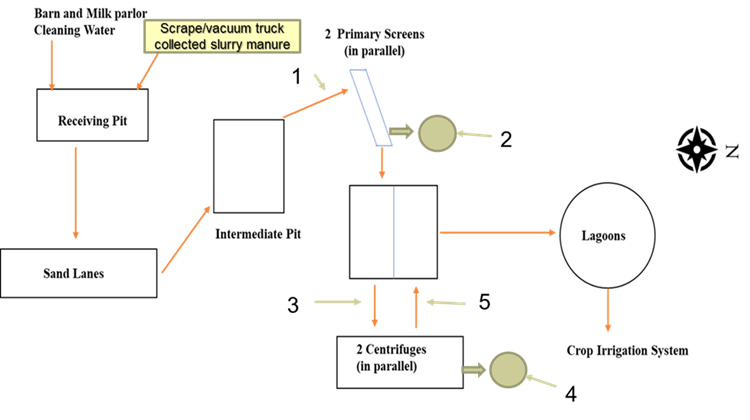
We subsequently built a full-scale version of a MAnure PHosphorus EXtraction (MAPHEX) System capable of removing greater than 90 percent of the P from manures and have tested it on dairy manures. We also focused our efforts on lowering the daily operating costs of the system by developing a method to recover and reuse the diatomaceous earth used in the final filtration step, and testing alternative, lower cost chemicals that can be used in the chemical treatment step. We also performed pilot-scale tests on swine manures.

What Have We Learned?

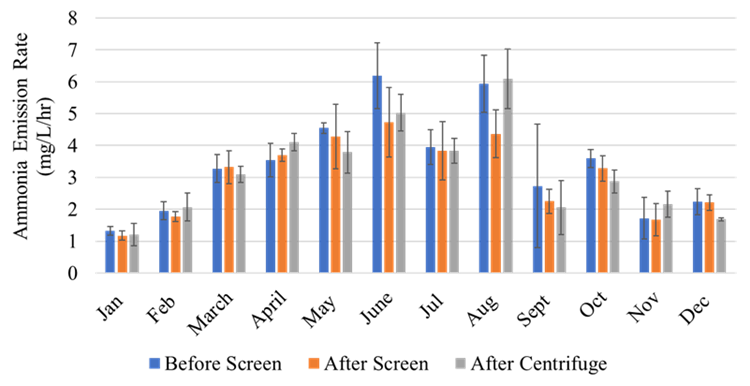
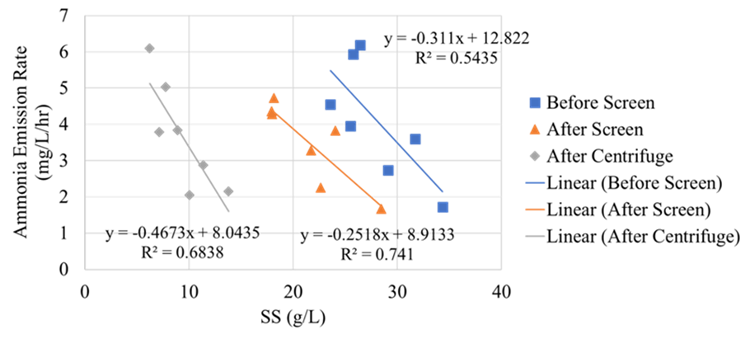
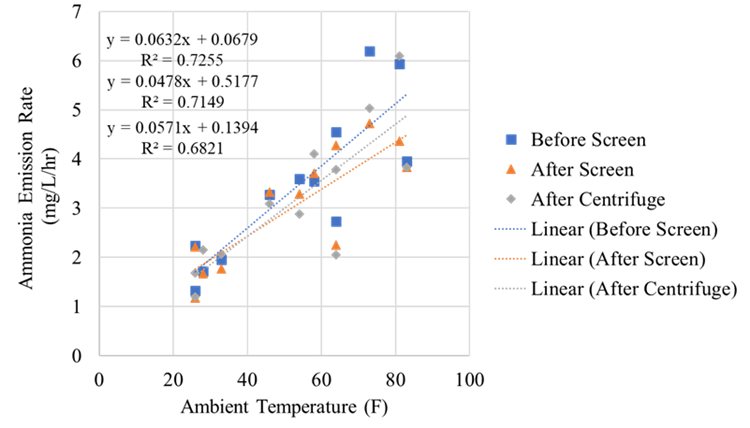
The full-scale MAPHEX System removed greater than 90% of P from a wide variety of dairy manures, while leaving greater than 90% of the N in the final effluent to be used beneficially to fertigate crops. The System was also shown to recover and concentrate alkalinity into a solid form on a farm that used greater amounts of lime during manure handling, remove 50% of the odor from dairy manure and to remove greater than 80% of Total coliforms and E. Coli. Furthermore, the System has not shown to alter the pH of the final effluent respective to raw manures as other treatment technologies can. We have lowered daily operating costs by testing the effect of lower-cost chemicals as alternatives to ferric sulfate, and by showing that the diatomaceous earth (DE) filtering material can be recycled and reused.

In pilot-scale swine testing, we found that the MAPHEX System can remove greater than 96% of the phosphorus in swine manures. This essentially P free effluent can be beneficially used for fertigation without further loading the receiving soils with P. Scaling up the pilot-scale testing has the potential to reduce swine manure storage volumes to allow for mitigation of overflow problems during large storms. Furthermore, the pilot-scale study suggests that capital equipment costs and treatment costs for swine manure would be lower than for treating dairy manure.

Future Plans

We are currently building a simplified version of the MAPHEX System that will be capable of treating over 100,000 gallons of dairy manure per day. This system is planned to be operational for demonstrating starting summer 2022. We plan to use this simplified version for demonstration tests, and use the results obtained to model the effects of using MAPHEX technology compared to conventional manure handling practices on two paired watersheds. We also plan to demonstrate the full-scale system on a wide range of swine manures with on-farm testing.

Author

Clinton D. Church, Research Chemist, USDA-ARS University Park, PA

Corresponding author email address

Cdchurch.h2o@netzero.com

Additional Information

Church, C. D., Hristov, A. N., Bryant, R. B., Kleinman, P. J. A., & Fishel, S. K. (2016). A novel treatment system to remove phosphorus from liquid manure. Applied Engineering in Agriculture, 32: 103 – 112. doi:10.13031/aea.32.10999

Church, C. D., Hristov, A. N., Bryant, R. B., & Kleinman, P. J. A. (2017). Processes and treatment systems for treating high phosphorus containing fluids. US Patent 9,790.110B2.

Church, C. D., Hristov, A. N., Kleinman, P. J. A., Fishel, S. K., Reiner, M. R., & Bryant, R. B. (2018). Versatility of the MAPHEX System in removing phosphorus, odor, microbes, and alkalinity from dairy manures: A four-farm case study. Applied Engineering in Agriculture, 34: 567 – 572. doi:10.13031/aea12632

Church, C. D., Hristov, A., Bryant, R. B., & Kleinman, P. J. A. (2019). Methods for Rejuvenation and Recovery of Filtration Media. USDA Docket Number 129.17. U.S. Patent Application Serial No. 62/548,23

Church, C. D., S. K. Fishel, M. R. Reiner, P. J. A. Kleinman, A. N. Hristov, and R. B. Bryant. 2020. Pilot scale investigation of phosphorus removal from swine manure by the MAnure PHosphorus Extraction (MAPHEX) System. Applied Engineering in Agriculture 36(4): 525–531. doi: 10.13031/aea13698

https://www.ars.usda.gov/people-locations/person/?person-id=40912

https://tellus.ars.usda.gov/stories/articles/mining-manure-for-phosphorus/

https://agresearchmag.ars.usda.gov/2016/dec/phosphorus/

https://jofnm.com/article-112-Packaging-phosphorus-for-the-future.html

https://lpelc.org/versatility-of-the-manure-phosphorus-extraction-maphex-system-in-removing-phosphorus-odor-microbes-and-alkalinity-from-dairy-manures/


The authors are solely responsible for the content of these proceedings. The technical information does not necessarily reflect the official position of the sponsoring agencies or institutions represented by planning committee members, and inclusion and distribution herein does not constitute an endorsement of views expressed by the same. Printed materials included herein are not refereed publications. Citations should appear as follows. EXAMPLE: Authors. 2022. Title of presentation. Waste to Worth. Oregon, OH. April 18-22, 2022. URL of this page. Accessed on: today’s date.

Demonstrated Maximization of Nutrient Recovery from Swine Manure

Purpose

Previous evaluations of the technologies investigated were conducted in a batch mode of testing. This program was conducted to demonstrate the viability of the technologies investigated to significantly reduce phosphorus when operated in a continuous mode, pulling manure directly from a deep pit swine operation without agitating the pit. Additionally, this demonstration also explored the ability of several dewatering technologies to produce a stackable product containing the high phosphorus recovered in the form of amorphous calcium phosphate. Considerable data on this final product was collected from multiple off-site takers expressing interest in the final product. Figure 1 is a picture of the pilot setup.

Figure 1: Pilot Setup

What Did We Do?

Mobile test units were employed at a swine operation representative of a typical operation in Mercer County, OH. Manure was directly pulled from the deep pit at the host farm, and after initial dewatering, it was treated under conditions consistent with a detailed program conducted under sponsorship from Ohio Farm Bureau in summer 2019. Treated manure was then sent to multiple dewatering options including passive dewatering (geotextile bags) and mechanical separation. The demonstration program ran for six months and a total of 110,000 gallons of manure was treated continuously with multiple samples collected for analysis at third-party certified labs.

Twenty cubic yards of the initial manure solids were collected for use by a Cleveland off-site taker to investigate its viability as a composting foundational ingredient, while several different off-site takers were sent samples of the final dewatered material containing the recovered phosphorus. An additional three tons of stackable final product were sent to several off-site takers in Allen County, IN for use and evaluation, an additional 20 cubic yards of the geobag containing product were sent to a local farmer for application in a 40 acre wheat field and the remainder of the material (both manure solids and geobag material) were land applied by the host farm.

Figure 2 is a picture of the dewatered manure solids collected.

Figure 2: Dewatered manure solids

Figure 3 is a picture of the recovered phosphorus product.

Figure 3: Recovered phosphorus product

What Have We Learned?

We were able to confirm that the technologies demonstrated performed as expected when operating in a continuous mode. An average initial dewatered manure cake of 20.8% solids was obtained without the use of polymers and a consistent stackable product of 24.4% was obtained with the mechanical dewatering equipment used. An average of 96.1% recovery of total phosphorus was obtained during the pilot. This value compares to the average total phosphorus reduction of 95.5% measured at the batch mode operation in summer 2019. Limitations of the equipment used limited operation to approximately 7gpm but with properly sized pumps, this could be increased.

The operating cost of treatment averaged out to $0.0063/gallon (measured at $0.0064 in summer 2019). To dewater the product to stackable form varied depending on the equipment used, but costs of close to $0.01/gallon have been estimated. For the application demonstrated, the use of a geobag for final dewatering was not considered a viable option due to high costs (approximately $0.15/gallon treated) and the space required.

Future Plans

The Maumee Valley Authority was awarded an USDA Conservation Grant in partnership with Allen / Adams County of Indiana and Applied Environmental Solutions to further demonstrate continuous flow operation over an extended duration at a deep pit swine, dairy and mixed manure lagoon operation. A major focus of this effort will be in establishing the value and path to market for co-product streams produced. Additionally, efforts are underway to design and build a portable unit capable of treating 500,000 gpd of manure over a 3-5 day period. This would allow for treatment at smaller farms without the need for capital outlay by the individual farms. One purchaser of this design has already been identified for delivery in 2023.

In addition to the above, initial testing of a companion technology for the recovery of ammonia is also under investigation. Ammonia can be recovered in any number of ammonium salts (such as ammonium sulfate) and represents another opportunity to maximize the resource recovery from agricultural streams.

Authors

Presenting author

Rick Johnson, Director of Commercial Development, Applied Environmental Solutions

Corresponding author

Theresa Dirksen, Agriculture & Natural Resources Director, Mercer County (OH)

Corresponding author email address

theresa.dirksen@mercercountyohio.org

Acknowledgements

    • Ohio Water Development Authority
    • Mercer County Board of Commissioners
    • Ivo & Linda Post, Host Farm

The authors are solely responsible for the content of these proceedings. The technical information does not necessarily reflect the official position of the sponsoring agencies or institutions represented by planning committee members, and inclusion and distribution herein does not constitute an endorsement of views expressed by the same. Printed materials included herein are not refereed publications. Citations should appear as follows. EXAMPLE: Authors. 2022. Title of presentation. Waste to Worth. Oregon, OH. April 18-22, 2022. URL of this page. Accessed on: today’s date.

Electrochemical K-struvite formation for simultaneous phosphorus and potassium recovery from hog and dairy manures

Purpose

Intensive animal husbandry produces large  volumes of liquid manure with significant amounts of phosphorus, ammonium, and potassium as they pass through the feed of farm animals. As a result, direct land application of manure, the current common approach, causes environmental concerns such as soil over-fertilization and groundwater and surface water contamination, which leads to eutrophication. Manure nutrient management is, therefore, necessary to address these problems. While most engineering options are focused on phosphorus and ammonium recovery, few studies have pursued recovery methods for potassium. In this talk, we present an electrochemical technology using a sacrificial magnesium anode and a stainless-steel cathode for simultaneous recovery of phosphorus and potassium in the form of potassium-magnesium-phosphate (KMgPO4·xH2O, K-struvite).

Mg2+ + K+ + HnPO4n-3 + 6H2O = KMgPO4*6H2O + nH+

K-struvite has the potential to be used as a slow-release fertilizer and this technology will add flexibility to the  manure management strategies currently available by diversifying the recoverable by-products.

What Did We Do?

Figure 1. Calculated saturation index values as a function of pH. The water matrix contains 3000 mg/L potassium, 1000 mg/L phosphate, and magnesium with Mg:P ratio of 1.4.

To predict the thermodynamic stability of K-struvite, a thermodynamic model was developed based on the average ion concentrations of phosphorus, and potassium measured in real liquid pig manure (Figure 1). According to this model, magnesium phosphate is a possible by-product of K-struvite precipitation. Also, the probable formation of magnesium hydroxide was enhanced with increasing pH value due to the increase in hydroxide ion concentration. As a result, the ideal range for precipitation of K-struvite lies at pH values between 10 and 11.

To understand the role of pH on K-struvite formation, a 50 mM KH2PO4 solution was used to perform the preliminary batch electrochemical experiments. A constant voltage of -0.8 V vs. the Ag/AgCl reference electrode was applied to the pure magnesium anode using a potentiostat. One experiment was performed on the natural pH of the initial solution, 4.5, while potassium hydroxide was used to raise the initial pH of the second experiment to 9.5.

What Have We Learned?

Figure 2. The EDS results obtained of the recovered precipitates (a) pH=4.5, (b) pH=9.5 in 50 mM KH2PO4.

Energy-dispersive x-ray spectroscopy (EDS) of the recovered precipitates (Figure 2) indicate that by raising the initial pH from 4.5 to 9.5 the amount of potassium is increased in the precipitates. Also, due to the equimolar ratios of K:Mg:P at pH=9.5, the produced precipitates are likely K-struvite, while the pH= 4.5 sample likely contains some amount of magnesium phosphate.

This process also eliminates the disadvantages of the commonly used chemical precipitation methods, including magnesium salt dosing, and adding base to the system for pH control, due to in situ magnesium corrosion and hydroxide production at the magnesium anode surface. These advantages could potentially reduce the operating cost of the system and eliminate the addition of unnecessary salinity to wastewater through magnesium salt dosing.

Future Plans

Further investigation by using multiple characterization techniques (e.g., x-ray diffraction (XRD) and Fourier transform infrared spectroscopy (FT-IR)) is necessary to identify the exact nature of precipitates. The initial experiments will be repeated at additional pH values to further understand the role of pH on the precipitation of K-struvite in the simplified synthetic wastewater and to further detail the characterization of the composition and morphology of K-struvite precipitates. These experiments are valuable , particularly because there are few literature reports that detail the physical and chemical structure of K-struvite.

Authors

Presenting author

Amir Akbari, Ph.D. Candidate, Department of Chemical and Biomedical Engineering, Pennsylvania State University

Corresponding author

Lauren F. Greenlee, Associate Professor, Department of Chemical and Biomedical Engineering, Pennsylvania State University

Corresponding author email address

greenlee@psu.edu


Additional Information

Once completed, future publications and data repository information will be available at https://sites.psu.edu/greenlee/

Acknowledgements

The authors would like to thank the U.S. Department of Agriculture, NIFA AFRI Water for Food Production Systems (#2018-68011-28691) for providing the funding support of this research through the “Water and Nutrient Recycling: A Decision Tool and Synergistic Innovative Technology” project.


The authors are solely responsible for the content of these proceedings. The technical information does not necessarily reflect the official position of the sponsoring agencies or institutions represented by planning committee members, and inclusion and distribution herein does not constitute an endorsement of views expressed by the same. Printed materials included herein are not refereed publications. Citations should appear as follows. EXAMPLE: Authors. 2022. Title of presentation. Waste to Worth. Oregon, OH. April 18-22, 2022. URL of this page. Accessed on: today’s date.

Electrocatalytic reduction of nitrate on hydrophobic, negatively, and positively charged peptide-coated gold electrodes

Purpose

As a pollutant in water resources, nitrate is a target contaminant for removal by water treatment technologies. Therefore, it is necessary to develop new techniques of water treatment to remove nitrate from water resources. This study worked on developing a new technique for nitrate reduction and to produce valuable ()/harmless () products without employing energy-intensive processes. To reach this goal, it is necessary to understand the possibilities and the pathways of nitrate reduction by negatively and positively charged, and hydrophobic peptide-coated Au electrodes. Also, stability and kinetics analysis will help us to understand the durability and capability of peptide-coated Au electrodes for nitrate reduction.

What Did We Do?

In this study three different types of peptides including, hydrophobic (V type), negatively charged (E type), and positively charged (K type) peptides were synthesized. The synthesized peptides were coated on the surface of bare Au. To assess the response of peptide- coated Au electrodes, and to compare them with bare Au, cyclic voltammetry (CV) experiments were employed. To do the CVs, an electrochemical cell with the gold electrode (working electrode), platinum (counter electrode) electrode, and a background solution (0.5 M) were used for electrochemical experiments. As a source of nitrate, 0.1 M sodium nitrate was added to the background solution. Cyclic voltammetry trials were done on three different peptide-coated Au electrodes and bare Au electrode, with a scan rate of 20 mV/s. After CV analysis, and to analyze the products of nitrate reduction, potential hold experiments were done on peptides with promising responses to the CV experiments. In other words, a potential hold experiment with a potential equal to the onset potential of peptide-coated Au electrodes were employed for 1 hour. During the potential hold trials, samples  were analyzed using Ultraviolet–visible spectroscopy method in time intervals (e.g., every 10 minutes) to measure the concentration of ammonia and nitrite.

What Have We Learned?

Based on the preliminary results, Au electrodes coated by E and V peptides showed promising responses to the applied potential. Results indicate that reduction of nitrate takes place at the onset potentials of -0.35V and -0.23V versus reversible hydrogen electrode (RHE) for E and V types of peptide-coated Au electrodes, respectively. However, bare Au did not show a reduction peak in the voltammogram. Results of potential hold experiment and product analysis indicate that V and E peptide-coated Au electrodes are capable of nitrate reduction to both nitrite and ammonia. However, bare Au electrode can only reduce nitrate to ammonia.

Future Plans

To have a comprehensive analysis of products, gas chromatography will be used to measure the products (e.g., hydrogen and nitrogen) in gaseous phase. Also, to investigate the structure and stability of thiolate– gold bonding on the surface of Au electrodes, Fourier transform infrared (FTIR) method will be employed before CV, and potential hold experiments. A mass balance between products and nitrate available in the background solution will be done. Moreover, the rate and kinetics of nitrate reduction will be assessed using the product analysis data.

Authors

Presenting author

Arash Emdadi, Ph.D. student, Pennsylvania State University

Corresponding author

Lauren F. Greenlee, Associated Professor, Pennsylvania State University

Corresponding author email address

greenlee@psu.edu

Additional authors

Julie Renner, Assistant Professor, Case Western Reserve University; Amir Akbari, Ph.D. student, Pennsylvania State University

Additional Information

    1. Matteo Duca, Marc T. M. Koper, Powering denitrification: the perspectives of electrocatalytic nitrate reduction, Energy Environ. Sci., 2012, 5, 9726-9742. https://doi.org/10.1039/C2EE23062C
    2. Phebe H. van Langevelde, Ioannis Katsounaros, Marc T. M. Koper, Electrocatalytic Nitrate Reduction for Sustainable Ammonia Production, Joule, 2021, 5, 290–294. https://doi.org/10.1016/j.joule.2020.12.025

Acknowledgements

The authors acknowledge funding from the USDA NIFA AFRI Water for Food Production Systems program, grant #2018-68011-28691.


The authors are solely responsible for the content of these proceedings. The technical information does not necessarily reflect the official position of the sponsoring agencies or institutions represented by planning committee members, and inclusion and distribution herein does not constitute an endorsement of views expressed by the same. Printed materials included herein are not refereed publications. Citations should appear as follows. EXAMPLE: Authors. 2022. Title of presentation. Waste to Worth. Oregon, OH. April 18-22, 2022. URL of this page. Accessed on: today’s date.

Active participation in livestock and poultry sustainability initiatives

Purpose

Whether at the farm, integrator or industry level, sustainability programs have unique goals, metrics and approaches. In many cases, there is no definitive path for meeting long-term goals, but in the ambiguity is opportunity. Meeting sustainability goals will take a community of persons on and off farm willing to support measurements, communication and technology development. This session builds on the Livestock and Poultry Environmental Learning Community’s (LPELC) September 2021 Webinar, Industry Initiatives for Environmental Sustainability – a Role for Everyone.

This Waste to Worth workshop features small and large group discussions to identify modes for active participation in livestock and poultry sustainability initiatives.

What Did We Do?

Industry-led sustainability programs are in various stages of charting a destination for environmental metrics, like greenhouse gas emissions, water quality, water use, etc. However, with respect for the range of individual farm resources, climates and systems, there is no prescriptive path.

As farmers and organizations chart their own sustainability journey, there is a need for on-farm baseline metrics, goal setting, and technology guidance. LPELC’s mission is to provide on-demand access to “the nation’s best science-based resources that is responsive to priority and emerging environmental issues associated with animal agriculture” (LPELC.org). The LPELC is in a strong position to share science and support communication efforts. However, like sustainability journeys, LPELC needs a roadmap.

This workshop will illuminate what resources are currently available, knowledge, technology and communication gaps, and how LPELC members can support on-farm sustainability initiatives. Participants will collectively shape a logic model for a “Community of Support for Producer Engagement in Livestock Industry Environmental Sustainability Initiatives”.

What Have We Learned?

A summary of the workshop results will be shared following the conference.

Future Plans

We intend the workshop results to foster stronger networks and collaborative directions for advancing on-farm sustainability initiatives. We aim for short, medium and long-term outcomes that include stronger understanding of current efforts within the livestock industries and LPELC, along with support mechanisms for decision making and funding opportunities.

Authors

Erin Cortus, Associate Professor and Extension Engineer, University of Minnesota

Corresponding author email address

ecortus@umn.edu

Additional authors

Marguerite Tan, Director of Environmental Programs, National Pork Board; Hema Prado, Director of Sustainability, American Egg Board; Michelle Rossman, Vice President – Environmental Stewardship, Dairy Management Inc.

Additional Information

Webinar – Industry Initiatives for Environmental Sustainability – a Role for Everyone https://lpelc.org/industry-initiatives-for-environmental-sustainability-a-role-for-everyone/#more-33017

US Pork Industry Sustainability Goals https://www.porkcares.org/pork-industry-sustainability-goals-and-metrics/

US Roundtable for Sustainable Poultry https://www.us-rspe.org/

US Dairy Net Zero Initiative https://www.usdairy.com/getmedia/89d4ec9b-0944-4c1d-90d2-15e85ec75622/game-changer-net-zero-initiative.pdf?ext=.pdf


The authors are solely responsible for the content of these proceedings. The technical information does not necessarily reflect the official position of the sponsoring agencies or institutions represented by planning committee members, and inclusion and distribution herein does not constitute an endorsement of views expressed by the same. Printed materials included herein are not refereed publications. Citations should appear as follows. EXAMPLE: Authors. 2022. Title of presentation. Waste to Worth. Oregon, OH. April 18-22, 2022. URL of this page. Accessed on: today’s date.

Impact of sampling timing on measured gas concentrations and emissions at a commercial laying hen house

Purpose

Ammonia and carbon dioxide are two major air pollutants at commercial laying hen houses. Ammonia models are widely used to estimate emissions from individual farms, a region, a country, or the world and assess their potential environmental and ecological impacts. Carbon dioxide models have been used to estimate ventilation rates based on mass balance. Reliable models must be developed based on measurement data from field conditions. However, concentrations and emissions of these two gases vary temporally in layer houses and can affect accuracies of measurement data and emission models. Accuracies of the measurement results are largely affected by instruments and methodologies, which includes sampling timing, i.e., number of samples per day (NSPD) and sampling starting time. The purpose of this study is to demonstrate the impact of measurement timing on ammonia and carbon dioxide concentrations and emissions.

What Did We Do?

A dataset of measured gas concentrations and emissions at a commercial laying hen farm was selected and used as a reference. It contains 5 days of continuous measurement data that were saved every minute. Different sampling timing scenarios were selected based on a literature survey and were applied in a computer simulation. Absolute differences in percentage between the simulation results and the reference were used to assess the effects of sampling timing.

Two sampling timing scenarios were used in this study: (a). sampling at eight different NSPD, i.e., 144, 48, 24, 12, 9, 3, 2, and 1 compared with the continues measurement of 1440 NSPD with equal sampling intervals and the first sampling starting at 8:00 AM; and (b). sampling for the same eight NSPD and equal sampling intervals, but with the first sampling starting at six different times within the respective sampling intervals, including 8:00 AM, compared with the data of 1440 NSPD. For example, when the NSPD was 2, the six starting times were selected at 8:00 AM, 10:00 AM, noon, 2:00 PM, 4:00 PM, and 6:00 PM.

What Have We Learned?

Results demonstrated that, for scenario (a) of the 5 days sampling and measurement (Figure 1), the absolute differences: 1. ranged from 0.02 % (carbon dioxide concentration at 144 NSPD) to 10.04% (Ammonia concentrations at 2 NSPD); 2. was 3.96% for ammonia emissions at 2 NSPD and 6.48% for carbon dioxide emissions at 1 NSPD, both were the largest emission differences; 3. were generally larger in ammonia concentrations than ammonia emissions, but smaller in carbon dioxide concentrations than carbon dioxide emissions; and 4. were generally larger with fewer NSPD for all the four measurement results (ammonia and carbon dioxide concentrations and emissions).

Figure 1. Comparison of average ammonia concentrations (top left), ammonia emission rates (bottom left), carbon dioxide concentrations (top right), and carbon dioxide emission rates (bottom right) with different number of samples per day, starting at 8:00 during a 5-day continuous measurement.

Scenario (b) simulation revealed a new finding that sampling starting times had large impacts on data accuracies as well (Figure 2). The absolute differences 1. ranged from 0.00 % (for both ammonia and carbon dioxide concentrations at 144 NSPD) to 12.92% (ammonia concentrations at 2 NSPD); and 2. was 7.43% for ammonia emissions at 1 NSPD and 7.60% for carbon dioxide emissions at 2 NSPD, both were the largest emission differences. Additionally, scenario (b) demonstrated the same effects as points 3 and 4 in scenario (a).

Figure 2. An example comparison of six different sampling starting times equally distributed within the sampling intervals of 2 hours, at 12 samples per day in the 5 days of sampling on average ammonia concentrations (top left), ammonia emission rates (bottom left) carbon dioxide concentrations (top right), and carbon dioxide emission rates (bottom right).

Future Plans

More research on the effects of sampling timing on gas concentration and emission measurements will be conducted using datasets of longer-term field measurement (> 1 year) with other sampling scenarios based on the literature survey.

Author

Ji-Qin Ni, Professor, Agricultural and Biological Engineering, Purdue University

Corresponding author email address

jiqin@purdue.edu

Additional Information

Wang-Li, L., Q.-F. Li, L. Chai, E. L. Cortus, K. Wang, I. Kilic, B. W. Bogan, J.-Q. Ni, and A. J. Heber. 2013. The National Air Emissions Monitoring Study’s southeast layer site: Part III. Ammonia concentrations and emissions. Transactions of the ASABE. 56(3): 1185-1197.

Ni, J.-Q., S. Liu, C. A. Diehl, T.-T. Lim, B. W. Bogan, L. Chen, L. Chai, K. Wang, and A. J. Heber. 2017. Emission factors and characteristics of ammonia, hydrogen sulfide, carbon dioxide, and particulate matter at two high-rise layer hen houses. Atmospheric Environment. 154: 260-273.

Tong, X., L. Zhao, R. B. Manuzon, M. J. Darr, R. M. Knight, A. J. Heber, and J.-Q. Ni. 2021. Ammonia concentrations and emissions at two commercial manure-belt layer houses with mixed tunnel and cross ventilation. Transactions of ASABE. 64(6): 2073-2087.

Acknowledgements

This work was supported by the USDA National Institute of Food and Agriculture Hatch project 7000907.


The authors are solely responsible for the content of these proceedings. The technical information does not necessarily reflect the official position of the sponsoring agencies or institutions represented by planning committee members, and inclusion and distribution herein does not constitute an endorsement of views expressed by the same. Printed materials included herein are not refereed publications. Citations should appear as follows. EXAMPLE: Authors. 2022. Title of presentation. Waste to Worth. Oregon, OH. April 18-22, 2022. URL of this page. Accessed on: today’s date.

Manure emissions during agitation and processing

Purpose

Recent deaths associated with hydrogen sulfide exposure from manure systems have highlighted the need for increased awareness to reduce health risks. While information on some aspects of hydrogen sulfide release from manure are available, there is limited information on the characteristics when agitating manure storages and in manure processing buildings that result in concentrations that are dangerous to human health. This project aimed to gather data on emissions from manure storages and processing to assess risks and develop mitigation strategies for these risks.

What Did We Do?

Our research team acquired over 20 days of field data (at multiple livestock farms) to assess the air concentrations from manure storages with and without agitation, for hydrogen sulfide, methane, ammonia, and particulate matter. The emissions were measured over the course of eight hours using numerous sets of sensors around the manure storage during agitation for each sampling event. Each sampling event had one backpack that was worn by a researcher with a set of sensors to represent the concentrations relevant to someone working in the area. Five additional sensor sets were placed around the manure storage. Some sensor sets remained in the same position throughout sampling (e.g., at the location of the agitation equipment controls) while others were moved around the storage.  Researchers also measured the concentrations of these gases inside a manure processing room to assess the concentration changes with different air exchange rates. During each event manure samples were collected as well as weather data to relate to the manure emissions data.

What Have We Learned?

This research assessed the environmental and design conditions of manure systems that may lead to increased concentrations of gases that have human health implications. The results indicate critical operating parameters on how to manage manure systems to limit risk from gases produced from manure processing and storage areas. More details on the study results will be available soon and will be presented at the conference.

Future Plans

This information is also being integrated into an existing fact sheet, https://learningstore.extension.wisc.edu/collections/manure/products/reducing-risks-from-manure-storage-agitation-gases-p1865, to provide an updated resource which integrates this new data. This information will be shared in a variety of settings to increase awareness and guide practices to reduce health risks to those working with livestock manure.

Authors

Rebecca A. Larson, Associate Professor & Extension Specialist, Biological Systems Engineering, University of Wisconsin-Madison

Corresponding author email address

rebecca.larson@wisc.edu

Additional author

Anurag Mandalika, Assistant Professor, Audobon Sugar Institute, LSU AgCenter

Additional Information

Reducing Risks from Manure Storage Agitation Gases

Acknowledgements

This work is supported by Foundational Program CARE 2019-68008-29829 from the USDA National Institute of Food and Agriculture.


The authors are solely responsible for the content of these proceedings. The technical information does not necessarily reflect the official position of the sponsoring agencies or institutions represented by planning committee members, and inclusion and distribution herein does not constitute an endorsement of views expressed by the same. Printed materials included herein are not refereed publications. Citations should appear as follows. EXAMPLE: Authors. 2022. Title of presentation. Waste to Worth. Oregon, OH. April 18-22, 2022. URL of this page. Accessed on: today’s date.

Effects of centrifuges and screens on solids/nutrient separation and ammonia emissions from liquid dairy manure

Purpose

Some Idaho dairies use liquid manure handling systems that result in large amounts of manure applied via irrigation systems to adjacent cropland during the growing season. Solids and nutrients presented in liquid dairy manure pose challenges to manure handling. Separating solids and nutrients from liquid dairy manure is a critical step to improve nutrient use efficiency and reduce manure handling costs. Most Idaho dairies have primary screens that separate coarse particles from their liquid streams. A few dairies have incorporated secondary solid separation technologies (centrifuge and secondary screen) into their manure handling systems to achieve higher solids and nutrient removal rates. Idaho dairymen want to know more information about solid and nutrient separation efficiencies by centrifuges and screens to make informed decisions on upgrading their solid/nutrient separation technologies. The objectives of this study were to evaluate centrifuges and screens in terms of removing solids and nutrients from liquid dairy manure and affecting ammonia emissions from the treated liquid dairy manure.

What Did We Do?

A year-long evaluation of on-farm centrifuges and screens on removing solids and nutrients and affecting ammonia emissions from centrifuge- and screen-separated liquid dairy manure was conducted. Triplicate fresh liquid dairy manure samples were collected monthly from before and after screens and centrifuges on a commercial dairy meanwhile triplicate screen- and centrifuge separated solids were collected from the same dairy. Figure 1 shows the dairy’s liquid manure flow diagram and locations where the liquid and solid manure samples were collected. The collected solids were analyzed for nitrogen (N), phosphorus (P), and potassium (K) concentrations by a certified commercial laboratory. The collected liquid samples were analyzed for total and suspended solids based on Methods 2540B and D (APHA, 2012) in the Waste Management Laboratory at the UI Twin Falls Research and Extension Center. Ammonia emissions from the monthly collected liquid dairy manure were evaluated using Ogawa ammonia passive samplers outside the Waste Management Lab for a year. Ammonia emission rate was calculated based on the duration and NH4-N concentrations from the Ogawa ammonia passive sampler tests. Ogawa passive ammonia sampler and Quickchem 8500 analysis system are shown in Figures 2 and 3.

Figure 1. Liquid manure flow diagram (liquid manure samples were collected at points 1 (before screens), 3 (after screens), and 5 (after centrifuges), solid samples were collected at points 2 (screen separated solids) and 4 (centrifuge separated solids).
Figure 2. Ogawa ammonia passive sampler.
Figure 3. Quickchem 8500 analysis system (Lachat Instruments, Milwaukee, WI).

What Have We Learned?

Centrifuge can further remove finer particles than cannot be removed by primary screens. Figure 4 shows both the screen- and centrifuge separated solids.

Figure 4. Centrifuge separated (left) and screen (right) separated solids.

Total nitrogen, phosphorus, and potassium in screen- and centrifuge separated solids are shown in Figures 5, 6, and 7. It was noticed that centrifuge separated solids had significantly (P<0.05) higher N, P, and K than that in screen separated solids. Yearlong averages of 9.2 lb/ton of total nitrogen, 8.0 lb/ton of P2O5, and 7.2 lb/ton of K2O were in the centrifuge separated solids while yearlong averages of 5.4 lb/ton of total nitrogen, 2.0 lb/ton of P2O5, and 4.4 lb/ton of K2O were in the screen separated solids.

Figure 5. Total nitrogen in screen separated and centrifuge separated solids.
Figure 6. Phosphorus in screen separated and centrifuge separated solids.
Figure 7. Potassium in screen separated and centrifuge separated solids.

Liquid dairy manure total solids and suspended solids are shown in Figures 8 and 9. Both the total solids and suspended solids in the liquid stream were significantly (P<0.05) reduced after the screen and centrifuge treatment.

Figure 8. Total solids in raw (before screens), after screens, and after centrifuges.
Figure 9. Suspended solids in raw (before the screens), after the screens, and after the centrifuges.

It was found that there was no significant difference (p≥0.05) between treatments for the ammonia emission rate in Figure 10 Which indicates that further treatment is needed to reduce ammonia emissions.

Figure 10. Ammonia emission rate during the test period.

In Figure 11 a correlation was determined between ammonia emission rate and suspended solids. As suspended solids were reduced within liquid dairy manure the ammonia emission rate increased among the treatments.

Figure 11. Ammonia emission rate vs. suspended solids.

In Figure 12 a correlation was determined between ammonia emission rate and ambient temperature. As the ambient temperature increased, so did the ammonia emission rate among the treatments.

Figure 12. Ammonia emission rate vs. suspended solids.

The test results showed:

    1. Centrifuge can further remove finer particles that can’t be removed by primary screens.
    2. Centrifuge separated solids contained higher N, P, and K contents, especially P (at an average of 8 lb/ton of P2O5 in centrifuge separated solids vs. 2 lb/ton of P2O5 in screen separated solids).
    3. Ammonia emissions from raw liquid manure, screen- and centrifuge separated liquid manure did not show significant differences.
    4. The most influential factors for ammonia emissions from liquid dairy manure were ambient temperatures and suspended solids within the liquid dairy manure.

Future Plans

We will hold workshops and field days to communicate the results with producers and promote on-farm adoption of advanced separation equipment such as centrifuge.

Authors

Lide Chen, Waste Management Engineer, Department of Soil and Water Systems, University of Idaho

Corresponding author email address

lchen@uidaho.edu

Additional author

Kevin Kruger, Scientific Aide, Department of Soil and Water Systems, University of Idaho.

Additional Information

APHA. (2012). Standard Methods for the Examination of Water and Wastewater. Washington D.C. : American Public Heath Association., Pp. 2-64 and Pp. 2-66

Acknowledgements

USDA NIFA WSARE financially supported this study. Thanks also go to Scientists at USDA ARS Kimberly Station for their help with analyzing ammonia emission samples.


The authors are solely responsible for the content of these proceedings. The technical information does not necessarily reflect the official position of the sponsoring agencies or institutions represented by planning committee members, and inclusion and distribution herein does not constitute an endorsement of views expressed by the same. Printed materials included herein are not refereed publications. Citations should appear as follows. EXAMPLE: Authors. 2022. Title of presentation. Waste to Worth. Oregon, OH. April 18-22, 2022. URL of this page. Accessed on: today’s date.

Does Irrigation of Liquid Animal Manure Increase Ammonia Loss?

Purpose

Large bore traveling gun and center pivot irrigation systems have been used to apply treated lagoon effluent, liquid animal manure, and untreated slurry from swine and dairy farms in many parts of the USA. The primary advantage of using irrigation equipment to spread manure on cropland are the lower costs for energy and labor, and the higher speed of application as compared to using a tractor-drawn spreader. The primary disadvantages are related to increases in odor release and the possibility of spraying manure on roads or another person’s property.

Ammonia-N loss from land application of manure is important because it is a loss of fertilizer nitrogen, and it is a source of air pollution. A previous study and several extension publications state that irrigation of animal manure increases ammonia-N loss by 10% to 25% (Chastain, 2019). As a result, the total ammonia-N loss was the sum of the ammonia-N lost while the manure traveled from the irrigation nozzle to the ground and the ammonia-N lost as the manure released ammonia-N after striking the ground.

The objective of this presentation is to summarize the results of a meta-analysis of 55 data sets from 3 independent sources to quantify the ammonia-N lost during the interval of time from when the liquid manure exited the irrigation equipment and when a sample was collected on the ground. The complete review, data analysis, and the data used were provided by Chastain (2019).

What Did We Do?

The study included data from traveling gun, center pivot, and impact sprinkler irrigation of untreated liquid and slurry manure, lagoon supernatant, and effluent from an oxidation ditch. The data sets included measurements of the total solids content (TS, %), total ammoniacal N concentration (TAN = ammonium-N + Ammonia-N), and total nitrogen (TKN) for a sample collected from the lagoon or storage to describe what was in the manure that left the irrigation nozzle and measurements of the TS, TAN and TKN in the samples that were collected from containers on the ground. The concentrations of TS, TAN, and TKN in the ground collected manure samples were plotted against the TS, TAN, and TKN concentrations in the irrigated manure. The data pairs were analyzed using linear regression to determine if there was a statistically significant difference between the irrigated and ground collected samples. If there was perfect agreement the slope of the line would be 1.0. Therefore, statistical tests were used to determine if the slope of the line was statistically different from 1.0. If the test indicated that the slope was not significantly different from 1.0 then irrigation did not change the concentration of the TS, TAN, or TKN.

What Have We Learned?

Well-known data used in irrigation design indicates that evaporation loss during irrigation ranges from 1% to 3.5%. The plot of the data for irrigated manure is shown in Figure 1. It was determined that the slope of the regression line was statistically greater than 1.0. Therefore, evaporation losses were small, 2.4%, and agreed with previous studies on irrigation performance.

Figure 1. Comparison of the total solids content of the irrigated manure and the samples collected on the ground indicated that evaporation losses were 2.4%.

The plot of the TAN concentrations collected on the ground and the TAN contained in the irrigated water is shown in Figure 2.). The results showed that irrigation of manure did not result in a change in the concentration of TAN. Therefore, irrigation of manure did not cause ammonia-N loss.

The same type of analysis was done for the total nitrogen data to serve as check on the TAN results. As expected, the analysis showed that irrigation did not significantly alter the concentration of TKN.

Figure 2. The concentration of the total ammoniacal nitrogen was not changed as the manure traveled through the air. This was indicated by a regression line slope that was not significantly different from 1.0.

A previous study reported TAN losses ranging from 10% to 25% during irrigation of liquid manure. Error analysis of the techniques used in these studies indicated that most of the average ammonia-N loss predicted was due to volume collection error in the irrigate-catch technique that was used, and not evaporation and drift as was assumed (see Chastain, 2019). It was concluded that irrigation, as a manure application method, did not increase ammonia-N losses. These results do not imply that ammonia volatilization after manure strikes the ground is to be ignored. The suitability of irrigation as a liquid manure application method should be evaluated based on the level of treatment and the potential impact of odors on neighbors.

Future Plans

These results are being used in extension programs and to help refine estimates of ammonia-N loss associated with land application of manure.

Author

John P. Chastain, Professor and Extension Agricultural Engineer, Agricultural Sciences Department, Clemson University

Corresponding author email address

jchstn@clemson.edu

Additional Information

Chastain, J.P. 2019. Ammonia Volatilization Losses during Irrigation of Liquid Animal Manure. Sustainability 11(21), 6168; https://doi.org/10.3390/su11216168.


The authors are solely responsible for the content of these proceedings. The technical information does not necessarily reflect the official position of the sponsoring agencies or institutions represented by planning committee members, and inclusion and distribution herein does not constitute an endorsement of views expressed by the same. Printed materials included herein are not refereed publications. Citations should appear as follows. EXAMPLE: Authors. 2022. Title of presentation. Waste to Worth. Oregon, OH. April 18-22, 2022. URL of this page. Accessed on: today’s date.

Estimating Routine Beef and Dairy Mortality Masses Based on Systems Operation

Purpose

The day-to-day loss of animals is a fact of life all cattle producers must face and prepare for. Unfortunately, most published data of animal mortalities are for one-time, catastrophic die offs – where all the cattle on a farm must be exterminated because of disease outbreaks or natural disasters. Routine mortalities on cattle farms do not happen all at once, and mortality rates vary greatly between different life stages of animals and types of production systems.

An expert panel was convened by the Agricultural Working Group of the Chesapeake Bay Program to determine annual mortality, nitrogen and phosphorus masses produced by cow-calf, dairy and cattle on feed (feedlot) operations in the watershed. This paper concentrates on the annual mortality masses estimations determined by the panel. Cattle and Dairymen can use these values to plan for disposal of routine losses.

What Did We Do?

The panel looked, at depth, into existing production systems, and combined morality rates at different life stages, the size of animals at time of death, and the carcass composition varying with age to determine mortality and nutrient masses produced by typical cattle farms in the watershed.

The panel chose a 50-cow cow-calf operation as a model system, where cattle are on pasture 95% of the time. Under ideal conditions, each cow will yield one calf per year to be sold by year’s end. Some female calves will be retained to replace culled cows from the herd, maintaining the same general herd size. It was assumed there was no death loss of mother cows in the herd. We used USDA-APHIS (2010) data of average annual death loss of immature cattle combined with the average weight of cattle at different life-stages to determine weight of mortalities produced each year.

A total confinement beef feedlot was used to model mortalities for cattle on feed. Cattle were assumed to grow linearly with cattle placed in the feedlot at 400 to 600 pounds, and leaving at 1,000 to 1,200 pounds with an average time on lot of 120 days. Midwestern data (Vogel et al, 2015) was used to estimate annual deathrates per feedlot space at 30-day increments since placement in the feedlot.

A 100-cow milking herd was used as a reference for dairy systems. The reference farm contained 50 female calves and 50 heifers in development. Heifers are bred at 15 months and give birth around 24 months (2 years) of age. Male calves are exported from the farm as soon as possible for development as lower grade beef cattle. The reference dairy had heifers and dry cows on pasture, with the active milking herd in free-stall barns or alternative confinement for a 300-day lactation. USDA-APHIS (2016) data of average annual death loss of all types of dairy cattle was combined with the average weight of cattle at different life-stages to determine weight of mortalities produced each year.

What Have We Learned?

Figure 1 shows the estimated total weight of mortalities produced by a 50 cow, cow-calf herd each year broken down by age of animal dying.  As can be seen in Figure 1, the greatest weight of mortalities occurred before calves were weaned – assuming no death of mother cows. The values in Figure 1 represent 1.52 calves born dead, 1.92 calves dying before weaning, and 0.87 head dying after weaning. This means a farmer should prepare for the loss of 2 newborn calves, 2 un-weaned calves, and one weaned steer/heifer per 50 mother cows each year.  Dividing the total weight of mortalities by 50 head gives an average per cow annual mortality of 32 pounds per year.

Figure 1. Estimated Total Annual Weight of Mortalities Produced by a 50 Cow, Cow-Calf Herd.

Figure 2 shows the estimated total weight of mortalities produced by a 100-head-space feedlot. The greatest source of mortalities is steers and heifers weighing close to 700 pounds (31 to 60 days after arrival on the feedlot. Dividing the total weight of mortalities by 100 gives an average annual mortality weight of 18 pounds per head-space per year. The feedlot owner should prepare for approximately 3 animals dying each year per 100 head-space.

Figure 2. Estimated Total Annual Weight of Mortalities Produced by a 100 head-space feedlot.

Figure 3 shows the estimated total weight of mortalities produced by a 100-cow dairy.  Dividing the total weight of mortalities by 100 head gives an average annual mortality weight of 90 pounds per milking cow. The greatest source of mortalities is mature cows. Dairies should prepare for as much as 6 mature cows, 3 pre-weaned calves and heifers, and 1 weaned heifer dying each year per 100 mature cows.

Figure 3. Estimated Total Annual Weight of Mortalities Produced by a 100 milking head dairy.

Future Plans

Cattle producers can use the values estimated by this project to determine resources needed to prepare for mortalities. If burial is the preferred option, the space required to bury mortalities for the expected life of the operation; for composting, the area, and weight of carbon source required to compost; and for incineration, an incinerator capable of handling the largest animal housed on the farm.

Authors

Douglas W. Hamilton, Ph.D. P.E., Extension Waste Management Specialist, Oklahoma State University

Corresponding author email address

dhamilt@okstate.edu

Additional authors

Thomas M. Bass, Livestock Environment Associate Specialist, Montana State University; Amanda Gumbert, PhD., Water Quality Extension Specialist, University of Kentucky; Ernest Hovingh, DVM, PhD., Research Professor Extension Veterinarian, Pennsylvania State University; Mark Hutchinson, Extension Educator, University of Maine; Teng Teeh Lim, PhD, P.E., Extension Professor, University of Missouri;  Sandra Means, P.E., USDA NRCS, Environmental Engineer, East National Technology Support Center (Retired); George “Bud” Malone, Malone Poultry Consulting; Jeremy Hanson, WQGIT Coordinator – STAC Research Associate, Chesapeake Research Consortium – Chesapeake Bay Program

Additional Information

Hamilton, D., Bass, T.M., Gumbert, A., Hovingh, E., Hutchinson, M., Lim, T.-T., Means, S., and G. Malone. (2021). Estimates of nutrient loads from animal mortalities and reductions associated with mortality disposal methods and Best Management Practices (BMPs) in the Chesapeake Bay Watershed (DRAFT). Edited by J. Hanson, A. Gumbert & D. Hamilton.  Annapolis, MD: USEPA Chesapeake Bay Program.

USDA-APHIS (2010). Mortality of Calves and Cattle on U.S. Beef Cow-calf Operations: Info Sheet, 2010. Fort Collins, CO: USDA-APHIS.

USDA-APHIS. (2016). Dairy 2014: Health and Management Practices on US Dairy Operations, 2014. Report, 3, 62-77. Fort Collins, CO: USDA-APHIS,.

Vogel, G. J., Bokenkroger, C. D., Rutten-Ramos, S. C., & Bargen, J. L. (2015). A retrospective evaluation of animal mortality in US feedlots: rate, timing, and cause of death. Bov. Pract, 49(2), 113-123.

Acknowledgements

Funding for this project was provided by the US-EPA Chesapeake Bay Program through Virginia Polytechnic and State University EPA Grant No. CB96326201


The authors are solely responsible for the content of these proceedings. The technical information does not necessarily reflect the official position of the sponsoring agencies or institutions represented by planning committee members, and inclusion and distribution herein does not constitute an endorsement of views expressed by the same. Printed materials included herein are not refereed publications. Citations should appear as follows. EXAMPLE: Authors. 2022. Title of presentation. Waste to Worth. Oregon, OH. April 18-22, 2022. URL of this page. Accessed on: today’s date.