
Ammonia Emissions and Emission Factors: A Summary of Investigations at Beef Cattle Feedyards on the Southern High Plains

Waste to Worth: Spreading science and solutions logoWaste to Worth home | More proceedings….

Why Study Ammonia Emitted from Feedlots?

Ammonia volatilization is a major component of the nitrogen balance of a feedyard, and the effects of ammonia loss range from the economic (loss of manure fertilizer value) to the environmental (air quality degradation, overfertilization of ecosystems). Although not yet regulated, ammonia emissions from cattle are required to be reported under the Emergency Planning and Community Right to Know Act. Emission factors are used to estimate ammonia emissions for purposes of reporting and national inventories, but current emission factors are based on limited data. Our objective was to definitively quantify ammonia emissions and emission factors from commercial feedyards on the southern High Plains of Texas.
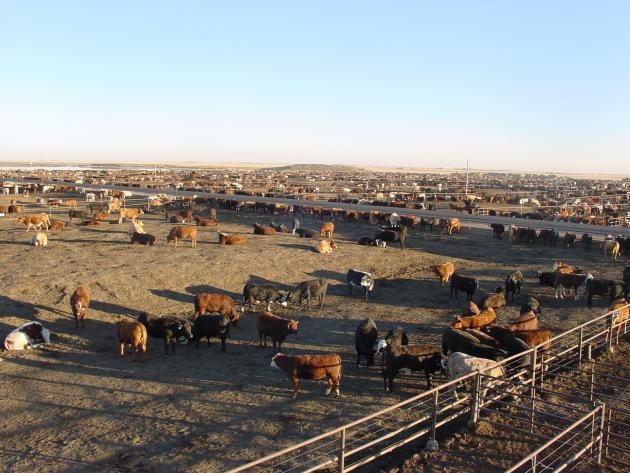
A typical feedyard on the High Plains of Texas. In the foreground, cattle in corrals with a stocking density of about 150 sq. ft./animal. In the background on the left, the runoff water retention pond, and center, a mound of stockpiled manure.

What Did We Do?

Ammonia emissions were quantified at three commercial feedyards in the Texas Panhandle from 2002 to 2008 using micrometeorological methods. Seasonal, intensive measurement campaigns were conducted from 2002 to 2005 at one feedyard, and ammonia emissions were near-continously monitored from 2007-2008 at two more feedyards. Meteorological and cattle management data were also collected.

What Have We Learned?

Ammonia emissions followed a distinct annual pattern. Emissions during summer were about twice those during winter, while spring and autumn emissions were intermediate. Annualized ammonia emissions ranged from 0.20 to 0.37 lb NH3/animal/day, and averaged 0.26 lb NH3/animal/day over all studies. Ammonia loss as a fraction of nitrogen fed to cattle averaged 41% during winter and 69% during summer; on an annual basis, 54% of fed nitrogen was lost as ammonia. Greatest emissions were observed when crude protein in cattle rations exceeded the nutrient requirements of beef cattle. Mean monthly ammonia emissions were strongly correlated with mean monthly temperature, and the relationship can be used to predict ammonia emissions from southern High Plains feedyards. Cattle feeders that meet recommended crude protein in rations can expect to lose half of fed N as ammonia. We recommend an annual emission factor of 88 lb/head for beef cattle feedyards based on one-time capacity, or 39 lb/head fed, based on a 150-d feeding period.
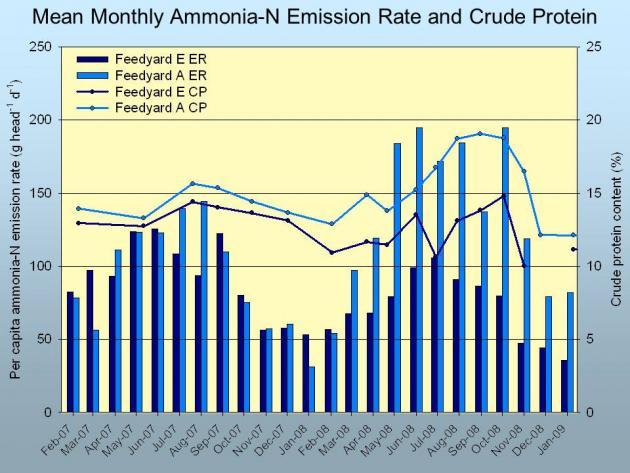
The annual pattern of ammonia emission rates (ER) followed seasonal temperatures, but also was sensitive to dietary crude protein (CP). Adding distillers grains to rations from March, 2008 to October, 2008 increased crude protein at Feedyard A to as high as 19%. Ammonia emissions greatly increased compared with the previous year and compared with Feedyard E.

Future Plans

Next steps involve using the extensive database from this research to adapt and refine process-based models of ammonia emissions. These models, based on the actual physical and chemical processes that control ammonia loss, will be more generally applicable than emission factors to a wider range of feedyards.

On an annual basis, ammonia emission averaged 0.26 lb per animal per day across the three feedyards and six years of study. Increased ammonia emission at Feedyard A in 2008 was due to high dietary crude protein when distillers grains were added to rations. Using these data and other estimates of ammonia loss from retention ponds and stockpiles, we recommend, for beef cattle fed a diet that meets protein requirements, an annual emission factor of 88 lb/head based on one-time capacity, or 39 lb/head fed, based on a 150-d feeding period.

Authors

Richard W. Todd, Research Soil Scientist, USDA-ARS Conservation and Production Research Laboratory, Bushland, Texas, richard.todd@ars.usda.gov

Richard W. Todd, Research Soil Scientist; N. Andy Cole, Research Leader and Research Animal Scientist (Nutrition); and Heidi M. Waldrip, Research Soil Scientist: USDA-ARS Conservation and Production Research Laboratory, Bushland, Texas.

Additional Information

Cole, N.A., R.N. Clark, R.W. Todd, C.R. Richardson, A. Gueye, L.W. Greene, and K. McBride. 2005. Influence of dietary crude protein concentration and source on potential ammonia emissions from beef cattle manure.  J. Anim. Sci. 83:722 731.

Cole, N.A., A.M. Mason, R.W. Todd, M. Rhoades, and D.B. Parker. 2009. Chemical composition of pen surface layers of beef cattle feedayrds. Prof. Anim. Sci. 25:541-552.

Flesch, T.K., J.D. Wilson, L.A. Harper, R.W. Todd, and N.A. Cole. 2007. Determining ammonia emissions from a cattle feedlot with an inverse dispersion technique. Agric. For. Meteorol. 144:139-155.

Hristov, A. N., M. Hanigan, A. Cole, R. Todd, T. A. McAllister, P. M. Ndegwa, A. Rotz. 2011. Ammonia emissions from dairy farms and beef feedlots: A review. Can. J. Anim. Sci. 91:1-35.

Preece, S.L., N.A. Cole, R.W. Todd, and B.W. Auvermann. 2012. Ammonia emissions from cattle-feeding operation. Texas A&M AgriLife Extension Bulletin E-632 12/12.

Rhoades, M.B., D.B. Parker, N.A. Cole, R.W. Todd, E.A. Caraway, B.W. Auvermann, D.R. Topliff, and G.L. Schuster. 2010. Continuous ammonia emission measurements from a commercial beef feedyard in Texas. Trans. ASABE 53:1823-1831.

Sakirkin, S.L., N.A. Cole, R.W. Todd, and B.W. Auvermann. 2011. Ammonia emissions from cattle-feeding operations. Part 1: issues and emissions. Texas Agricultural Experiment Station Bulletin, Air Quality Education in Animal Agriculture, Issues: Ammonia, December, 2011. p. 1-11.

Sakirkin, S., R.W. Todd, N.A. Cole, and B.W. Avermann. 2011. Ammonia emissions from cattle-feeding operations. Part 2: abatement. Texas Agricultural Experiment Station Bulletin, Air Quality Education in Animal Agriculture, Issues: Abatement, December, 2011. p. 1-11.

Todd, R.W., N.A. Cole, and R.N. Clark. 2006. Reducing crude protein in beef cattle diet reduces ammonia emissions from artificial feedyard surfaces. J. Environ. Qual. 35:404-411.

Todd, R.W., N.A. Cole, M.B. Rhoades, D.B. Parker, and K.D. Casey. 2011. Daily, monthly, seasonal and annual ammonia emissions from southern High Plains cattle feedyards. J. Environ. Qual. 40:1-6.

Todd, R.W., N.A. Cole, H.M. Waldrip, and R.M. Aiken. 2013. Arrhenius equation for modeling feedyard ammonia emissions using temperature and diet crude protein. J. Environ. Qual. 2013. (accepted for publication).

Acknowledgements

Research was supported by CSREES Grant #TS2006-06009 under the direction of Dr. John Sweeten, Resident Director, Texas A&M University AgriLife Research and Extension Center, Amarillo, TX. Larry Fulton, Research Technician, USDA-ARS-CPRL, provided invaluable technical and logistical support and expertise.

The authors are solely responsible for the content of these proceedings. The technical information does not necessarily reflect the official position of the sponsoring agencies or institutions represented by planning committee members, and inclusion and distribution herein does not constitute an endorsement of views expressed by the same. Printed materials included herein are not refereed publications. Citations should appear as follows. EXAMPLE: Authors. 2013. Title of presentation. Waste to Worth: Spreading Science and Solutions. Denver, CO. April 1-5, 2013. URL of this page. Accessed on: today’s date.
Ammonia Emissions from Eight Types of Dairy Manure During Storage

Waste to Worth: Spreading science and solutions logoWaste to Worth home | More proceedings….

Why Study Ammonia Emissions from Dairy Manure?

  1. To study the interactive effects of large particle solids removal, anaerobic digestion and amendment of a manure additive (More than manure®), along with environmental factors on NH3 emissions from dairy slurry during storage.
  2. To demonstrate a cost-effective and instantaneous NH3 measurement method using GasAlert NH3 detector under field conditions.

What Did We Do?

Twenty-six liters of each manure was stored in plastic storage buckets in duplicate in a  barn with the surface open to the atmosphere. GasAlert readings of NH3 were obtained weekly from each container. Samples from each manure were analyzed for total N, NH4-N, total solids and volatile solids. Data collected was manure temperature, manure pH and ambient temperature. Average NH3 concentration, peak NH3 concentration and NH3 flux was calculated for each manure treatment.

What Have We Learned?

1. AD manure may result in greater N loss in the form of NH3 than raw manure.

2. Higher amounts of solids can preserve more total nitrogen in manure, which can potentially result in greater NH3 loss during storage.

3. The manure amendment “More Than Manure®” did not have a significant effect on preserving N in manure during storage.

4. The GasAlert® NH3 detector can be adopted as a cost-effective tool for determination of  NH3.

Future Plans

1.Examine the effect of manure sources on emissions of greenhouse gases (CO2, CH4 and N2O) during storage.

2. Include additional environmental factors, such as ventilation and solar radiation, to observe the external impact on manure N loss potential.

3. Evaluate gaseous losses from manure over extended lengths of time, > 3 months.

Additional Information

Ammonia Emissions from Eight Types of Diary Manure During Storage (PDF version of poster)

Poster Graphs

Authors

Joe Harrison, professor, Washington State University, Puyallup Research and Extension Center, jhharrison@wsu.edu

Fei Sun1, graduate student

Joe Harrison1, professor

Pius Ndegwa2, associate professor

HungSoo Joo2, post Doc research associate

Liz Whitefield1, research associate

Kris Johnson2, professor

1Washington State University Research and Extension Center, 2 Washington State University

Acknowledgements

Specialty Fertilizer Products (SFP), LLC for financial support  


The authors are solely responsible for the content of these proceedings. The technical information does not necessarily reflect the official position of the sponsoring agencies or institutions represented by planning committee members, and inclusion and distribution herein does not constitute an endorsement of views expressed by the same. Printed materials included herein are not refereed publications. Citations should appear as follows. EXAMPLE: Authors. 2013. Title of presentation. Waste to Worth: Spreading Science and Solutions. Denver, CO. April 1-5, 2013. URL of this page. Accessed on: today’s date.


Particulate Matter Adjacent to Cattle Deep-Bedded Monoslope Facilities

Waste to Worth: Spreading science and solutions logoWaste to Worth home | More proceedings….

Why Study Monoslope Barns and Air Quality?

Confined cattle facilities are an increasingly common housing system in the Northern Great Plains region.  Many of these facilities add organic bedding material to the pens once or twice per week.  Particulate matter concentrations and emissions from these facilities have not been evaluated.  The objective of this study was to quantify particulate matter concentration adjacent to a deep-bedded mono-slope facility housing cattle and to compare the concentrations during normal operation and a bedding event.

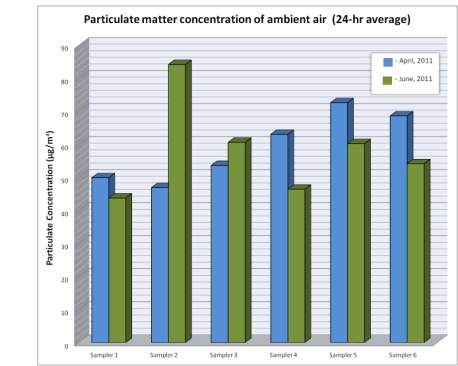
Average 24-hr total particulate matter concentration of ambient air collected from a beef deep-bedded monoslope barn.

What Did We Do?

Three Lo-Vol Particulate Samplers were placed 4.6 m from the north side of the building, and three were placed 4.6 m from the south side of the building with 36.6 m between the samplers on each side.  Average sampler flow rate was 16.7 L/min.  Samples were collected over two five-day periods (April and June 2011).  Each sample period included three 24-hr collections during normal operation and two 3-hr collections during a bedding event.  Filters were collected, conditioned for 48 hr at 21.1 °C and 35% humidity, then weighed in micrograms and analyzed on a Beckman Coulter LS 230 to determine total suspended particulate matter (TSP).

What Have We Learned?

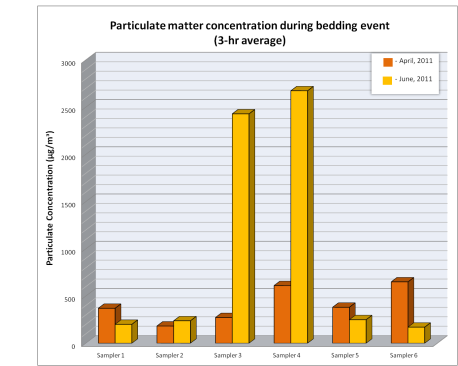
Average 3-hr total particulate matter concentration of air collected during a bedding event of beef deep-bedded monoslope barn.

During the April sampling period, average 24-hr TSP concentration ranged from 40.1 to 91.4 µg/m3 during days of normal operation. Average 3-hr particulate matter concentration during bedding events ranged from 281.8 to 540.5 µg/m3.  During the June sampling period, 24-hr TSP concentration on days of normal operation ranged from 52.7 to 64.6 µg/m3, while 3-hr particulate matter concentration during bedding events averaged 302.4 to 1684.2 µg/m3. Sweeten et al. (1998) reported average TSP concentrations of 410 µg/m3 measures for 24 hr periods on open feedlots in Texas. In general, particulate matter concentrations adjacent to the deep-bedded monoslope facility were lower than previously reported for open lot feedlots.  Concentrations of TSP were higher during the 3-hr bedding event than during normal operation.

Future Plans

To compliment this research, data has been collected from two monoslope beef barns over the past two years as part of an AFRI-funded research grant.  MiniVol particulate samplers were used to determine PM-10 and PM-2.5 concentrations over 24-hr periods.  Data collected from this project will further define the particle size of dust being emitted from these facilities.

Authors

Mindy J. Spiehs, Research Animal Scientist, USDA – ARS Meat Animal Research Center, Clay  Center, NE, mindy.spiehs@ars.usda.gov

Greg A. Holt, Research Leader, USDA- ARS Cotton Production and Processing Research Unit, Lubbock, TX

Kris D. Kohl, Extension Agricultural Engineer, Iowa State University Extension and Outreach, Storm Lake, IA

Beth E. Doran, Extension Beef Specialist, Iowa State University Extension and Outreach, Orange City, IA

David B. Parker, Professor and Director, Commerical Core Laboratory, Palo Duro Research Center, West Texas A & M University, Canyon, TX

Erin Cortus, Assistant Professor, South Dakota State University, Brookings, SD

Additional Information

Acknowledgements

The authors wish to acknowledge James (Bud) Welch and Alan Kruger for assembly and disassembly of  the particulate matter sampling equipment and Ron and Clayton Christensen for the use of their cattle facility.  Mention of trade names or commercial products in this publication is solely for the purpose of providing specific information and does not imply recommendation or endorsement by the U.S. Department of Agriculture.  USDA is an equal opportunity provider and employer.


The authors are solely responsible for the content of these proceedings. The technical information does not necessarily reflect the official position of the sponsoring agencies or institutions represented by planning committee members, and inclusion and distribution herein does not constitute an endorsement of views expressed by the same. Printed materials included herein are not refereed publications. Citations should appear as follows. EXAMPLE: Authors. 2013. Title of presentation. Waste to Worth: Spreading Science and Solutions. Denver, CO. April 1-5, 2013. URL of this page. Accessed on: today’s date.
Estimating Ammonia Emissions from Livestock Operations Using Low-Cost, Time-Averaged Concentration Measurements

Waste to Worth: Spreading science and solutions logoWaste to Worth home | More proceedings….

Abstract

Recent regulations on ammonia (NH3) and other gaseous emissions by the EPA requires managers of animal feeding operations (AFOs) to report their annual emissions of greenhouse gases (GHGs), with the possibility of federal funding in the near future to be allocated for enforcement of GHG reporting as well as to levy large fines against AFOs that exceed the regulation limitations for GHG emissions. The current method of estimating NH3 emissions for AFOs is a “back of the envelope” type calculation based upon population and type of animal within an individual AFO.

Emissions of NH3 can vary drastically depending on climate, soil type, location, and other factors. This causes a need for accurate, nearly continuous, on-site measurements of NH3, which can be difficult to disseminate to and implement in an economically beneficial way by individual AFO facilities required to report NH3. Here we outline a robotic system developed for the measurement of NH3 that is cost-efficient to employ and easy to maintain while providing accurate year-round data on NH3 emissions. The system utilizes diffusive/passive samplers (e.g., Radiello, Sigma-Aldrich distributor) that are exposed to the environment under user-defined weather conditions which will yield observations of NH3 concentrations for a period representing several weeks. Measurement data from the robotic systems can be easily converted to accurate emissions estimates by using an inverse model (e.g., using a simple software package).

Data from the passive samplers will be shown for multiple sites and years of data acquired during extensive field testing of the robotic samplers at dairy and cattle feedlot operations in northeastern Colorado from 2011-2012. Emissions obtained using a simple inverse model on the data will be shown as well.

Authors

Kira Shonkwiler, Colorado State University, Dept of Atmospheric Science kshonk@atmos.colostate.edu

Dr. Jay Ham, Colorado State University, Dept of Soil and Crop Sciences, Christina Williams, Colorado State University, Dept of Soil and Crop Sciences

The authors are solely responsible for the content of these proceedings. The technical information does not necessarily reflect the official position of the sponsoring agencies or institutions represented by planning committee members, and inclusion and distribution herein does not constitute an endorsement of views expressed by the same. Printed materials included herein are not refereed publications. Citations should appear as follows. EXAMPLE: Authors. 2013. Title of presentation. Waste to Worth: Spreading Science and Solutions. Denver, CO. April 1-5, 2013. URL of this page. Accessed on: today’s date.

Direct Measurements of Methane Emissions from a Dairy Lagoon in Northeast Colorado

Waste to Worth: Spreading science and solutions logoWaste to Worth home | More proceedings….

Abstract

Methane (CH4) emissions from cattle feedlots and dairies could represent a large component of agriculture’s greenhouse gas (GHG) inventory.  A significant source of CH4 is anaerobic lagoons used to store and process manure slurries.  Understanding these systems is a crucial step in quantifying the carbon budgets of livestock operations.  New open-path CH4 analyzers provide a method for measuring CH4 emissions from waste lagoons on a near continuous basis.  The resulting data will help to better quantify GHG emissions related to beef and milk production. At a commercial dairy in northeastern Colorado during 2011 – 2012, emissions of CH4 were measured at the on-site waste lagoon (3.1-ha) using a micrometeorological measurement technique called eddy covariance (EC). The only method to directly measure fluxes of energy and trace gases at the field-scale, EC is widely utilized around the globe to quantify carbon and water budgets for a variety of ecosystems and landscapes. Methane fluxes peaked around 7 mol m^-2 d^-1 in mid- to late-summer 2012, with much variability from Jul – Oct (5 +/- 1.4 mol m^-2 d^-1). Yearly carbon budgets for the release of methane from the lagoon will be examined as well.

Authors

Kira Shonkwiler, Colorado State University, Dept of Atmospheric Science              kshonk@atmos.colostate.edu

Dr. Jay Ham, Colorado State University, Dept of Soil and Crop Sciences, Christina Williams, Colorado State University, Dept of Soil and Crop Sciences


The authors are solely responsible for the content of these proceedings. The technical information does not necessarily reflect the official position of the sponsoring agencies or institutions represented by planning committee members, and inclusion and distribution herein does not constitute an endorsement of views expressed by the same. Printed materials included herein are not refereed publications. Citations should appear as follows. EXAMPLE: Authors. 2013. Title of presentation. Waste to Worth: Spreading Science and Solutions. Denver, CO. April 1-5, 2013. URL of this page. Accessed on: today’s date.

Software For Evaluating the Environmental Impact of Dairy and Beef Production Systems

Waste to Worth: Spreading science and solutions logoWaste to Worth home | More proceedings….

Why Model Environmental Impacts of Livestock?

Quantifying the long term environmental impacts of dairy and beef production is complex due to the many interactions among the physical and biological components of farms that affect the amount and type of emissions that occur. Emissions are influenced by climate and soil characteristics as well as internal management practices. Software models are needed to perform an integrated and comprehensive assessment of all important environmental and economic effects of farm management and mitigation strategies. Related: Manure value & economics

What Did We Do?

Figure 1. The Integrated Farm System Model simulates the performance, determines the economics, and predicts the air and water emissions of farm production systems.

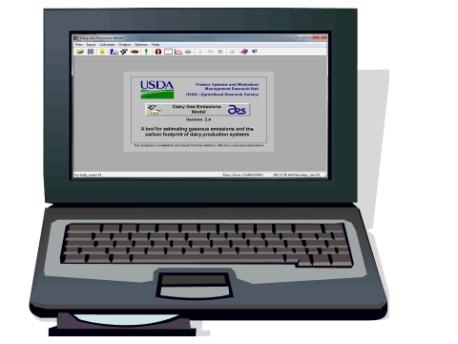
Software tools were created that perform whole-farm analyses of the performance, economics and environmental impact of dairy and beef production systems. The Integrated Farm System Model (IFSM) is a comprehensive research tool that simulates production systems over many years of weather to quantify losses to the environment and the economics of production. From the simulated performance and losses, environmental footprints are determined for carbon, energy use, water use and reactive nitrogen loss. Crop, dairy and beef producing farms can be simulated under different management scenarios to evaluate and compare potential environmental and economic benefits. The Dairy Gas Emissions Model (DairyGEM) provides a simpler educational tool for studying management effects on greenhouse gas, ammonia and hydrogen sulfide emissions and the carbon, energy and water footprints of dairy production systems.

What Have We Learned?

Analyses with either the IFSM or DairyGEM tools illustrate the complexity of farming systems and the resultant effect of management choices. Although IFSM was primarily developed and used as a research tool, it is also used in classroom teaching and other education applications. DairyGEM provides an easier and more graphical tool that is best suited to educational use.

Future Plans

Figure 2. DairyGEM is an educational tool for evaluating management effects on air emissions and environmental footprints of dairy production systems.

Development of these software tools continues. Work is currently underway to add the simulation of VOC emissions to both models. Routines are also being implemented to better represent the performance and emissions of beef feed yards.

Authors

C. Alan Rotz, Agricultural Engineer, USDA/ARS; al.rotz@ars.usda.gov

Additional Information

The IFSM and DairyGEM software tools are available through Internet download [https://www.ars.usda.gov/research/software/?modeCode=80-70-05-00] for use in individual, workshop and classroom education. Reference manuals and other detailed information on the models is also available at this website.

Acknowledgements

Many people have contributed to the development of these models and software tools. Although they can not all be listed here, they are acknowledged in each software program.

The authors are solely responsible for the content of these proceedings. The technical information does not necessarily reflect the official position of the sponsoring agencies or institutions represented by planning committee members, and inclusion and distribution herein does not constitute an endorsement of views expressed by the same. Printed materials included herein are not refereed publications. Citations should appear as follows. EXAMPLE: Authors. 2013. Title of presentation. Waste to Worth: Spreading Science and Solutions. Denver, CO. April 1-5, 2013. URL of this page. Accessed on: today’s date.

Environmental Footprints of Beef Produced At the U.S. Meat Animal Research Center

Waste to Worth: Spreading science and solutions logoWaste to Worth home | More proceedings….

Why Study the Environmental Footprint of Beef?

As a major contributor in food production, beef production provides a major service to our economy that must be maintained. Production of cattle and the associated feed crops required also impact our environment, and this impact is not well understood. Several studies have determined the carbon footprint of beef, but there are other environmental impacts that must be considered such as fossil energy use, water use, and reactive nitrogen loss to the environment. Because of the large amount of data available to support model evaluation, production systems of the U.S. Meat Animal Research Center were simulated with the Integrated Farm System Model for the purpose of evaluating the environmental impact of the beef cattle produced.

What Did We Do?

The environmental footprints of beef produced at the U.S. Meat Animal Research Center (MARC) in Clay Center, Nebraska were determined with the objective of quantifying improvements achieved over the past 40 years. Relevant information for MARC operations was used to establish parameters representing their production system with the Integrated Farm System Model. The MARC farm, cow calf and feedlot operations were each simulated over recent historical weather to evaluate performance, environmental impact and economics. The current farm operation included 2,078 acres of alfalfa and 2,865 acres of corn to produce feed predominately for the beef herd of 5,500 cows, 1200 replacement heifers and 3,724 cattle finished per year. Spring and fall cow calf herds were fed on 24,000 acres of pastureland supplemented through the winter with hay and silage produced by the farm operation. Feedlot cattle were backgrounded 3 mo on hay and silage and finished over 7 mo on a diet high in corn grain and wet distiller’s grain.

What Have We Learned?

Model simulated predictions for weather year 2011 were within 1% of actual records for feed production and use, energy use, and production costs. A 25-year simulation of their current production system gave a carbon footprint of 10.9 lb of CO2 equivalent units per lb body weight (BW) sold, and the energy required to produce that beef was 11,400 Btu/lb BW. The total water required was 2,560 gallon/lb BW sold, and the water footprint excluding that obtained through precipitation was 335 gallon/lb BW. Reactive N loss was 0.09 lb/lb BW, and the simulated total cost of producing their beef was $0.96/lb BW sold. Simulation of the production practices of 2005 indicate that the use of distiller’s grain in animal diets has had a small impact on environmental footprints except that reactive N loss has increased 10%. Compared to 1970, the carbon footprint of beef produced has decreased 6% with no change in the energy footprint, a 3% reduction in the reactive N footprint, and a 6% reduction in the real cost of production. The water footprint, excluding precipitation, has increased 42% due to greater use of irrigated corn production.

Future Plans

Now that the modeling approach has been shown to appropriately represent beef production systems, further simulation analyses are planned to evaluate beef production systems on a regional and national scale.

Authors

C. Alan Rotz, Agricultural Engineer, Pasture Systems and Watershed Management Research Unit, USDA/ARS al.rotz@ars.usda.gov

B.J. Isenberg, Research Assistant, The Pennsylvania State University

K.R. Stackhouse-Lawson, Director of Sustainability Research, National Cattlemen’s Beef Association

E.J. Pollak, Director, Roman L. Hruska U.S. Meat Animal Research Center, USDA / ARS

Additional Information

C. Alan Rotz, al.rotz@ars.usda.gov

Acknowledgements

Funded in part by The Beef Checkoff and the USDA’s Agricultural Research Service


The authors are solely responsible for the content of these proceedings. The technical information does not necessarily reflect the official position of the sponsoring agencies or institutions represented by planning committee members, and inclusion and distribution herein does not constitute an endorsement of views expressed by the same. Printed materials included herein are not refereed publications. Citations should appear as follows. EXAMPLE: Authors. 2013. Title of presentation. Waste to Worth: Spreading Science and Solutions. Denver, CO. April 1-5, 2013. URL of this page. Accessed on: today’s date.

Iowa Manure Management Action Group (IMMAG)

Waste to Worth: Spreading science and solutions logoWaste to Worth home | More proceedings….

Abstract

The Iowa Manure Management Action Group (IMMAG) was a concept born in 1997 to provide a comprehensive vehicle to deliver manure management information.  It is hard to imagine, but at that time web pages were just beginning to be used as vehicles to share information, and even harder to imagine is the fact that while information on manure management existed, it was difficult to access, and it was just not a topic that garnered much positive attention.

IMMAG began as state-level technical committee comprised of public and private-sector entities with the objectives to 1) provide access to comprehensive information on manure management issues; 2) develop relevant educational materials and 3) provide them in a format that could be easily accessible.

Now, 15 years later, what was supposed to be short-term, one-year effort, has turned into a major outreach and education effort for Iowa State University Extension and Outreach and their partners.  In addition to the web page, IMMAG has hosted many field days and training workshops over the years as well as coordinated the development of countless fact sheets, newsletters and other educational pieces. 

Why Was the IMMAG formed?

As the livestock sector in Iowa changed in the 1990’s it became apparent that a mechanism for information delivery was needed that could quickly evolve to keep livestock producers in tune with changing regulations, up-to-date with current research and understand best management practices to help assure manure’s value as a crop nutrient resource and help protect Iowa’s natural resources.

IMMAG was a concept born in 1997 to provide a comprehensive vehicle to deliver manure management information, develop and deliver educational programs, and design tools and resources that could be used by producers, technical agencies, educational institutions, researchers, consultants and the general public.  IMMAG originated as a state-level technical committee under the leadership of the Iowa NRCS that brought together the state agencies, land-grant institution, commodity groups, environmental groups and private sector interests who proceeded to identify challenges and needs for manure management information. 

What Did We Do?

After an initial needs assessment was completed, members of IMMAG agreed the highest priority was the development of an integrated Web site for all manure management information.  A Web page would allow the most flexibility in keeping materials up-to-date.  The members also agreed that producers and others not having internet access would be able to request printed materials from the site made available through the commodity organization.   Once all existing materials were organized and included on the IMMAG Web page, a needs assessment was conducted by ISU Extension and the commodity group to determine information gaps and the kinds of new material that needed to be developed.  Materials were not limited to print resources, but also included development and delivery of nutrient planning workshops, field days and tools.  Along with a needs assessment, the Web site was thoroughly evaluated by members of the environmental groups and the general public to determine how accessible the information was and how easy it was to use and comprehend. 

During the past 15 years, the Iowa Manure Management Action Group has distributed monthly newsletters (originally printed, now e-newletters); created 40 fact sheets;  hosted over 50 field days and workshops, coordinated 3 multi-day manure clinics for producers and professionals; written over 200 popular press articles,  supported and developed material for nearly 600 Extension meetings;  and developed 9 video presentations. 

What Have We Learned?

The biggest lesson learned from this educational outreach program was and is the success  of integrating the state agency, land-grant university and livestock commodity group message to assist livestock producers.  This partnership allowed the development of  a consistent message among all involved when it came to manure management so producers and their technical staff were using the same recommendations and planning processes across all programs.  Other important things learned include  1) longevity of programs are crucial to producer awareness and success; 2) a defined mechanism for intergrating research into extension programming is crucial for producers to make informed choices related to best management practices; 3) leveraging financial support to serve all clients helps level the playing field in terms of client access to educational materials, events and access to technical assistance and 4) when provided with appropriate training and resource materials, it is possible to develop an entire service industry to assist producers with manure nutrient management planning.

Future Plans

Many internal discussions have identified the need to continue to support this effort even with the availability of other national programs that serve as clearinghouses for manure management information.  Future needs for program implementation  include coordinating long-term financial support for continued programming and a needs assessment that is relevant to current production practices.  Future needs for program delivery include more field days and hands-on type experiences for producers and their service providers. 

Authors

Angela Rieck-Hinz, Extension Program Specialist, Iowa State University, amrieck@iastate.edu

Additional Information

IMMAG Home Page


The authors are solely responsible for the content of these proceedings. The technical information does not necessarily reflect the official position of the sponsoring agencies or institutions represented by planning committee members, and inclusion and distribution herein does not constitute an endorsement of views expressed by the same. Printed materials included herein are not refereed publications. Citations should appear as follows. EXAMPLE: Authors. 2013. Title of presentation. Waste to Worth: Spreading Science and Solutions. Denver, CO. April 1-5, 2013. URL of this page. Accessed on: today’s date.

Pesticide Application Air Quality Emissions Inventory Project

Waste to Worth: Spreading science and solutions logoWaste to Worth home | More proceedings….

Abstract

The Federal Environmental Protection Agency (EPA) requires states to submit to them air quality emission inventories for all types of sources every three years. In 2012, the Central States Air Resource Agencies Association (CenSARA) and its contractor, TranSystems Corporation (TranSystems), developed a 2011 agricultural pesticide emissions inventory for the association’s member states of Arkansas, Iowa, Kansas, Louisiana, Minnesota, Missouri, Nebraska, Oklahoma, and Texas. 

Crops grown in this region total more than 140 million acres and are routinely treated with pesticide products, such as herbicides, insecticides, and fungicides.  Row crops, such as corn, soybeans, and sorghum and non-row crops, such as fruit orchards, were included in the work.  Hazardous air pollutants (HAPs) and/or volatile organic compounds (VOCs) are in pesticide ingredients; VOCs being a main contributor to ground-level ozone, commonly known as smog.  In this work, 458 active ingredient-specific VOC emission factors were developed, based primarily on empirically derived pesticide chemical data maintained by the California Department of Pesticide Regulations; county level active ingredient throughputs were derived from the best available information.

An emissions calculation tool was developed to produce emissions, following a linear crop to acreage relationship as the default. Participating states can use the tool to input local practices such as the selection of crops and/or the choice of pesticide products, as well as the extent and amount of applications. The work also included a survey to try to understand the timeframes pesticides are applied to various crops. These parameters can significantly alter the default linear relationship.  The final product provided the individual states with 2011 emission estimates and a methodology to account for better data when obtained, which can result in a more accurate emission inventory for this source category.

Authors

Theresa Pella, Central States Air Resource Agencies Association tpella@censara.org

Juan A. Maldonado, TranSystems Corporation, jamaldonado@transystems.com, Dr. Chun Yi Wu, Minnesota Pollution Control Agency chun.yi.wu@state.mn.us


The authors are solely responsible for the content of these proceedings. The technical information does not necessarily reflect the official position of the sponsoring agencies or institutions represented by planning committee members, and inclusion and distribution herein does not constitute an endorsement of views expressed by the same. Printed materials included herein are not refereed publications. Citations should appear as follows. EXAMPLE: Authors. 2013. Title of presentation. Waste to Worth: Spreading Science and Solutions. Denver, CO. April 1-5, 2013. URL of this page. Accessed on: today’s date.

What We Feed Dairy Cows Impacts Manure Chemistry and the Environment

Waste to Worth: Spreading science and solutions logoWaste to Worth home | More proceedings….

Why Be Concerned with Feed Rations and Their Environmental Implications?

During the last part of the 20th century, animal manure management became an environmental concern. In response to these concerns, legislation was enacted to control manure management and the emission of undesirable gasses (e.g., methane, ammonia, nitrous oxide) from animal production systems. The purpose of this paper is to illustrate how mineral phosphorus (P) supplements, forage types and amounts, and the crude protein (CP) fed to lactating cows impact manure chemistry and the fate of manure nutrients in the environment.

What Did We Do?

Source-sink relationships have been used to illustrate relationships between feed nutrient sources (e.g., forms and concentrations of P and CP in lactating cows rations) and nutrient sinks (milk and manure), and relationships between manure nutrient sources (e.g., soluble P, urea N) and sinks [soil test P, runoff P, atmospheric ammonia, soil inorganic nitrogen (N), crop N] and the impact of these relationships on the environment.

What Have We Learned?

As mineral P concentrations in dairy rations increase, the excretion of total P and soluble P in manure also increases. The amount of cropland needed to recycle manure P and runoff of soluble P from cropland after manure application can be related back to the P excreted in manure, which in turn can be linked to the amount of mineral P in cow rations.  Likewise, the type and amount of CP and forage fed to dairy cows impact manure chemistry and manure N losses as ammonia, N cycling in soil, including plant N uptake. Ammonia emissions from dairy barns and soil after manure application can be related back to the urea N excreted by dairy cows in urine, which is linked to the types and concentrations of CP and forages in cow rations, and the concentrations of urea in milk (milk urea N, or MUN).  Our results demonstrate that profitable rations can be fed to satisfy the nutritional demands of healthy, high producing dairy cows, reduce manure excretion and therefore the environmental impacts of milk production.

Future Plans

We continue investigations on how the feeding of tannins to lactating dairy cows, and the use of MUN as a management tool  may enhance feed CP use efficiency (more feed CP transformed into milk, less excreted in manure) and reduce losses of ammonia, nitrates and nitrous oxide from dairy farms.

Authors

J. Mark Powell, Soil Scientist. USDA-ARS U.S. Dairy Forage Research Center, Madison, Wisconsin,  mark.powell@ars.usda.gov

Glen A. Broderick,  Dairy Scientist,  USDA-ARS U.S. Dairy Forage Research Center, Madison, Wisconsin

Additional Information

Powell, J.M. and Broderick, G.A. Transdisciplinary soil science research: Impacts of dairy nutrition on manure chemistry and the environment. Soil. Sci. Soc. Am. J. 75:2071–2078.

Powell, J.M. Alteration of Dairy Cattle Diets for Beneficial On-Farm Recycling of Manure Nutrients. pp 21-42  In: Applied Research in Animal Manure Management. Zhongqi H. (Ed.) Nova Science Publ. Inc.

Powell, J.M., Wattiaux, M.A., and Broderick, G.A. Evaluation of milk urea nitrogen as a management tool to reduce ammonia emissions from dairy farms. J. Dairy Sci. 94:4690–4694.


The authors are solely responsible for the content of these proceedings. The technical information does not necessarily reflect the official position of the sponsoring agencies or institutions represented by planning committee members, and inclusion and distribution herein does not constitute an endorsement of views expressed by the same. Printed materials included herein are not refereed publications. Citations should appear as follows. EXAMPLE: Authors. 2013. Title of presentation. Waste to Worth: Spreading Science and Solutions. Denver, CO. April 1-5, 2013. URL of this page. Accessed on: today’s date.