Currently, all the Bay states are working to achieve nutrient reduction goals from various pollution sources. Significant reductions in phosphorus pollution from agriculture, particularly with respect to phosphorus losses from land application of manure are needed to support a healthy aquatic ecosystem. Producers in high-density animal agricultural production areas such as Lancaster County region of Pennsylvania, the Delmarva Peninsula, and the Shenandoah Valley region of Virginia, need viable alternatives to local land application in order to meet nutrient reduction goals.
Field demonstrations will be monitored to determine whether the technologies are environmental beneficial, and economically and technically feasible. Specific measures of performance include: reliability and heat distribution, in-house air quality, avoided propane or electricity use, costs to install and maintain, fertilizer and economic value of ash or biochar produced, air emissions, and fate of poultry litter nutrients. Technology evaluation results will be shared on a clearinghouse website developed in partnership with eXtension.
The Farm Manure to Energy Initiative is also supporting efforts to develop markets for nutrient rich ash and biochar co-products. Field trials using nutrient rich ash and biochar from poultry litter thermochemical processes for fresh market vegetable production are currently underway at Virginia Tech’s Eastern Shore Agricultural Research and Experiment Station.
Purpose
The Farm Manure to Energy Initiative is a collaborative effort to evaluate the technical, environmental, and economic feasibility of farm-scale manure to energy technologies in an effort to expand management and revenue-generating opportunities for excess manure nutrients in concentrated animal production regions of the Chesapeake Bay watershed.
What Did We Do?
The project team went through a comprehensive review process and identified three farm-scale, manure to energy technologies that we think have the potential to generate new revenue streams and provide alternatives to local land application of excess manure nutrients. Installation and performance evaluation of two of these technologies on four host farms in the Chesapeake Bay region are underway. Partners have also completed a survey of financing options for farm-scale technology deployment and published a comprehensive financing resources guide for farmers in the Chesapeake Bay region.
What Have We Learned?
To date, we have not identified any manure to energy technologies that also provide alternatives to local land application of excess manure nutrients for liquid manures. Thermochemical manure to energy technologies using poultry litter as a fuel source seem to show the most promise for offering opportunities to export excess nutrients from phosphorus hotspots in the Chesapeake Bay region. Producing heat for poultry houses is the most readily available energy capture option. We did not identify any vendors with a proven approach to producing electricity via farm-scale, thermochemical manure to energy technologies. With respect to the fate of poultry litter nutrients, preliminary air emissions data indicates that most poultry litter nitrogen (greater than 98%) is converted to non-reactive nitrogen in the thermochemical process. Phosphorus and potash are preserved in the ash or biochar coproducts. Preliminary field trial results indicate that phosphorus in ash and biochar is bioavailable and can be used as a replacement for commercial phosphorus fertilizer, but bioavailability varied according to the thermochemical process.
Future Plans
We are currenty in the process of installing and measuring the performance of farm-scale demonstrations in the Chesapeake Bay region. We are collaborating with the Livestock and Poultry Environmental Learning Center to develop a clearinghouse website for thermochemical farm-scale manure to energy technologies that will be hosted on the eXtension website. Performance data from our projects will be shared on this website, which can also be used as a platform to share information about the performance of other farm-scale, thermochemical technology installations around the U.S. Technical training events using farm demonstrations as an educational platform will be hosted during the later half of the project. Additional field and row crop trials to demonstrate the fertilizer value of the concentrated nutrient coproducts are also planned using ash from farm demonstrations.
Authors
Jane Corson-Lassiter, USDA NRCS, Jane.Lassiter@va.usda.gov; Kristen Hughes Evans, Executive Director, Sustainable Chesapeake
Additional partners in the Farm Manure to Energy Initiative include: Farm Pilot Project Coordination, Inc., University of Maryland Center for Environmental Studies, University of Maryland Environmental Finance Center, Virginia Cooperative Extension, Lancaster County Conservation District, the Virginia Tech Eastern Shore Agricultural Research and Extension Center, National Fish and Wildlife Foundation, Chesapeake Bay Funders Network, Chesapeake Bay Commission, and International Biochar Institute.
Funding for this project is provided by a grant from the USDA Conservation Innovation Grant program, the National Fish and Wildlife Foundation via the U.S. EPA Innovative Nutrient and Sediment Reduction Program, the Chesapeake Bay Funders Network, as well as technology vendors and host farmers participating in the technology demonstrations.
The authors are solely responsible for the content of these proceedings. The technical information does not necessarily reflect the official position of the sponsoring agencies or institutions represented by planning committee members, and inclusion and distribution herein does not constitute an endorsement of views expressed by the same. Printed materials included herein are not refereed publications. Citations should appear as follows. EXAMPLE: Authors. 2013. Title of presentation. Waste to Worth: Spreading Science and Solutions. Denver, CO. April 1-5, 2013. URL of this page. Accessed on: today’s date.
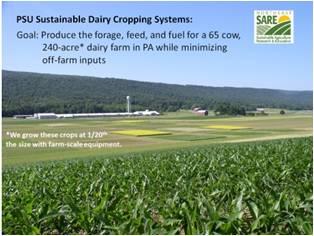
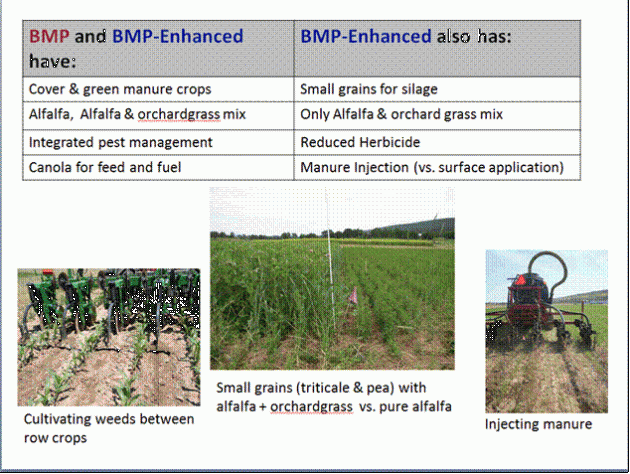
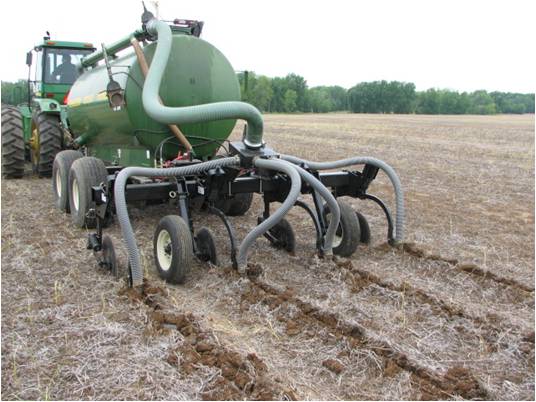
An interdisciplinary team of Penn State and USDA-ARS researchers are evaluating a Sustainable Cropping System to test the hypothesis that a dairy farm can minimize off-farm inputs and environmental impacts, and be productive, profitable and sustainable. Established in 2010 at the Penn State Agronomy Research Farm, the farm produces grain, forage and tractor fuel at 1/20th the scale of an average sized Pennsylvania dairy of 240 acres. The farm includes two diverse 6-yr crop rotations that include manure injection, perennial legumes, cover and green manure crops; a cover crop roller, winter canola, and a straight vegetable oil tractor. Within each crop rotation two management practices for no-till crop production are compared:
1. Forage Rotation compares injected manure (IM) to broadcast manure (BM); and
2. Grain Rotation compares a combination of weed management strategies designed to reduce herbicide (RH) use relative to a “standard” herbicide (SH) weed management program.
The two diverse cropping systems are designed to provide all the forage and feed for 65 lactating cows housed in a tie-stall barn, 10 dry cows and 75 young-stock. Crops are analyzed for crude protein, neutral detergent fiber, and net energy of lactation; the production of a “virtual dairy herd” is simulated using the 2001 NRC dairy nutrition model. Performance of the two farm scenarios (BMSH or IMRH) is compared. Income-over-feed costs are monitored monthly to evaluate impact of forage quality and quantity on profitability. The economic performance of the two cropping systems: BMSH vs. IMRH will be highlighted. In 2010, the IMRH scenario had a slight trend of higher income over feed cost compared to the BMSH scenario. Related: Manure value & economics
Why Is a ‘Systems’ Approach Important for Dairies?
New agronomic management practices and technologies are often evaluated in one or two specific crops for a few growing seasons. Management practices on farms however are integrated into crop rotations, where a combination of practices can have cumulative effects on multiple aspects of the agroecosystem. This project takes an interdisciplinary approach to develop sustainable dairy cropping systems and monitor multiple indicators of systems performance. Utilizing ecological principles and innovative practices, we designed two six-year dairy crop rotations to minimize off-farm inputs and environmental impacts for a typical-sized Pennsylvania dairy farm. Within each rotation we have been comparing innovative manure or weed management strategies, as well as evaluating two green manure crops, and a tactic to sustain mycorrhizae populations in canola. The two crop rotations also compare two approaches to integrating winter canola into a dairy crop rotation.
What Did We Do?
Two cropping systems were developed to compare diverse strategies that include canola in a dairy farm rotation. The two rotations consist of 12 crop entries, each main plot being 90’ x 121’with split plots of 45’ x 121’.
Agronomy farm at Penn State University where the cropping systems are being evaluated.
The splits within the two cropping system rotations are:
Forage rotation: Corn silage/winter wheat underseeded red clover – Corn silage – canola – alfalfa (3 yr)Split plots in the forage rotation compare the use of manure shallow disk injection versus surface-applied, broadcast manure.
To reduce herbicide use, split plots evaluate a combination of mechanical and cultural weed control practices used to reduce herbicides use (banding herbicides over the crop row, inter-row cultivation, companion cropping annual with alfalfa, and one plowing event).
What Have We Learned?
By assessing the performance of the innovative practices and the dairy cropping systems from a multidisciplinary perspective, over the past three years we have gained an understanding of their performance, as well as agroecosystem interactions, benefits, and trade-offs. Overall the cropping systems and the majority of the innovative practices are providing multiple agroecosystem benefits, although a few practices need to be modified to improve their performance.
In the first three years, both of the sustainable dairy cropping systems (inject manure and reduced herbicide (IMRH) and broadcast manure and standard herbicide (BMSH)) produced almost all of the virtual dairy herd’s feeds and forage, and all of the farm’s tractor fuel needs along with some additional canola oil to sell. The economics of the virtual farm show the purchased feed costs per cow are about half of what they would be on a “typical” dairy operation.
The assumptions made for the virtual dairy farm is that it is a start-up herd with the land and buildings in place. Loans were taken out to purchase animals and to remodel the facilities. This explains why the breakeven income over feed costs is high compared to what is observed on established dairy farms in Pennsylvania. When summarizing the cash flow plans for both scenarios, the IMRH has been trending with more income per cow compared to the BMSH. Even with the high breakeven income over feed costs, the BMSH has averaged about $1.00 and IMRH about $1.85 above breakeven for 2011-2012 on average.
Future Plans
We are still simulating and analyzing the virtual dairy herd production and economic performance and plan to conduct additional advanced economic analyses over the next three years. We will continue to monitor the cropping systems, learn how to improve their performance, and share this information through scientific literature and outreach educational activities and materials.
Authors
Virginia Ishler, Dairy Complex Manager and Nutrient Management Specialist, Penn State University, vishler@psu.edu
Heather Karsten, Associate Professor of Crop Production/Ecology, Penn State University
Glenna Malcolm, Post Doctoral Researcher, Penn State University
Tim Beck, Extension Educator, Penn State University
Funding has been provided NESARE (Northeast Sustainable Agriculture Research and Extension) and collaboration with USDA-ARS.
The authors are solely responsible for the content of these proceedings. The technical information does not necessarily reflect the official position of the sponsoring agencies or institutions represented by planning committee members, and inclusion and distribution herein does not constitute an endorsement of views expressed by the same. Printed materials included herein are not refereed publications. Citations should appear as follows. EXAMPLE: Authors. 2013. Title of presentation. Waste to Worth: Spreading Science and Solutions. Denver, CO. April 1-5, 2013. URL of this page. Accessed on: today’s date.
Why Is It Important for Industry and Regulators to Work Together?
The community in the Yakima Region of Washington State has raised concerns over the potential adverse effects of air emissions from dairy operations. To address these concerns, the Yakima Regional Clean Air Agency (YRCAA) proposed a policy process in October 2010 to control and mitigate emissions through implementation of site-specific best management practices (BMPs) on dairy operations. Absent a lack of reliable methodologies for estimating emissions from dairies, the YRCAA enrolled experts and scientists to help create tools that could be used for estimation of emissions from dairy operations. The assessment of BMPs aimed at mitigating air emissions from dairies was also included to determine their effect on the character, amount, and dispersion of specific air pollutants. This project assessed the effect of voluntary verses policy driven action on the dairy industry, community, and environmental impacts of air emissions from dairy operations.
What Did We Do?
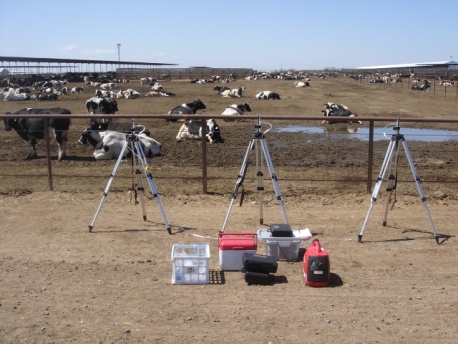
The Yakima Regional Clean Air Agency (YRCAA) proposed a draft policy in October 2010 to control and mitigate emissions through implementation of site-specific best management practices (BMPs) on dairy operations. To validate the policy, a “Pilot Research Project” was launched in February 2011 to gather information for one year to test the feasibility of implementing and determining policy effectiveness. Twelve operations, representing ~40% of the estimated regional cow numbers, volunteered to participate.
A description of proven BMPs and a BMP selection-guide were created to help producers develop site-specific Air Quality Management Plans (AQMP). Each AQMP identified, systematically, specific BMPs to mitigate emissions from each area of the dairy system (nutrition, feed management, milk parlor, housing-drylot, housing-freestall, grazing, manure management, land application, other) based on effectiveness, practicality and economics. The pollutants addressed in each AQMP included ammonia, nitrous oxide, hydrogen sulfide, volatile organic compounds, odor, particulate matter, oxides of nitrogen, and methane. A universal score-sheet was created to assess implementation of BMPs at each dairy. The YRCAA inspectors were trained to evaluate, score, and record BMP implementation. A whole-farm score was generated during each visit, which identified areas of improvement to be addressed.
The process was very unique in that the dairy industry took a proactive role and actively participated. Using science and air quality experts to create and validate the evaluation tools and process also brought authority to the process. The policy was revised based on information collected from the pilot project and was adopted in February 2012. To date, 22 operations, representing 57% of total cow numbers in the Yakima Region, are enrolled.
What Have We Learned?
The voluntary approach used during the pilot project phase of the policy was very effective in enrolling the dairy community. Producers stepped up to volunteer and cooperatively participate in an unknown process. Even though they were very robust and integrated a large amount of scientific information, the emission assessment tools created as an outcome of the pilot project were very user friendly and easy to interpret by planners and producers. The air quality BMP assessment tool is currently being evaluated for use by other agencies and institutions.
Future Plans
The YRCAA has entered into phase two of the policy process and are now mandating that dairies participate in the air quality assessment. Starting in March 2013, all dairy operations in the Yakima basin will be either voluntarily or mandatorily inspected and assessed for air quality improvements. This provides an opportunity to compare voluntary and mandatory policy processes. The long-term impact of the process is yet unknown.
The authors are solely responsible for the content of these proceedings. The technical information does not necessarily reflect the official position of the sponsoring agencies or institutions represented by planning committee members, and inclusion and distribution herein does not constitute an endorsement of views expressed by the same. Printed materials included herein are not refereed publications. Citations should appear as follows. EXAMPLE: Authors. 2013. Title of presentation. Waste to Worth: Spreading Science and Solutions. Denver, CO. April 1-5, 2013. URL of this page. Accessed on: today’s date.
In an effort to assess the off-site transport of bioaerosols, airborne bacteria, fungi, and endotoxin were collected at a 10,000 cow dairy operation. Compared to background locations, the general trend was that bioaerosol concentrations were higher immediately downwind, then decreased with distance from the animal housing. While bioaerosol concentrations did not follow a seasonal trend, they did significantly correlate with meteorological factors such as temperature and solar radiation. Bioaerosol concentrations were also found to be greatest at night, which can be attributed to changes in animal activity and wind speed and reduced exposure of the microorganisms to UV radiation. An analysis of clones generated from air samples collected downwind from the animal housing and pivots spraying dairy wastewater revealed that none of sequence matches were affiliated with bacteria known to be pathogenic to otherwise healthy humans. Results from ongoing research to better understand bioaerosol formation and drift losses during spray irrigation events of dairy wastewater will also be discussed.
Using glass impingers to capture airborne bacteria at a downwind location from a dairy.
Why Study Bioaerosols at Dairies?
Because confinement of cattle increases the microbioal load at dairy production facilities, there are concerns about on-site and off-site exposures to airborne microorganisms and microbial byproducts. The purpose of this study was to monitor concentrations of airborne bacteria, fungi, and endotoxin at a 10,000 cow open-freestall dairy and fields being irrigated with wastewater to assess their potential to be transported off site. This information is important, as inhalation or ingestion of some bioaerosols can be detrimental to health through infection, allergy, or toxicosis.
Open-face filters for capture of airborne endotoxin.
What Did We Do?
Over a one-year period at the dairy, bioaerosols were collected at upwind (background) and downwind sites using glass impingers, direct impaction on media, and a wetted-wall cyclone. Bacteria and fungi were quantified using culture-dependent techniques, while bacteria were also characterized to the genus and species levels by analyzing a region of the 16S ribosomal RNA gene. Airborne endotoxin were captured on filters, then extracted and subsequenetly quantified using the Limulus amebocyte lysate assay.
Wetted-wall cyclone being used to capture bioaerosols for subsequent identification using PCR-based approach.
What Have We Learned?
Compared to background sites, the general trend was that concentrations of airborne bacteria and endotoxin were higher immediately downwind, then decreased with distance from the animal housing. While bioaerosol concentrations did not follow a seasonal trend, they did significantly correlate with meteorological factors such as temperature, wind speed, and solar radiation. Bacteria and endotoxin concentrations were also found to be greatest at night, which can be attributed to changes in animal activity and wind speed and reduced exposure of the microorganisms to UV radiation. Analysis of cloned 16S rRNA genes generated from air samples collected downwind from the animal housing and pivots spraying dairy wastewater revealed that none of sequences were affiliated with bacteria known to be pathogenic to healthy humans.
Future Plans
Conduct a quantitative microbial risk assessment for zoonotic bacterial pathogens in dairy wastewaters that are land applied using center pivot irrigation systems.
Authors
Robert Dungan, Research Microbiologist, USDA-ARS Northwest Irrigation & Soils Research Laboratory, Kimberly, Idaho, robert.dungan@ars.usda.gov
April Leytem, Soil Chemist, USDA-ARS, Kimberly, Idaho
David Bjorenberg, Agricultural Engineer, USDA-ARS, Kimberly, Idaho
Additional Information
Dungan, R.S. and A.B. Leytem. 2009. Airborne endotoxin concentrations at a large open-lot dairy in southern Idaho. J. Environ. Qual. 38:1919-1923.
Dungan, R.S., A.B. Leytem, and D.L. Bjorneberg. 2010. Year-long assessment of airborne endotoxin at a concentrated dairy operation. Aerobiologia. 26:141-148.
Dungan, R.S., A.B. Leytem, S.A. Verwey, and D.L. Bjorneberg. 2010. Assessment of bioaerosols at a concentrated dairy operation. Aerobiologia. 26:171-184.
Dungan, R.S. and A.B. Leytem. 2011. Ambient endotoxin concentrations and assessment of transport at an open-lot and open-freestall dairy. J. Environ. Qual. 40:462-467.
Dungan, R.S., A.B. Leytem, and D.L. Bjorneberg. 2011. Concentrations of airborne endotoxin and microorganisms at a 10,000 cow open-freestall dairy. J. Anim. Sci. 176:426-434.
Dungan, R.S. 2012. Use of a culture-independent approach to characterize aerosolized bacteria at an open-freestall dairy operation. Environ. Int. 41:8-14.
Acknowledgements
Independent Dairy Environmental Action League (IDEAL)
The authors are solely responsible for the content of these proceedings. The technical information does not necessarily reflect the official position of the sponsoring agencies or institutions represented by planning committee members, and inclusion and distribution herein does not constitute an endorsement of views expressed by the same. Printed materials included herein are not refereed publications. Citations should appear as follows. EXAMPLE: Authors. 2013. Title of presentation. Waste to Worth: Spreading Science and Solutions. Denver, CO. April 1-5, 2013. URL of this page. Accessed on: today’s date.
Soil microbial communities have been proposed as indicators of soil quality due to their importance as drivers of global biogeochemical cycles and their sensitivity to management and climatic conditions. Despite the importance of the soil microbiota to nutrient transformation and chemical cycling, physio-chemical properties rather than biological properties of soils are traditionally used as measures of environmental status. In general, much is unknown regarding the effect of management fluctuations on important functional groups in soils systems (i.e., methanogens, nitrifiers and denitrifiers). It is only recently that it has been possible, through application of sophisticated molecular microbiological methods, to sensitively and specifically target important microbial populations that contribute to nutrient cycling and plant health present at the field-scale and in differentially managed soil systems.
Fig. 1. Swine slurry surface application.
In this study, quantitative, real-time PCR (qPCR) was used to quantify changes in denitrifiers (narG) and methanogens (mcrA) in agricultural soils with three different swine effluent application methods including surface application, direct injection, and application in combination with soil aeration. Results show that concentrations of bacteria were high in all treatments (2.9 ± 1.4 X 10⁹ cells per gram of soil); about 25% higher than in controls with no slurry added. Concentrations of methanogens and denitrifiers were slightly higher (around 50%) when slurry was applied by injection or aeration (5.3 ± 2.4 X 10⁷ cells and 2.8 ± 1.8 X 10⁷ cells per gram of soil, respectively) as compared to no till (2.4 ± 1.6 X 10⁷ cells and 1.6 ± 1.0 X 10⁷ cells per gram of soil, respectively).
These results suggest that application method has little influence on concentrations of functional groups of microorganisms. These results will be discussed in light of results of GHG sampling conducted during the same study.
Fig. 2. Swine slurry application by direct injection.
Why Study Greenhouse Gases and the Manure-Soil Interaction?
Although agricultural production has been identified as a significant source of green house gas (GHG) emissions, relatively little scientific research has been conducted to determine how manure management strategies effect GHG production upon land application. Even fewer studies have taken into consideration the microorganisms associated with applied manures. Microbial communities are responsible for nutrient transformation and chemical cycling in soil systems and many important functional groups (i.e., methanogens, nitrifiers and denitrifiers) are extremely sensitive to environmental management and climate conditions. The goal of this study was to evaluate how swine slurry land application methods effect microbial communities associated with nitrogen cycling and GHG production.
Fig. 3. Swine slurry application in combination with soil aeration.
What Did We Do?
We used molecular microbial methods to quantify changes in nitrifiers (amoA), denitrifiers (nirK, nosZ and narG) and methanogens (mcrA) in agricultural soils receiving swine slurry applied by (A) surface application (Fig. 1) (B) direct injection (Fig. 2) or (C) application in combination with soil aeration (Fig. 3). Soil samples were taken from triplicate plots 13 days after effluent application.
Above – Fig. 4. Concentration of methanogens (mcrA) and nitrate reducing bacteria (narG) as measured by quantitative, real-time PCR analysis of targeted genes (in parentheses). Swine slurry was applied by three methods surface, direct injection (Inj) or in combination with aeration (Aer). Chemical fertilizer (Fert) and plots with no fertilizer (Control) were also included. Initial slurry was removed before application. Cells in soils from plots with surface applied slurry were sampled at two depths (1.3 cm and 5.1 cm). Error bars represent the standard deviation of triplicate plot samples.
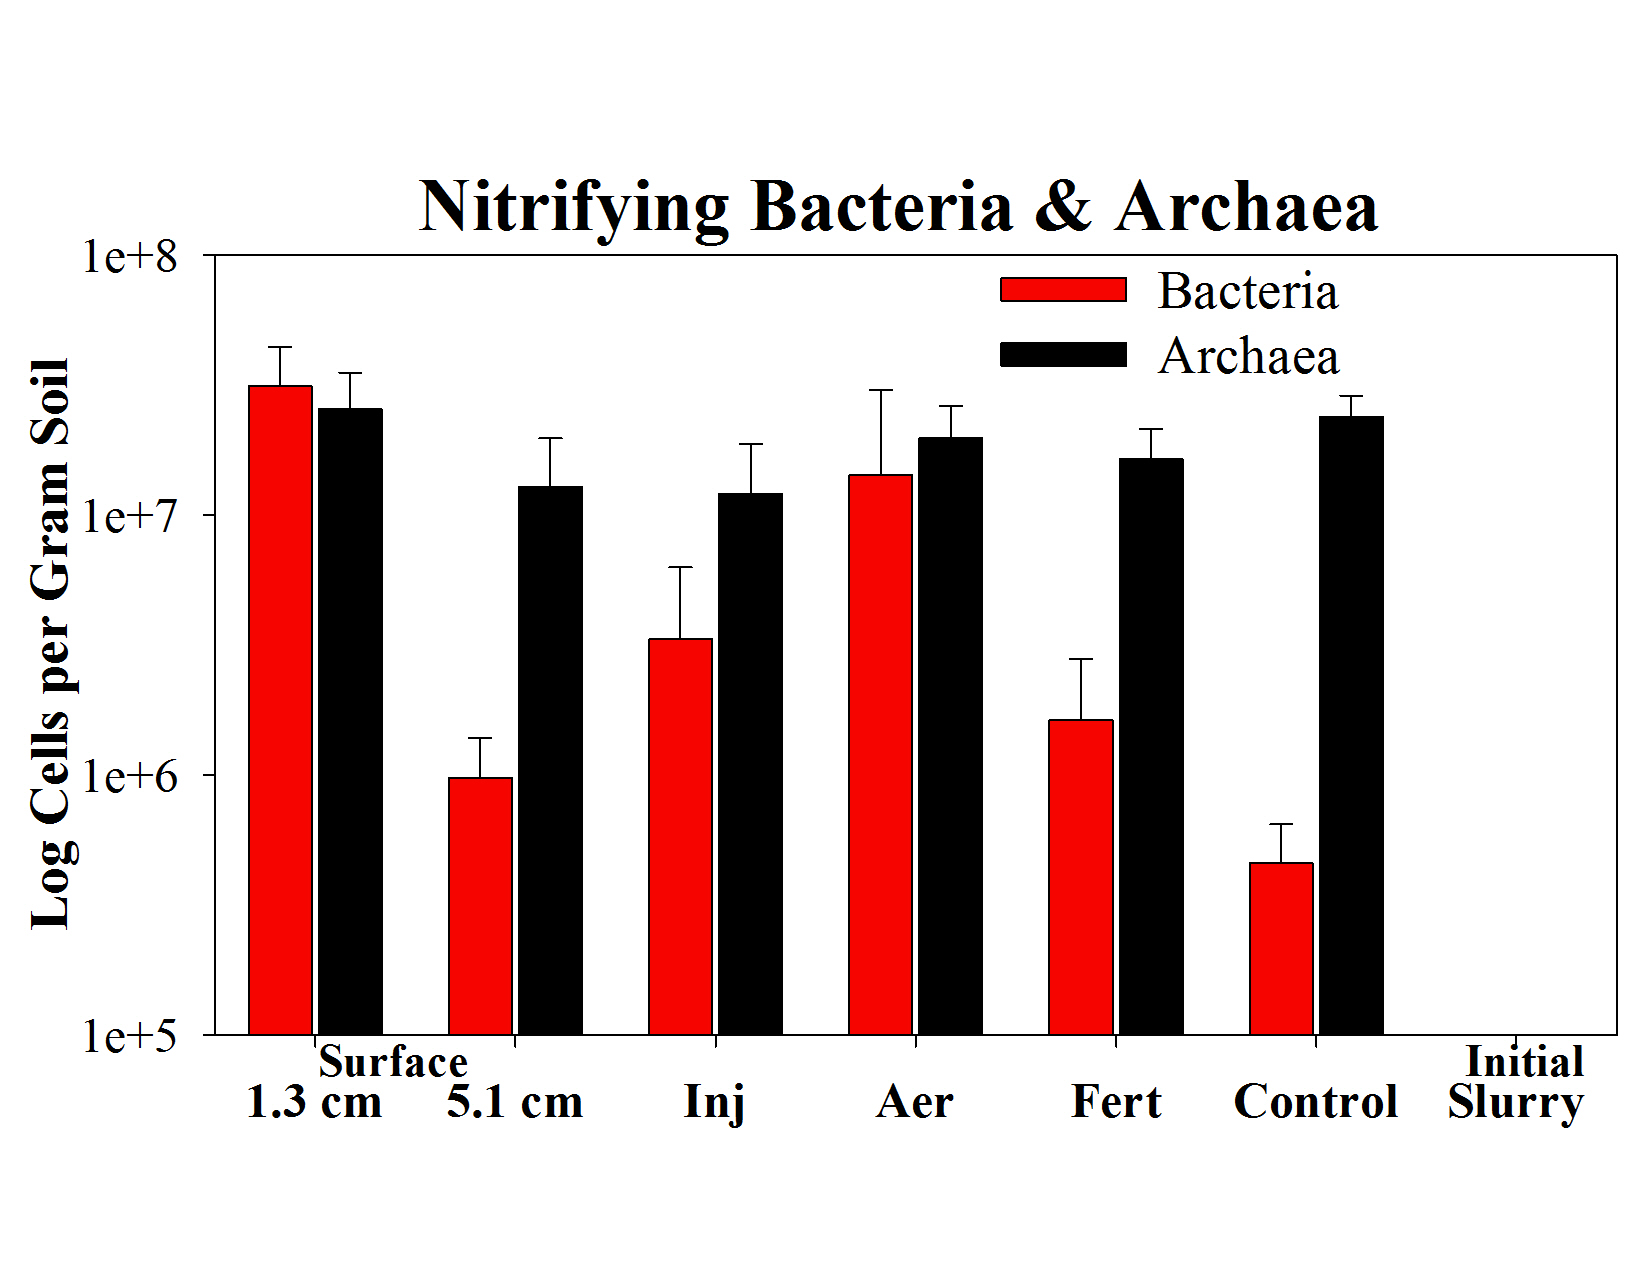
Below – Fig. 5. Concentration of nitrifying bacteria or archaea as measured by quantitative, real-time PCR analysis of the amoA specific for each group. Swine slurry was applied by three methods surface, direct injection (Inj) or in combination with aeration (Aer). Chemical fertilizer (Fert) and plots with no fertilizer (Control) were also included. Initial slurry was removed before application. Cells in soils from plots with surface applied slurry were sampled at two depths (1.3 cm and 5.1 cm). Error bars represent the standard deviation of triplicate plot samples.
What Have We Learned?
Sampling cell concentrations at different soil depths (1.3 cm or 5 cm) from plots with surface applied slurry significantly influenced results (Fig. 4, Fig. 5 and Fig 6).
Slurry applied by any method significantly increased (7 logs) concentrations of nitrate reducing bacteria and methanogens (Fig 4). Methanogens were present in the slurry while nitrate reducers were not measurable in slurry or control plots.
Nitrifying bacteria significantly increased in concentration after slurry addition (i.e. 7, 31, 2 and 68 times higher than control plots for slurry applied by injection, aeration or surface application (1.3 cm and 5 cm), respectively); concentrations of nitrifying archaea did not change from initial levels after slurry addition (Fig. 5).
Concentrations of bacteria, fungi and denitrifiers on plots with slurry applied were two to nine times higher than concentrations in controls with no slurry (Fig. 6).
Future Plans
Findings from this study underscore the importance of measuring both microbial populations and gas production when evaluating the impact of manure application on emissions. Emission data provided important information about the kind and rate of GHG emissions (see reference below for details; Sistani et al (2011) Soil Sci. America J. 74(2): 429-435). However, microbial analyses showed that select groups of nitrifiers and denitrifiers (but not all groups) were affected by manure application. Findings from microbial analyses will be the basis for development of future studies to target and manipulate specific microbial populations in ways that inhibit their ability to produce GHG.
Fig. 6. Change in concentration of targeted population in each treatment relative to that in the control with no slurry or fertilizer added. Concentrations of bacteria (16S RNA gene), fungi (18S RNA gene), nitrite reducing bacteria (nirK) or nitrous oxide reducing bacteria (nosZ) were measured by quantitative, real-time PCR analysis of targeted genes (in parentheses). Swine slurry was applied by three methods surface, direct injection (Inj) or in combination with aeration (Aer). Chemical fertilizer (Fert) and plots with no fertilizer (Control) were also included. Initial slurry was removed before application. Cells in soils from plots with surface applied slurry were sampled at two depths (1.3 cm and 5.1 cm). Error bars represent the standard deviation of triplicate plot samples.
Authors
Dr. Kimberly Cook, Research Microbiologist, USDA Agricultural Research Service, kim.cook@ars.usda.gov
Dr. Karamat Sistani, Research Soil Scientist, USDA Agricultural Research Service
Sistani, K.R., Warren, J.G., Lovanh, N.C., Higgins, S., Shearer, S. 2010. Green House Gas Emissions from Swine Effluent Applied to Soil by Different Methods. Soil Sci. America J. 74(2): 429-435.
Acknowledgements
We would like to thank Jason Simmons and Rohan Parekh for valuable technical assistance. This research is part of USDA-ARS National Program 214: Agricultural and Industrial By-products
The authors are solely responsible for the content of these proceedings. The technical information does not necessarily reflect the official position of the sponsoring agencies or institutions represented by planning committee members, and inclusion and distribution herein does not constitute an endorsement of views expressed by the same. Printed materials included herein are not refereed publications. Citations should appear as follows. EXAMPLE: Authors. 2013. Title of presentation. Waste to Worth: Spreading Science and Solutions. Denver, CO. April 1-5, 2013. URL of this page. Accessed on: today’s date.
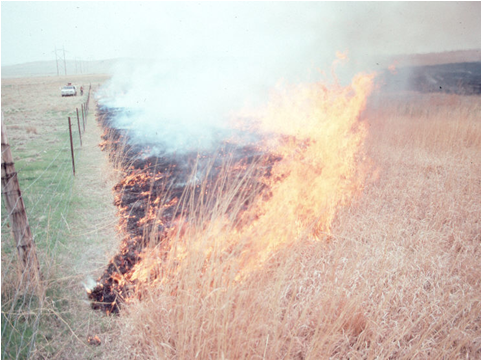
Native Americans placed great value on the four elements of life, earth, water, air and fire. They recognized, as we do today, that fire is the most powerful land management tool. The 4.8 million acre Flint Hills region of Kansas is the largest remaining expanse of tallgrass prairie in North America. Prescribed fire is routinely practiced in the region to enhance livestock forage quality, control invasive species, provide grassland wildlife habitat and improve plant vigor. But where there is fire, there is smoke, and there are public health concerns when excessive smoke is in the atmosphere. Ground level ozone can have serious public health consequences and major cities adjacent to the Flint Hills, have recorded excessive ozone levels resulting from Flint Hills prescribed fire. A collaborative effort including the Kansas Dept of Health & Environment, EPA, K-State Research & Extension, Kansas Livestock Association and other groups completed the Flint Hills smoke management plan in December, 2010, with the objective of reducing health concerns from prescribed fire, while retaining it as a land management tool. The plan established a website of “best smoke management practices” and a comprehensive education and outreach effort for land managers was implemented, involving prescribed fire schools, news articles and radio airplay. Results of the plan are positive, indicating that Kansas has responded to the smoke issue appropriately and will retain prescribed fire as a management practice that maintains both the tallgrass prairie of the hills, and the air quality of adjacent metro areas. The inter-relationships of earth, water, air and fire are continual, each impacting the other. The Kansas Flint Hills now has a plan to ensure harmony of these essential elements of life.
A prescribed fire in the Kansas Flint Hills
Prescribed Fire in Tallgrass Prairie
The Flint Hills Smoke Management Plan is a collaborative effort designed to maintain the benefit of prescribed fire on the private grasslands of the Flint Hills, while also protecting the air quality of ajor metropolitan areas such as Kansas City and Wichita. The Flint Hills have particular environmental implications, as they are the largest expanse of tallgrass prairie remaining in North America.
Kansas Department of Health and Environment wrote the plan, but embraced those involved with the issue, including K-State Research and Extension, the KS Livestock Association, Farm Bureau, Tallgrass Legacy Alliance, KS Prescribed Fire Council, Cities of Wichita and Kansas City, Natural Resource Conservation Service, KS Dept. of Wildlife Parks & Tourism to develop a plan that would address the goals of all those involved. A website was developed to give ranchers day by day information regarding smoke emission and direction from a prescribed fire that day or the following day.
What Have We Learned?
Those that practice prescribed fire in the Kansas Flint Hills respect the health and environment of their city neighbors. Conversely, those living in neighboring metropolitan areas understand the economic importance of prescribed fire as related to beef cattle production, and the role fire plays in preserving the integrity of the tallgrass prairie. By engaging all entities involved, agreements can be reached, solutions can be found and advancements can be made.
Prescribed fire controls woody species, maintaining the integrity of the tallgrass prairie.
Future Plans
In the years ahead, KS Dept of Health and Environment will continue monitoring smoke emissions due to prescribed fire in the Flint Hills. Those practicing prescribed fire will be encouraged to use the best smoke management methods of prescribed fire. This will be done through K-State Research & Extension prescribed fire schools, the KS Prescribed Fire Council workshops and the KDHE website.
Authors
Jeff Davidson K-State Research & Extension Watershed Specialist Kansas State University jdavidso@ksu.edu
K-State Research & Extension, Kansas Precribed Fire Council, Kansas Livestock Association, KS Dept. of Health & Environment, Tallgrass Legacy Alliance, KS Dept. of Wildlife, Parks & Tourism, Natural Resource Conservation Service, Farm Bureau, Cities of Wichita and Kansas City.
The authors are solely responsible for the content of these proceedings. The technical information does not necessarily reflect the official position of the sponsoring agencies or institutions represented by planning committee members, and inclusion and distribution herein does not constitute an endorsement of views expressed by the same. Printed materials included herein are not refereed publications. Citations should appear as follows. EXAMPLE: Authors. 2013. Title of presentation. Waste to Worth: Spreading Science and Solutions. Denver, CO. April 1-5, 2013. URL of this page. Accessed on: today’s date.
Why Study Air Emissions from Mono-slope Beef Barns?
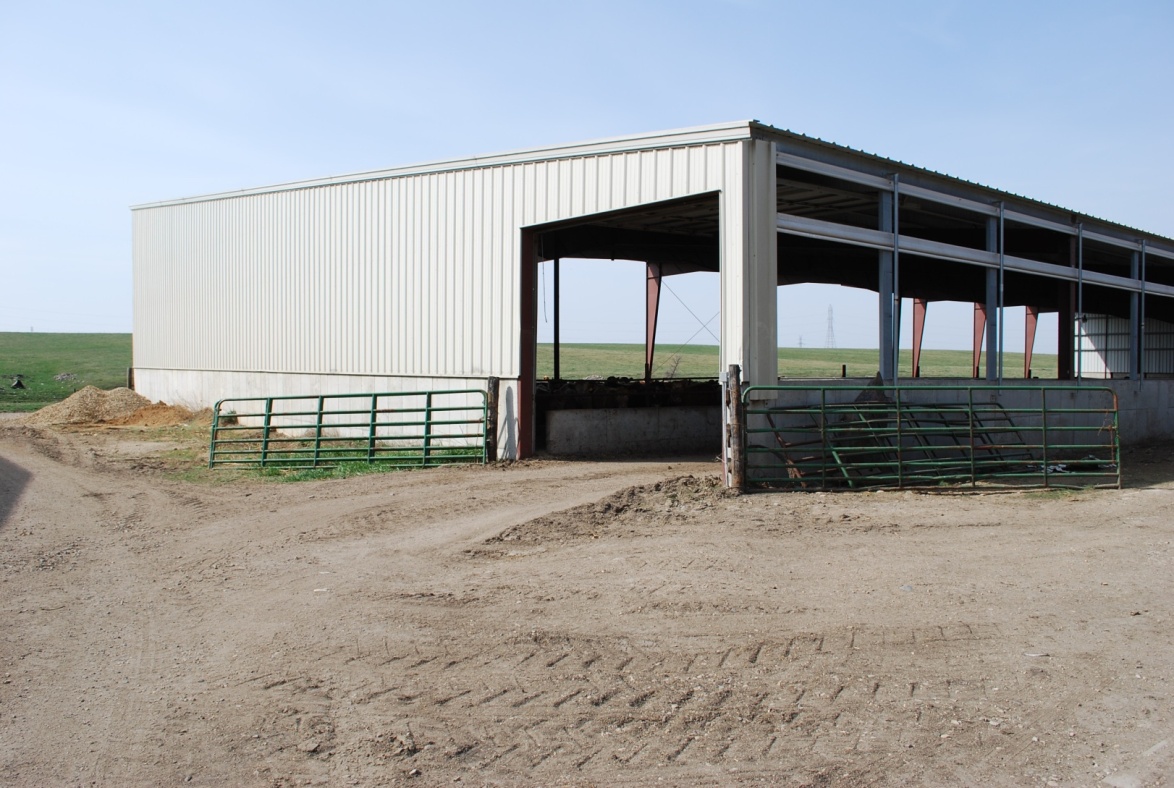
Mono-slope buildings (Figure 1) are one type of roofed and confined cattle feeding facility that is becoming increasingly popular in the Northern Great Plains. However, little is known about the impact of these housing systems and associated manure management methods on the air quality inside and outside the barn. The objective of this study was to determine gas concentrations in mono-slope beef cattle facilities and relate these concentrations to environmental and manure management factors.
Figure 1. View of a monoslope cattle facility from the northeast. Adjustable curtains in the rear (north) wall are used to limit airspeed through the barn during colder weather.
What Did We Do?
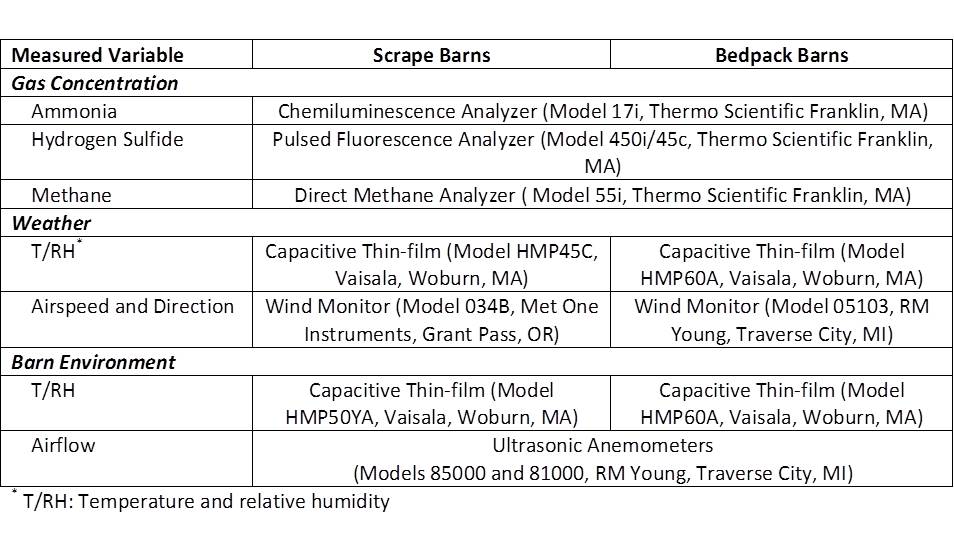
Four producer-owned and operated beef deep-bedded mono-slope facilities were selected for monitoring. Two barns maintained deep-bedded manure packs (Bedpack), whereas two barns scraped manure and bedding from the pens weekly (Scrape). Each site was monitored continuously for one month each quarter for two years to capture both daily and seasonal variations. At each facility, the environment-controlled instrument trailer and associated equipment were located adjacent to the barn. The trailer contained: a gas sampling system (GSS) that consisted of Teflon tube sample lines connected to a computer-controlled sampling manifold, gas analyzers, computer, data acquisition system, calibration gas cylinders, and other supplies. In addition to the sampling lines, there were environmental instruments to measure the airflow and weather conditions for two pens in each barn. The analyzers and sensors used are summarized in Table 1.
Table 1. Analyzers and sensors used for air quality and environmental monitoring
Ammonia, hydrogen sulfide and methane concentrations were sequentially sampled from two south wall locations and three north wall locations per pen. The maximum hourly mean concentrations measured at the north or south wall of either pen in the barn were used in this analysis. The seasonal average hourly means of maximum concentrations and corresponding environmental variables were calculated.
What Have We Learned?
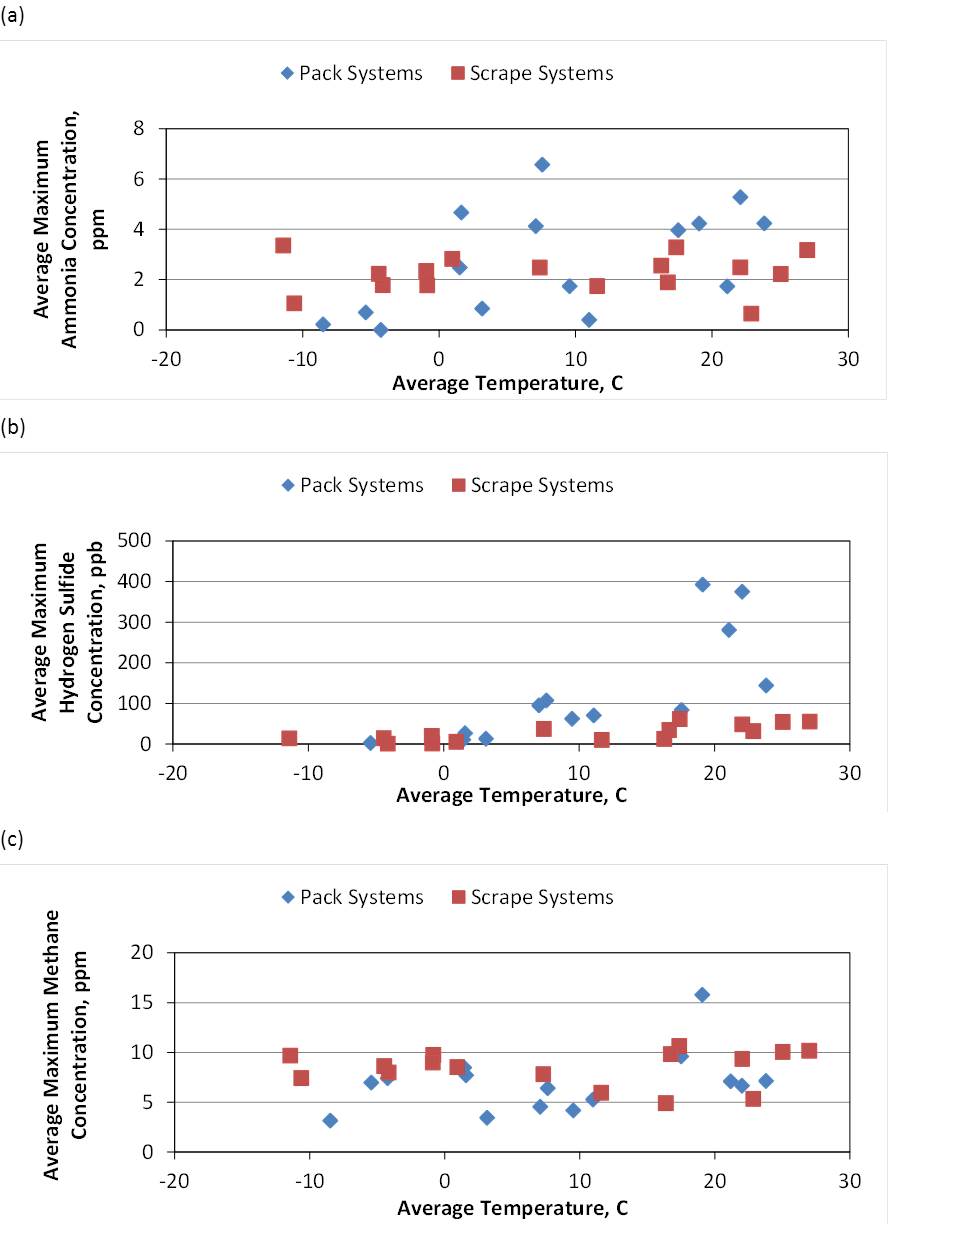
Figure 2. Seasonal averages of maximum hourly mean ammonia (a), hydrogen sulfide (b) and methane (c) concentrations for the bedpack and scrape manure management systems monitored in four monoslope cattle facilities, as influenced by ambient temperature.
The seasonal average hourly maximum ammonia concentration ranged from 0.6 to 3.3 ppm with the Scrape barns and from 0.2 to 7.1 ppm with the Bedpack barns (Fig 2a). The range of maximum hydrogen sulfide concentrations was 0 to 61 ppb in the Scrape barns and 0 to 392 ppb in the Bedpack barns (Fig 2b). The maximum methane concentration ranges were 4.9 to 10.6 and 3.1 to 15.8 ppm in the Scrape and Bedpack barns, respectively (Fig 2c). There are indications of differences between gas release rates for bedpack and scrape manure management systems and increased release rates with temperature for ammonia and hydrogen sulfide. Methane concentrations were more consistent between systems and for different temperature conditions.
This project expands the knowledge base of gaseous concentrations from deep-bedded beef barns. This integrated project also provides management techniques that producers can implement to minimize emissions, and improve air quality.
Future Plans
Emission values will be calculated using these concentration data, in conjunction with airflow data, which also varies with site and temperature conditions.
Project funded by Agriculture and Food Research Initiative Competitive Grant no. 2010-85112-20510 from the USDA National Institute of Food and Agriculture. Technical assistance provided by Alan Kruger, John Holman, Todd Boman, and Bryan Woodbury.
The authors are solely responsible for the content of these proceedings. The technical information does not necessarily reflect the official position of the sponsoring agencies or institutions represented by planning committee members, and inclusion and distribution herein does not constitute an endorsement of views expressed by the same. Printed materials included herein are not refereed publications. Citations should appear as follows. EXAMPLE: Authors. 2013. Title of presentation. Waste to Worth: Spreading Science and Solutions. Denver, CO. April 1-5, 2013. URL of this page. Accessed on: today’s date.
A number of the manure related Conservation Innovation Grants (CIG) have been successful. Several feed management related projects have been major successes under the CIG program. Other successful projects have dealt with such technologies as anaerobic digesters; community digesters; environmental credit trading; lagoon management; manure to energy generation; alternative litter sources, storage, and handling; and pathogen, odor, and emissions mitigation, to name just a few.
The presentation will provide specific numbers of projects and funding per year, and information about actual projects that NRCS considers to have been successful.
What Is the Purpose of the CIG Grant Program?
Glenn Carpenter came to Natural Resources Conservation Service as a Senior Economist in December of 2001 with the Animal Husbandry and Clean Water Division. In May, 2004 he became the agency’s National Leader for Animal Husbandry, with that Division. In 2010 his position was moved to the Ecological Sciences Division. Much of his work with NRCS has been related to the animal waste issue and the agency’s interaction with EPA over the CAFO Rule.
Glenn has three degrees in Poultry Science from Michigan State University. Prior to joining NRCS, Glenn served in Extension Poultry positions at two universities.
The 2002 Farm Bill created a mechanism under the Environmental Quality Incentives Program (EQIP) for a program of Conservation Innovation Grants (CIG). These grants were “…intended to stimulate innovative approaches to leveraging Federal investment in environmental enhancement and protection, in conjunction with agricultural production…” The grants were to provide a mechanism for funding projects to aid in technology development and transfer. The granting program actually began in 2004, and has continued since that time.
What Did We Do?
By statute, the USDA Natural Resources Conservation Service cannot do research. Because of this, and because the interest of NRCS lies in directly assisting farmers and ranchers in the adoption of technologies that will benefit conservation, projects funded under this program must be in the field demonstration or tool application stages. Since the initial grant funding cycle in 2004, NRCS has provided funding through EQIP every year. To date nearly 500 grants have been awarded, with total funding in excess of $180 million.
A large share of these CIGs has been strongly animal, and/or manure related. Almost 25 percent of the total number of grants has been animal related, and these grants have received slightly over 26 percent of the total dollars. About 19 percent of the total grants have been manure related and these have received about 22 percent of the funding. Those animal related grants that are not manure related largely deal with range and pasture systems.
What Have We Learned?
Several feed management related projects have been major successes under the CIG program. Other successful projects have dealt with such technologies as anaerobic digesters; community digesters; environmental credit trading; lagoon management; manure-to-energy generation; alternative litter sources, litter storage, and handling; and pathogen, odor, and emissions mitigation from manure, to name just a few.
The number and variety of funded projects has covered a wide range of geographic areas and technical innovations. A multistate feed management project resulted in training programs, a tech note for NRCS, and many fact sheets and other materials that are available on Livestock and Poultry Environmental Learning Center webpage. Another major grant demonstrated the effectiveness of filter strips and other vegetated treatment areas on mitigating manure runoff from cattle feedlots. Utilizing high pressure injection of manure, a Pennsylvania project demonstrated a decrease in odor and runoff while also preserving nitrogen. Several projects have successfully demonstrated the effects of precision feeding of dairy cattle to show the change in manure nutrients. Projects have demonstrated the effectiveness of different tillage systems and technologies on manure nutrient runoff. Other projects have dealt with innovative waste-to-energy technologies, or waste to value-added-product creation. These are just a few of the number and variety of projects funded through the Conservation Innovation Grants program.
Future Plans
The success of the CIG program since 2004, both in numbers of projects and in innovative technologies and tools applied, demonstrates that the program is important to agriculture in the U.S. NRCS has shown its support by continually funding the program, and by making additional moneys available for special targeted CIGinitiatives.
Authors
Glenn H. Carpenter, National Leader, Animal Husbandry, USDA Natural Resources Conservation Service glenn.carpenter@wdc.usda.gov
United States Department of Agriculture, Natural Resources Conservation Service, Conservation Innovation Grants Program
The authors are solely responsible for the content of these proceedings. The technical information does not necessarily reflect the official position of the sponsoring agencies or institutions represented by planning committee members, and inclusion and distribution herein does not constitute an endorsement of views expressed by the same. Printed materials included herein are not refereed publications. Citations should appear as follows. EXAMPLE: Authors. 2013. Title of presentation. Waste to Worth: Spreading Science and Solutions. Denver, CO. April 1-5, 2013. URL of this page. Accessed on: today’s date.
* Presentation slides are available at the bottom of the page.
Ammonia and odor emissions from land application of liquid dairy manure, and costs associated with manure land application methods are serious concerns for dairy owners, regulators, academic, and the general public. Odor and ammonia samples from agricultural fields receiving liquid dairy manure applied by surface broadcast and subsurface injection methods were collected and analyzed. Costs associated with both of the manure application methods were estimated. The test results showed that subsurface injection reduced both the odor and ammonia emissions compared with surface broadcast; therefore, applying liquid dairy manure by subsurface injection could be recommended as one of the best management practices to control ammonia and odor emissions. The estimated costs associated with subsurface injection were higher than surface broadcast. However the higher costs could be partially compensated by the higher nitrogen fertilizer value captured in the soil by the deep injection method.
Why Study Air Emissions from Dairy Farms?
A floating self-propelled mixing pump and a remote controller (yellow)
Agriculture is the single most important economic sector in Idaho. Dairy production currently stands as the single largest agricultural pursuit in Idaho. Currently, Idaho ranks as the third largest milk production state in the US. Idaho has roughly 550 dairy operations with 580,000 milk cows. Over 70% of milk cows are located in the Magic Valley in southern Idaho (Idaho Department of Agriculture-Bureau of Dairying, 1/22/2013). A number of dairies in the Magic Valley use flushing systems resulting in huge amount of lagoon water which is applied to crop lands near the lagoons via irrigation systems during the crop growing seasons. The volatilization of ammonia (NH3) from the irrigated lands and lagoons is not only a loss of valuable nitrogen (N), but also causes air pollution. Concentrated dairy production in a limited area such as the Magic Valley has caused air and water quality concerns. Controlling odor and capturing N in dairy manure are big challenges facing the southern Idaho dairy industry.
Direct injection incorporates manure directly beneath the soil surface and thus minimizes odor and NH3 emissions during application. Injecting manure decreases soluble phosphorus (P) and N in runoff relative to surface application. Some common types of direct injection applications are liquid tankers with injectors and drag-hose systems with injectors. Manure can be successfully injected in both conventional tillage and non-till systems with currently available equipment. The manure direct injection has been proven in other regions, such as the Midwest, to effectively manage odors and manure nutrients. The purpose of this research was to demonstrate, evaluate, and encourage the widespread adoption of the manure direct injection method in southern Idaho for mitigating odors and managing manure nutrients.
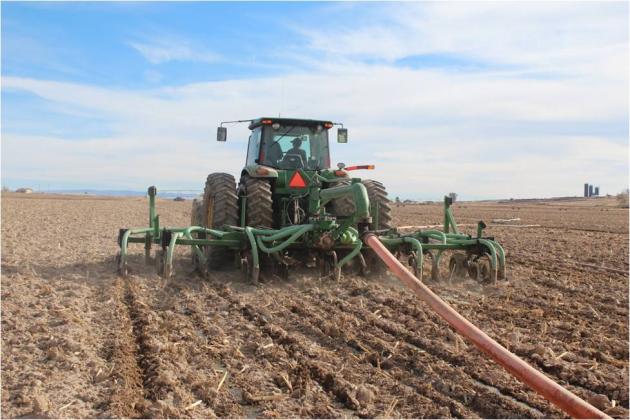
Subsurface injection with drag hose system
What Did We Do?
A manure application field day was held on October 31, 2012 on a dairy in Buhl, Idaho, to demonstrate and evaluate dairy manure land application via a drag-hose system and manure mixing equipment. The dairy had approximately 3,500 milking cows managed in a free-stall and open-lot mix set-up, with about 60% of the cows housed in free stalls. Waste is flushed from lanes running under the feeding alleys and from the milking parlor. The wastewater passes through solids removal equipment and basins and then into three lagoons in series. Manure used for this demonstration study was from the last lagoon, which had about 9 million gallons of manure at the beginning of the demonstration field day and its sludge had been not cleaned for 5 years.
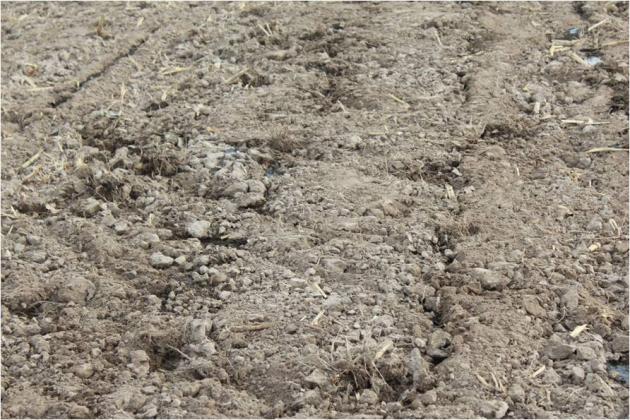
Soil after manure subsurface injection
The on-farm manure application trials conducted at two sites were comprised of two manure application methods: surface broadcast and subsurface injection. At each of the sites, a square plot of approximately 3,600 m2 in the western portion of the site was used for surface broadcast and the rest of the land was used for subsurface injection. The western portion of the site was chosen because the prevailing winds were from the north during the test period. The previous crop at the two sites was corn; both sites had been disked after harvest.
The manure lagoon was agitated before and during application with a floating mixing pump. Manure was pumped from the lagoon directly to the application field via drag hoses. The two manure application methods were demonstrated with the same equipment. Subsurface injection placed manure behind the shank in a band approximately 20 cm (8 inches) deep. Surface broadcast was realized by lifting the shanks above ground so manure was applied on the soil surface. Manure was applied from east to west and back again until the site was finished. The equipment shanks were lifted only when the equipment was in the designated 3,600 m2 square plot for surface application. After manure application in the site, three towers, each 1.5 m high, were placed in a north-to-south orientation with approximately 15 m spacing. The middle tower was placed at the center of the manure surface applied plot. Three towers were placed in the manure subsurface injected field parallel to the ones in the manure surface broadcasted plot and approximately 200 m apart to avoid or minimize cross-contamination between the two manure application methods.
Passive NH3 samplers (Ogawa & Co. USA Inc., Pompano Beach, FL) were installed on each tower at a height of 0.5 and 1 m to determine the NH3 concentration at each location. Ammonia samplers were changed approximately every 24 hours over a two-day period after manure application. Right after collection of NH3 samplers in field, samplers were placed into airtight containers and then shipped back to the U-Idaho Twin Falls Waste Management Laboratory where the NH3 sampler filters were carefully removed from the samplers and transferred into 15-mL centrifuge tubes. Five mL of 1 M KCI was added to each of the centrifuge tubes to extract NH3 trapped in the filters. The extractant was transported to the USDA Northwest Irrigation and Soils Research Laboratory (NWISRL) located in Kimberly, Idaho where it was analyzed for NH4-N using a flow-injection analysis system (Quickchem 8500, Lachat Instruments, Milwaukee, WI). Background concentrations of NH3 were determined by placing three towers 50 m upwind (north) of the site following the same procedure described previously. Concentrations from passive samplers are time-average concentrations for the amount of time the sampler was exposed to the air and were calculated with the following equation:
In this, [NH3-N]air is the concentration of NH3-N in the air, [NH4-N]extractant is the concentration of NH4-N in the extractant, and 31.1 cm3/min is a constant used to calculated diffusion to the trap (Roadman et al., 2003; Leytem et al., 2009). Details regarding the design and calculation of NH3 concentrations can be found in Roadman et al. (2003) and Leytem et al. (2009).
Air samples were collected from the first test site right after manure application using Tedlar bags. One air sample was collected at 1 m above ground from each of the three towers located in the surface broadcast plot, subsurface injection, and background, respectively. A total of nine air samples were collected and then sent via UPS over-night service to Iowa State University Olfactometry Laboratory for odor analysis. The nine air samples were analyzed within 24 hours based on ASTM E679-04 (ASTM, 2004).
For each test site, a grab sample (about 1 L) of liquid manure was collected and transported to a commercial lab (Stukenholtz Laboratory, Inc., located in Twin Falls, Idaho) for pH and total nitrogen analysis. The manure pH, total N, and calculated total N application rates are shown in Table 1. The liquid manure application rate was approximately 20,000 gallons per acre on both the test sites.
Table 1. Manure pH and total N concentrations and application rates of total N at the two test sites
Site and Application Method
Manure pH
Manure total N concentration (mg/L)
Manure total N Application Rate (kg/acre)
Site 1
7.4
3433
257
Site 2
7.3
3519
265
A soil temperature probe with data logger (HOBO U23 Pro v2 2x external temperature data logger-U23-003) was placed 3 cm below the soil surface to record soil temperature data in 15-min increments. Wind speed, temperature, and relative humidity data were obtained from local Buhl Airport, located six miles from the test sites, due to failure of the mobile weather station set on the test sites. The ambient weather conditions and soil temperature at the test sites over the test period are shown in Table 2.
Table 2. Ambient weather conditions and soil temperature at the test sites
Site 1
Site 2
Item
Day 1
Day 2
Day 1
Day 2
Average wind speed, m/s
5.0
4.2
4.2
3.1
Air temperature, average(minimum, maximum),˚F
61 (42, 78)
49 (45, 63)
49 (45, 63)
47 (38, 61)
Average relative humidity, %
28
53
53
51
Soil temperature, average(minimum, maximum), ˚F
50.9 (51.1, 56.1)
47.3 (51.1, 51.2)
46.5 (51.5, 52.1)
66.7 (51.6, 69.1)
Cost analysis was carried out for four different manure land application systems as shown in the “What Have We Learned?” section below. Cost calculations are based on 500 hours annual use for the tractor and 200 hours annual use for the injection system. Tractor operator labor is figured at $11.70/hour, diesel is figured at $4.00/gallon. Equipment costs were determined using the MACHCOST program from the University of Idaho’s department of Agricultural Economics and Rural Sociology. The program is available on the AERS web page at https://www.uidaho.edu/cals/idaho-agbiz/resources/tools. Equipment data was provided by John Smith at Smith Equipment Co. Rupert, ID 83350. Some machinery data was taken from “Costs of Owning and Operating Farm Machinery in the Pacific Northwest” PNW 346 available on line at: https://www.extension.uidaho.edu/publishing/pdf/PNW/PNW0346/PNW0346.html.
What Have We Learned?
Odor results from test site 1
T-test for Odor showed there was no significant difference between the background and subsurface injection (P=0.41), there was significant difference between the background and surface broadcast (P=0.03), and P value was 0.08 for the t-test of mean difference between the subsurface injection and surface broadcast. The field day attendees felt there was significant difference in odor perception between the subsurface injection and surface broadcast methods.
Test site 1
First day ammonia sample results from test site 1.
Second day ammonia sample results from test site 1.
The NH3 concentration data from test site 1 showed significant difference between surface broadcast and subsurface injection based on P<0.05. The NH3 concentration data from test site 1 showed 82% and 64% reduction in NH3 concentration for first and second sampling day, respectively when liquid dairy manure was applied by subsurface injection vs. surface broadcast.
Test site 2
First day ammonia sample results from test site 2.
Second day ammonia sample results from test site 2.
The NH3 concentration data from test site 2 showed significant difference between surface broadcast and subsurface injection based on P<0.05. There were 64% and 41% decrease in NH3 concentration for first and second sampling day, respectively when manure was applied by subsurface injection compared with surface broadcast.
The NH3 concentration data from both the test sites showed lower NH3 concentration in the air from the subsurface injected soil vs. surface applied land which means higher nitrogen fertilizer value captured in the soil by the subsurface injection method.
Cost analysis results:
*Fuel and Lubricant Costs are assigned to the Power Unit.
The above fact sheet summarizes probable costs of operation for a 7,400 gallon tank with a 2,000 gpm discharge rate and a 15 foot wide broadcast unit. A 180 PTO HP tractor is needed to pull this unit at an average ground speed of 8 mph. Up to 10 acres per hour can be covered with the unit. The tank is discharged in approximately 4 minutes. Time and equipment to refill the tank is not included in these calculations.
*Fuel and Lubricant Costs are assigned to the Power Unit.
The above fact sheet summarizes probable costs of operation for a 7,400 gallon tank with a 2,000 gpm discharge rate and a 12 foot wide broadcast unit. A 215 PTO HP tractor is needed to pull this unit at an average ground speed of 7 mph. Up to 7 acres per hour can be covered with the unit. The tank is discharged in approximately 4 minutes. Time and equipment to refill the tank is not included in these calculations.
*Fuel and Lubricant Costs are assigned to the Power Unit.
The above fact sheet summarizes probable costs of operation for a 7,400 gallon tank with a 2,000 gpm discharge rate and a 12 foot wide broadcast unit. A 225 PTO HP tractor is needed to pull this unit at an average ground speed of 7 mph. Up to 7 acres per hour can be covered with the unit. The tank is discharged in approximately 4 minutes. Time and equipment to refill the tank is not included in these calculations.
*Fuel and Lubricant Costs are assigned to the Power Unit.
The above fact sheet summarizes probable costs of operation for a system utilizing 5,280 FT of 8 inch hose and 1,320 FT of 5 inch hose. The pump unit capacity is 1,500 gpm to a 16 foot knife injection unit. A 250 PTO HP tractor is needed for the injection unit operating at 75% field efficiency and at an average ground speed of 3.5 mph. The lagoon pump is a 270 HP unit and operating efficiency assumed at 70%. Beyond 2 miles a booster pump would be necessary. Up to 4.75 acres per hour can be covered with the unit. Operation is continuous as no tank refill is needed.
Based on the estimated costs above, the subsurface injection method has higher costs mainly due to the need of larger tractor and lower operating speed. However, we did not include the time and equipment costs associated with refilling the tank for the tank application system. Due to the short time to discharge the tank on the tank broadcast and tank injection systems additional equipment to refill the tank in a timely fashion would be desirable. This would increase the investment in equipment and also would reduce the number of acres that could be covered per hour due to down time while the tank is refilled.
In summary, subsurface injection can reduce both the odor and NH3 emissions compared with surface broadcast; therefore, applying liquid dairy manure by subsurface injection could be recommended as one of the best management practices to control NH3 and odor emissions. The estimated costs associated with subsurface injection were higher than surface broadcast. However, the higher costs could be partially compensated by the higher nitrogen fertilizer value captured in the soil by the subsurface injection method.
Future Plans
We will finish development of educational videos to demonstrate the manure subsurface injection technique and disseminate results from this study to our stakeholders.
Authors
Lide Chen, Waste Management Engineer and Assistant Professor, Biological and Agricultural Engineering Department, University of Idaho lchen@uidaho.edu
Mario de Haro Marti, Extension Educator
Wilson Gray, District Extension Economist and Extension Professor
Howard Neibling, Extension Irrigation and Water Management Specialist and Associate Professor
Mireille Chahine, Extension Dairy Specialist and Associate Professor
Sai Krishna Reddy Yadanaparthi, Graduate student, University of Idaho
Acknowledgements
This project was supported by the USDA Natural Resource Conservation Service through a Conservation Innovation Grant. We would also like to thank Dr. April Leytem and Mr. Myles Miller (USDA Northwest Irrigation and Soils Research Laboratory (NWISRL) located in Kimberly, Idaho) for their help with analysis of ammonia samples.
The authors are solely responsible for the content of these proceedings. The technical information does not necessarily reflect the official position of the sponsoring agencies or institutions represented by planning committee members, and inclusion and distribution herein does not constitute an endorsement of views expressed by the same. Printed materials included herein are not refereed publications. Citations should appear as follows. EXAMPLE: Authors. 2013. Title of presentation. Waste to Worth: Spreading Science and Solutions. Denver, CO. April 1-5, 2013. URL of this page. Accessed on: today’s date.
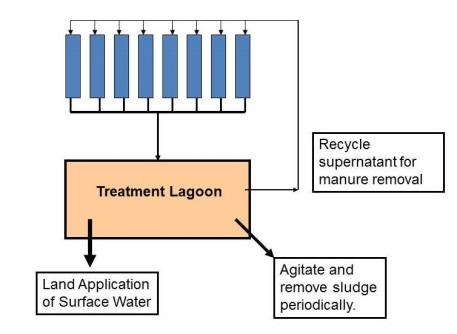
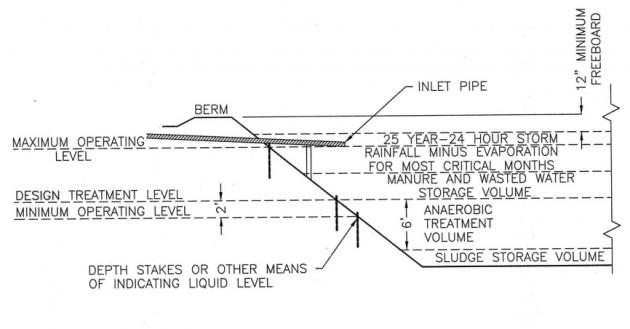
Treatment lagoons are one of the most common biological treatment methods used on swine and dairy farms that use recycled supernatant as a means to remove manure from animal housing facilities by flushing. A properly functioning treatment lagoon will provide adequate treatment to allow reuse of the effluent without compromising animal health or generating strong odor.
A typical treatment lagoon system used on swine and dairy farms.
A lagoon should have a minimum biological treatment volume and provide sufficient volume for settling and storage of sludge to provide the needed levels of treatment prior to recycling. This presentation will provide a summary of the benefits of using liquid-solid separation to maintain and potentially reduce the required treatment volume, reduce sludge build-up, increase useful life of an existing lagoon, and to reduce the size of new lagoons based on the ASABE Standard. Information will also be provided concerning desired loading rates and supernatant concentrations for recycling, and impacts of odor production potential.
Components of a treatment lagoon for animal manure.
What Did We Do?
The ASABE Lagoon Standard (ANSI/ASAE EP403.4, ASABE 2011) was used to calculate lagoon treatment volumes for swine and dairy manure using volatile solid loading rates for a variety of climates ranging from a cold climate, such as Southern Minnesota (3 lb VS/1000 ft3-day), to a hot climate, such as Central Florida (6.0 lb VS/1000 ft3-day). Liquid-solid separation methods can provide a reduction in the mass of VS in the liquid fraction by 10% to 80%. The corresponding reduction in treatment volume were also determined for swine and dairy manure over a wide range of climates.
The ASABE Standard also provides a method to estimate sludge storage volume requirments per year for swine and dairy lagoons that is based on the total solids loaded into a lagoon. The impact of implementing solid-liquid separation on the sludge accumulation rate was also destermined for TS removals in the range of 20% to 80%.
What Have We Learned?
The percent reduction in treatment volume of a lagoon was the same as the mass fraction of VS removed by liquid-solid separation. That is, a 30% reduction in VS provided a 30% reduction in treatment volume. The practical result is that implementation of liquid-solid separation system that can remove 30% of the VS would allow pork producers in the Midwest to use similar treatment volumes as pork producers located in South Carolina or Central Georgia.
Liquid-solid separation also reduced sludge build up in lagoons by the same percentage as the TS removal efficiency. Therefore, a 30% reduction in TS will reduce sludge accumulation by30%.
Reduction in TS and VS loading can help to reduce odors from lagoons, reduce the size of the lagoon needed to provide treatment, and can yield better treated surface water for flushing manure from the buildings.
Removal of large portions of the VS (60% to 80% reduction) using high-rate liquid-solid separation methods has the added benefit of greatly reducing the amount of the organic-N loaded. As a result, less organic-N will be converted to ammonium-N in a lagoon where a portion will be lost to the air as ammonia.
Future Plans
This information will be published as part of a new USDA-NRCS technical note or as part of the National Engineering Handbook, Part 651 Agricultural Waste Management Field Handbook.
Authors
Dr. John P. Chastain, Professor and Extension Agricultural Engineer, School of Agricultural, Forestry, and Environmental Sciences, Clemson University jchstn@clemson.edu
Jeffrey P. Porter, P.E. Environmental Engineer Manure Management Team USDA-Natural Resources Conservation Service
Additional Information
Solid-Liquid Separation Alterntives for Manure Handling Treatment, a new USDA-NRCS technical note or as part of the National Engineering Handbook, Part 651 Agricultural Waste Management Field Handbook.
Acknowledgements
Piedmont-South Atlantic Coast Cooperative Ecosystems Studies Unit (CESU). This Cooperative and Joint Venture Agreement allowed for this work to take place.
Manure Management Team USDA-Natural Resources Conservation Service, Greensboro, NC
Additional support was provided by the Confined Animal Manure Managers Program, Clemson Extension, Clemson University, Clemson, SC.
The authors are solely responsible for the content of these proceedings. The technical information does not necessarily reflect the official position of the sponsoring agencies or institutions represented by planning committee members, and inclusion and distribution herein does not constitute an endorsement of views expressed by the same. Printed materials included herein are not refereed publications. Citations should appear as follows. EXAMPLE: Authors. 2013. Title of presentation. Waste to Worth: Spreading Science and Solutions. Denver, CO. April 1-5, 2013. URL of this page. Accessed on: today’s date.
To provide the best experiences, we use technologies like cookies to store and/or access device information. Consenting to these technologies will allow us to process data such as browsing behavior or unique IDs on this site. Not consenting or withdrawing consent, may adversely affect certain features and functions.
Functional
Always active
The technical storage or access is strictly necessary for the legitimate purpose of enabling the use of a specific service explicitly requested by the subscriber or user, or for the sole purpose of carrying out the transmission of a communication over an electronic communications network.
Preferences
The technical storage or access is necessary for the legitimate purpose of storing preferences that are not requested by the subscriber or user.
Statistics
The technical storage or access that is used exclusively for statistical purposes.The technical storage or access that is used exclusively for anonymous statistical purposes. Without a subpoena, voluntary compliance on the part of your Internet Service Provider, or additional records from a third party, information stored or retrieved for this purpose alone cannot usually be used to identify you.
Marketing
The technical storage or access is required to create user profiles to send advertising, or to track the user on a website or across several websites for similar marketing purposes.

 Waste to Worth home | More proceedings….