A mass balance approach to estimate methane and ammonia emissions from non-ruminant livestock barns

Purpose

Producers are under pressure to demonstrate and document environmental sustainability. Responding to these pressures requires measurements to demonstrate greenhouse gas (GHG) emissions and/or changes over time. Stored manure emissions are a critical piece of livestock agriculture’s contribution to GHG production. Manure sample‐based estimates show promise for estimating methane (CH4) production rates from stored manure but deserve more extensive testing and comparison to farm‐level measurements. Understanding the causes for variability offer opportunity for more realistic and farm‐specific GHG emissions. Improved GHG measurements or estimates will more accurately predict current GHG emission levels, identify mitigation techniques, and focus resources where they are needed. This project offers an innovative approach to improvement of air quality and strengthens engagement by the livestock sector in sustainability discussions.

Although CH4 and ammonia (NH3) emissions from non-ruminant livestock production systems are primarily released from stored manure, current emission inventories (models) do not account for all production and management systems. The purpose of this project was to track flows of nitrogen, volatile solids (VS), and ash into and out of several commercial livestock barns to estimate CH4 and NH3 emissions. Using a mass balance approach, volatile components like nitrogen and volatile solids are supported through simultaneous balances with ash (fixed solids). These mass-balance based estimates can be compared to national inventory emission estimates and serve as sustainability metrics, regulatory reporting, and management decisions.

What Did We Do?

In the initial step of this project, experimental data for VS, the precursor to methane, are compared to fixed estimates in methane emission estimation tools, like the EPA State Greenhouse Gas Inventory Tool (US EPA, 2017).

The litter from a commercial turkey finishing barn housing between 13,000 and 18,000 birds was sampled weekly for one month, with one additional sampling day one month later. VS concentrations were analyzed for each sample and used to estimate total VS production per year assuming six 15,000 bird flocks (Soriano et al., 2022). A range of VS percentage values for deep-pit cattle facilities were taken from Cortus et al. (2021) and converted to total VS production per year. A range of VS concentrations for deep-pit swine manure storage were taken from Andersen et al. (2015) and used to find total VS production per year of that system as well. Next, total VS productions per year were estimated for the same three systems using the State Greenhouse Gas Inventory Tool.

What Have We Learned?

Table 1 summarizes all calculated total VS values and CH4 estimates per year for both the estimation tool and the experimental data. For each of the three systems, the state inventory estimated total VS value falls within the ranges calculated with experimental data, however, the estimates cannot account for the variabilities found within each system. As seen in the experimental total VS values, there can be a large range of VS production due to differences within specific operations of each system. Total VS relates directly to CH4 emissions, so accurate estimates are important for determining greenhouse gas emission potential of a specific operation.

Table 1. All calculated total VS values and CH4 emissions estimates for each of the three systems.
Total VS production (kg/yr) Emissions*
State Inventory Experimental Values m3CH4
Feedlot Steer (500 head) 334,990 260,758 – 1,002,675 1,262**
Grower-Finisher Swine (1,200 head 160,408 107,514  – 216,669 19,050
Turkey (15,000 head) 314,594 206,838 – 359,245 1,699
*Emissions estimates found through the State Greenhouse Gas Inventory Tool
**Feedlot steer emission estimate assumes an open feedlot manure management system

Future Plans

Next steps for this study will include manure sampling at additional commercial turkey barns, deep-pit grower-finisher swine barns, and dairy cattle systems. Similar mass balances will be performed to determine total VS and nitrogen content to calculate CH4 and NH3 emissions from each system. These calculated values will again be compared to outputs of emission estimating tools.

Authors

Anna Warmka, Undergraduate Student, University of Minnesota – Twin Cities, Department of Bioproducts and Biosystems Engineering

Corresponding author email address

warmk011@umn.edu

Additional authors

Erin Cortus, Associate Professor, University of Minnesota – Twin Cities, Department of Bioproducts and Biosystems Engineering

Noelle Soriano, MS Student, University of Minnesota – Twin Cities, Department of Bioproducts and Biosystems Engineering

Melissa Wilson, Assistant Professor, University of Minnesota – Twin Cities, Department of Soil, Water, and Climate

Bo Hu, Professor, University of Minnesota – Twin Cities, Department of Bioproducts and Biosystems Engineering

Additional Information

Andersen, D.S., M.B. Van Weelden, S.L. Trabue, and L.M. Pepple. “Lab-Assay for Estimating Methane Emissions from Deep-Pit Swine Manure Storages.” Journal of Environmental Management 159 (August 2015): 18–26. https://doi.org/10.1016/j.jenvman.2015.05.003.

Cortus, E.L., B.P. Hetchler, M.J. Spiehs, and W.C. Rusche. “Environmental Conditions and Gas Concentrations in Deep-Pit Finishing Cattle Facilities: A Descriptive Study.” Transactions of the ASABE 64, no. 1 (2021): 31–48. https://doi.org/10.13031/trans.14040.

US EPA, OAR. “State Inventory and Projection Tool.” Data and Tools, June 30, 2017. https://www.epa.gov/statelocalenergy/state-inventory-and-projection-tool.

Soriano, N.C., A.M. Warmka, E.L. Cortus, M.L. Wilson, B. Hu, K.A. Janni. “A mass balance approach to estimate ammonia and methane emissions from a commercial turkey barn.” unpublished (2022).

Acknowledgements

This research was supported by the Rapid Agricultural Response Fund. We also express appreciation to farmer cooperators who allowed us to collect data on their farms and shared their observations with us.

Spatial and temporal variabilities of manure composition in a commercial turkey barn

Purpose

A mass balance approach to estimate gas emissions is based on tracking inflows and outflows from the barn boundary with losses assumed to be aerial emissions from the barn. This method is reliant on high-quality data to obtain representative emission values. Some considerations for this include spatial and temporal variability of manure composition in a turkey barn. Farm management styles and bird behavior may influence the location of manure accumulation and distribution. Thus, our objective for this work was to identify spatial and temporal differences of manure composition in the barn. The results from this work may have implications for sampling procedures for emission estimation using a mass balance approach.

What Did We Do?

The system in this study was a commercial turkey finishing barn that housed between 13,000 to 18,000 birds and used wood shavings as bedding. Birds were moved into the barn at 5-weeks old and were 13 weeks old by the end of the sampling period. There were no birds in the barn during the first week of sampling. Bird growth was constantly changing as birds matured, which would affect manure production and possibly manure composition. For this reason, weekly samples were taken over a one-month period, with one additional sampling day one month after to capture these changes.

For sampling purposes, the barn area was divided into seven different lanes based on locations of feeder and waterer lines, as well as existing “lanes” implemented by the farm staff in their distribution of litter. Litter samples were aggregated from cores at seven different locations along an individual lane. Manure samples were analyzed for moisture, volatile solids (VS), ash, and nitrogen (N) content. Manure density and depth measurements were also recorded during sampling to track manure accumulation over time.

Figure 1: Barn layout depicting the seven lanes from which aggregated litter samples were collected.

What Have We Learned?

Moisture, volatile solids (wet basis), and ash content (wet basis) differed by position in the barn. Higher moisture content was observed at the waterer and feeder lines (shown in solid lines) compared to the middle barn area (shown in dashed lines). Water spillage and defecation occurred most frequently at these lanes, which aligns with results shown in Figure 1.

Figure 2. Measured litter moisture content in the middle barn areas compared to the waterer and feeder lanes.
Figure 3. Measured ash content in the middle barn areas compared to the waterer and feeder lanes. A similar trend was observed for volatile solids content.

Ash (Figure 3) and volatile solids (not pictured) concentrations shared the same trend, where litter in the middle barn area had higher ash and VS concentrations compared to the waterer and feeder lanes. Areas with higher moisture content should have lower ash and volatile solids concentrations, and so this result was expected. These results are shown in Figure 2.

The N content in the middle barn area was generally higher than N at the waterer and feeder lanes, except for x2. This was unexpected as birds were observed to defecate most frequently around the waterer and feeder lanes, and so a higher N content was expected at these lanes, compared to the middle of the barn. The range of results, however, was comparable to literature and standard values, as well as results from a commercial lab test, as shown in Figure 4. This value was determined using the Dumas method at a commercial lab and describes the N content of a manure sample taken shortly after barn cleanout.

Figure 4. N content at different locations in the barn.

Temporal changes in manure composition were observed in the first two weeks of sampling for ash and volatile solids which were around the time the birds were first moved into the barn. Shortly after, ash and volatile solids concentrations stayed the same. For nitrogen, a general decrease was observed over time for all lanes during the weekly sampling period. Litter was also added between days 28 and 56 which may explain the general increase in N content between days 28 and 56. Overall, these results suggest that weekly sampling over a one-month period may be too frequent to discern any changes in manure composition.  The one-month sampling period may also be too short. Manure management decisions such as barn clean-out schedules, litter additions, and removals may reveal more discernable changes in manure composition.

Future Plans

This data will be used to calculate N, volatile solids and ash mass from the manure, and applied to a mass balance for N and CH4 emission calculation from the turkey barn. Knowledge of spatial differences in manure composition would be useful for emission estimation from specific areas in the barn. It can also be used for overall barn emission estimation, with possibility of calculation of emission contributions from different areas in the barn.

Authors

Presenting author

Noelle Soriano, MS Student, University of Minnesota – Twin Cities

Corresponding author

Erin Cortus, Associate Professor, University of Minnesota-Twin Cities

Corresponding author email address

ecortus@umn.edu

Additional Authors

Anna Warmka, Undergraduate student, University of Minnesota- Twin Cities

Melissa Wilson, Assistant Professor, University of Minnesota- Twin Cities

Bo Hu, Professor, University of Minnesota- Twin Cities

Kevin Janni, Professor, University of Minnesota -Twin Cities

Acknowledgements

This research was supported by the Rapid Agricultural Response Fund. We also want to express appreciation to farmer cooperators who allowed us to collect data and shared their observations with us.

Gaseous Emissions from In-house Broiler Litter

Purpose

Broiler litter is a valuable fertilizer but can also be a source of odorous and GHG emissions during production, storage, and land application. Impacts of these emissions are felt by local communities, posing respiratory health impacts and decreased quality of life, as well as increased deposition into soil and water systems. This study seeks to quantify the magnitude of emissions associated with in-house broiler litter and estimate variability across farms. Finally, the study evaluates litter parameters, such as litter age and chemical composition, for gas emission predictors.

What Did We Do?

A set of five active broiler houses in North Carolina were sampled to measure gaseous emissions (NH3, H2S, CH4, N2O, CO2, and VOCs) using headspace flux measurement gas samples. Headspace gas concentrations were measured at 1 hour and 3 hours after incubation at 30°C using a photoacoustic analyzer (Innova 1412) for NH3, CH4, N2O, and CO2 and Jerome 631-X was used to measure H2S, concentration. The headspace was also sampled to quantify VOCs associated with odorous emissions. After incubation, water extraction was used to quantify less volatile organic species that are associated with odorous emissions in the litter. Experimental setup is described in Figure 1. Statistical software, JMP, was utilized for analysis of litter composition on NH3, H2S, CH4, N2O, CO2, and VOC gaseous emissions.

Figure 1. Broiler emission experimental setup

What Have We Learned?

H2S emissions were very low (< 0.01 ppm) and did not produce statistically significant observations. There was a wide range of emissions from the litter samples for different gases as shown in Figure 2: 146-555 ppm NH3, 1.5-22 ppm N2O, 4,077-50,835 ppm CO2, and 9.1-43.3 ppm CH4. The differences between farms accounted for 86%, 81%, 76%, and 84% of the variability in NH3, N2O, CO2, CH4 observations, respectively. This could be attributed to differences in integrator and management strategies. Moisture content and age of the litter were the primary contributing factors to increased gaseous emissions from all samples. More specifically, NH3 was largely impacted by pH (p < 0.01), while N2O, CO2, and CH4 were largely impacted by C:N (p < 0.01). Quantitative VOC analysis was difficult due to the number of gases detected by the GC-MS (20+), however the most common species present in the litter samples were a variety of volatile fatty acids, alcohols, phenol, as well as a few amines, ketols, and terpenes.

Figure 2. Photoacoustic flux measurements of litter samples at 1 and 3 hour intervals.

Future Plans

These results will serve as baseline emission readings for odor and emission control strategies. We are currently developing Miscanthus-derived biochar as a poultry litter amendment for emission mitigation in poultry houses. This dataset will inform our decision making to help target gaseous species of top concern in NC broiler litter by methods of physical and chemical biochar modification.

Authors

Presenting author

Carly Graves, Graduate Research Assistant, North Carolina State University

Corresponding author

Dr. Mahmoud Sharara, Assistant Professor & Waste Management Extension Specialist, North Carolina State University

Corresponding author email address

msharar@ncsu.edu

Acknowledgements

Funding for this project is through Bioenergy Research Initiative (BRI)- NC Department of Agriculture and Consumer Services (NCDA&CS): Miscanthus Biochar Potential as A Poultry Litter Amendment

A Workshop to Review BMPs and BATs for Control of Dust, Ammonia, and Airborne Pathogen Emissions at Commercial Poultry Facilities (Zhao)

Purpose

Poultry production is a significant source of air pollutant emissions including particulate matter (PM), ammonia (NH3), and  pathogens, which negatively impact bird health and performance, human respiratory health, food safety, and local environmental quality. Effective and economically feasible management practices and technologies to mitigate air pollutant emissions and pathogen transmission are urgently needed.

In the past decade, a variety of management practices and control technologies have been developed and preliminarily tested in commercial poultry facilities, with varying degrees of success. Technologies that have been applied for PM control include air filtration, impaction curtains, oil/water spraying, wet scrubbers, electrostatic precipitation, and electrostatic spray scrubbing. Among these, electrostatic methods and wet scrubbing achieve high removal efficiencies for both fine and coarse PM. For NH3 gas mitigation, various forms of scrubbing technologies such as trickling biofilters, acid spray scrubbers, and electrolyzed water spraying have been tested in commercial poultry facilities, alongside management practices such as feed additives and litter amendments. Acid spray scrubbers can be particularly attractive to poultry facilities since the sulfuric acid from the scrubber reacts with NH3 to create ammonium sulfate, which can be used as fertilizer to offset scrubber operating costs. A new technology using artificial floor was recently studied and demonstrated significant reduction in ammonia and PM concentrations and emissions at laying hen housing.

The avian influenza outbreak in 2014/15 and the current spread of the Highly Pathogenic Avian Influenza (HPAI) remind us that pathogen control at poultry facilities is crucial. Technologies such as electrostatic precipitators, electrostatic spray scrubbers, and electrolyzed water spraying systems have been tested to assess their capacities for airborne bacteria reduction.

The technical and economic feasibilities of these methods need to be evaluated for proper consideration by poultry producers and their stakeholders. All the above research results need to be introduced to producers for practical applications.

What Did We Do?

This workshop is organized for the researchers and Extension specialists to review the latest BMPs and BATs on control of dust, ammonia, and pathogens at poultry facilities for improved biosecurity, food safety, environmental quality, and the overall sustainability of poultry production.  We have developed the following presentations and will present them at 2022 W2W.

    1. Manure Drying Methods to Control Ammonia Emissions (Dr. Albert Heber-Professor Emeritus, Purdue University)
    2. A Spray Wet Scrubber for Recovery of Ammonia Emissions from Poultry Facilities (Dr. Lingying Zhao, Professor, Ohio State University)
    3. Electrostatic Precipitation Technologies for Dust and Pathogen Control at Poultry Layer Facilities (Dr. Lingying Zhao, Professor, The Ohio State University)
    4. Field Experiences of Large-Scale PM Mitigation (Dr. Teng Lim, Professor, University of Missouri)
    5. Mitigation of Ammonia and Particulate Matter at Cage-free Layer Housing with New Floor Substrate (Dr. Ji-Qin Ni, Professor, Purdue University)

What Have We Learned?

    1. Newly developed BMPs and BATs can improve air quality in commercial poultry facilities: Manure belt layer houses reduce ammonia emissions by removing manure from the layer houses in 1 to 7 days. Belt aeration using blower tubes is one method that has been used to dry the manure on the belt.  Drying tunnels take manure from layer houses and utilize ventilation exhaust air to further dry the manure before it enters the manure storage or compost facilities or transfers to pelletizing operations.  Manure sheds and compost facilities are ventilated with building exhaust air or fresh air to dry manure in storage.
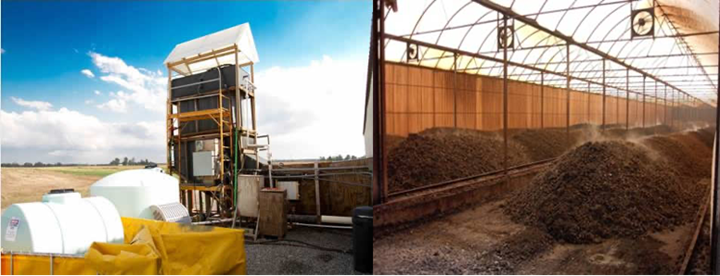
    2. The use of acid spray scrubbing is promising, as it simultaneously mitigates and recovers ammonia emission for fertilizer. Its low contribution of backpressure on propellor fans makes it applicable on US farms. A full-scale acid spray scrubber was developed to recover ammonia emissions from commercial poultry facilities and produce nitrogen fertilizer. The scrubber performance and economic feasibility were evaluated at a commercial poultry manure composting facility that released ammonia from exhaust fans with concentrations of 66–278 ppmv and total emission rate of 96,143 kg yr−1. The scrubber achieved high NH3 removal efficiencies (71–81%) and low pressure drop (<25 Pa). Estimated water and acid losses are 0.9 and 0.04 ml m−3 air treated, respectively. Power consumption rate was between 90 and 108 kWh d−1. The scrubber effluents containing 22–36% (m/v) ammonium sulphate are comparable to commercial-grade nitrogen fertilizer. Preliminary economic analysis indicated that a break-even of one year is achievable. This study demonstrates that acid spray scrubbers can economically and effectively recover NH3 from animal facilities for fertilizer.
    3. Two types of electrostatic precipitation-based dust control technologies have been developed at the Ohio State University: the electrostatic precipitator (ESP) and the electrostatic spray scrubber (ESS). Field tests of the ESP and ESS conducted at a commercial layer facility indicated that (1) the fully optimized ESP achieved respective mean PM5, PM10, and TSP removal efficiencies of 93.6% ±5.0%, 94.0% ±5.0%, and 94.7% ±4.4% and (2) the ESS exhibited respective mean PM2.5, PM10, and TSP removal efficiencies of 90.5% ±10.0%, 91.9% ±8.2%, and 92.9% ±6.9%.  A system of 88 large ESP units to treat exhaust air from the 4-house poultry facility at the minimum required ventilation rate of 24.8 m3 s-1 would have an initial cost of $757,680 and an annual operating cost of $10,831 ($13.43 per 1,000 birds), increasing annual facility electricity consumption by 54.2%. A system of ESS units designed to treat exhaust air for six exhaust fans in each of the 4 poultry houses that operated continuously year-round for minimum ventilation, is estimated to have an initial cost of $71,280 with an annual operating cost of $21,663 for water consumption and electricity usage. The ESP is more effective, and the ESS is more economically feasible to mitigate PM at a commercial egg production facility.
    4. The field-scale measurements of PM mitigation technologies are usually time-consuming to set up and maintain, and often only limited replications can be obtained. It is important to minimize interference to the routine farm operation. The use of different PM measurements, setup and maintenance required to ensure data quality, and differences between the mitigation technologies are discussed. It is important to consider practicality of the mitigations, along with safety, and long-term use of the different technologies.
    5. A new mitigation approach, using AstroTurf ® as floor substrate, reduced indoor concentrations and emissions of ammonia and PM at cage-free aviary-style layer rooms in a recent study. Results demonstrated that the average daily mean ammonia concentration in the two AstroTurf® floor rooms (7.5 ppm) was significantly lower (p < 0.05) compared with that in the two wood shaving floor rooms (15.2 ppm) with a reduction rate of 51%. Average daily mean large particles (all particles detected above ~2.5 µm) and small particles (all particles detected below ~0.5 µm) in the two AstroTurf® floor rooms were significantly reduced (p < 0.05) by 70% (501,300 vs. 1,679,700 per ft3) and 63% (906,300 vs. 2,481,100 per ft3), respectively, compared with those in the two wood shaving floor rooms. With the controlled and consistent ventilation rates among the rooms in the study, the emissions of ammonia and PM (large and small particles) from the two AstroTurf® floor rooms had similar reduction rates.

Future Plans

More workshops to review BMPs and BATs for mitigation of air emissions and pathogen transmission in poultry facilities will be organized as new research development and findings emerge.  The workshop will target audiences of researchers, farmers, and professionals working with farmers.

Authors

Presenting authors

Lingying Zhao, Professor and Extension Specialist, The Ohio State University

Albert Heber, Professor Emeritus, Purdue University

Teng Lim, Professor, University of Missouri

Ji-Qin Ni, Professor, Purdue University

Corresponding author

Lingying Zhao, Professor and Extension Specialist, The Ohio State University

Corresponding author email address

Zhao.119@osu.edu

Additional authors

Matt Herkins, Graduate Research Associate, The Ohio State University

Albert Heber, Professor Emeritus, Purdue University

Teng Lim, Professor, University of Missouri

Ji-Qin Ni, Professor, Purdue University

Additional Information

Airquality.osu.edu

Hadlocon, L. J., A. Soboyejo, L. Y. Zhao, and H. Zhu. 2015. Statistical modeling of ammonia absorption efficiency of an acid spray scrubber using regression analysis. Biosystems Engineering 132: 88-95.

Hadlocon, L. S., R.B. Manuzon, and L. Y. Zhao. 2015. Development and evaluation of a full-scale spray scrubber for ammonia recovery and production of nitrogen fertilizer at poultry facilities. Environmental Technology 36(4): 405-416.

Hadlocon, L.J. and L.Y. Zhao. 2015. Production of ammonium sulfate fertilizer using acid spray wet scrubbers. Agricultural Engineering International: CIGR Journal. 17 (Special Issue: 18th World Congress of CIGR): 41-51.

Hadlocon, L.J., L.Y. Zhao, B. Wyslouzil, and H. Zhu. 2015. Semi-mechanistic modeling of ammonia absorption in acid spray scrubbers based on mass balances.  Biosystems Engineering 136:14-24.

Heber, A. J., T.-T. Lim, J.-Q. Ni, P. C. Tao, A.M. Schmidt, J. A. Koziel, S. J. Hoff, L.D. Jacobson, Y.H. Zhang, and G.B. Baughman. 2006. Quality-assured measurements of animal building emissions: Particulate matter concentrations. Journal of the Air & Waste Management Association. 56(12): 1642-1648.

Knight, R. M. L.Y. Zhao, and H. Zhu. 2021. Modelling and optimisation of a wire-plate ESP for mitigation of poultry PM emission using COMSOL. Biosystems Engineering 211: 35-49.

Knight, R., X. Tong, L. Zhao, R. B. Manuzon, M. J. Darr, A. J. Heber, and J. Q. Ni. 2021. Particulate matter concentrations and emission rates at two retrofitted manure-belt layer houses. Transactions of the ASABE 64(3): 829-841. (doi: 10.13031/trans.14337)

Knight, R., X. Tong, Z. Liu, S. Hong, and L.Y. Zhao. 2019. Spatial and seasonal variations of PM concentration and size distribution in manure-belt poultry layer houses. Transactions of the ASABE 62(2):415-427. doi: 10.13031/trans.12950

Lim, T. T., H. W. Sun, J.-Q. Ni, L. Zhao, C. A. Diehl, A. J. Heber, and P.-C. Tao. 2007. Field tests of a particulate impaction curtain on emissions from a high-rise layer barn. Transactions of the ASABE 50(5): 1795-1805.

Lim, T.-T., Y. Jin, Ni, J.-Q., and A. J. Heber. 2012. Field evaluation of biofilters in reducing aerial pollutant emissions from commercial finishing barn. Biosytems Engineering 112(3): 192-201.

Lim, T.-T., C. Wang, A. J. Heber, J.-Q. Ni, and L. Zhao. 2018. Effect of electrostatic precipitation on particulate matter emissions from a high-rise layer house. In Air Quality and Livestock Farming, 372 p. T. Banhazi, A. Aland, and J. Hartung, eds. Australia: CRC Press, Taylor and Francis Group.

Ni, J.-Q., A.J. Heber, M. J. Darr, T.-T. Lim, Diehl, and B. W. Bogan. 2009. Air quality monitoring and on-site computer system for livestock and poultry environment studies. Transactions of the ASABE 52(3): 937-947.

Ni, J.-Q., A. J. Heber, E. L. Cortus, T.-T. Lim, B. W. Bogan, R. H. Grant, and M. T. Boehm. 2012. Assessment of ammonia emissions from swine facilities in the U.S. – Application of knowledge from experimental research. Environmental Science & Policy 22(0): 25-35.

Ni, J.-Q., L. Chai, L. Chen, B. W. Bogan, K. Wang, E. L. Cortus, A. J. Heber, T.-T. Lim, and C. A. Diehl. 2012. Characteristics of ammonia, hydrogen sulfide, carbon dioxide, and particulate matter concentrations in high-rise and manure-belt layer hen houses. Atmospheric Environment 57(0): 165-174.

Ni, J.-Q., S. Liu, C. A. Diehl, T.-T. Lim, B. W. Bogan, L. Chen, L. Chai, K. Wang, and A. J. Heber. 2017. Emission factors and characteristics of ammonia, hydrogen sulfide, carbon dioxide, and particulate matter at two high-rise layer hen houses. Atmospheric Environment 154: 260-273. http://dx.doi.org/10.1016/j.atmosenv.2017.01.050.

Tong, X., L.Y. Zhao, A. Heber, and J. Ni. 2020.  Mechanistic modelling of ammonia emission from laying hen manure at laboratory scale. Biosystems Engineering. 192:24-41.

Tong, X., L.Y. Zhao, A. Heber, and J. Ni. 2020. Development of a farm-scale, quasi-mechanistic model to estimate ammonia emissions from commercial manure-belt layer houses. Biosystems Engineering 196, 67-87.

Tong, X., L.Y. Zhao, R. B. Manuzon, M. J. Darr, R. M. Knight, C. Wang, A. J. Heber, and J.Q. Ni. 2021. Ammonia concentrations and emissions at two commercial manure-belt layer housed with mixed tunnel and cross ventilation. Transactions of the ASABE 64(6): 2073-2087. (doi: 10.13031/trans.14634)

Tong, X., S. S. Hong., and L.Y. Zhao 2019. Development of upward airflow displacement ventilation system of manure-belt layer houses for improved indoor environment using CFD simulation. Biosystems Engineering 178:294-308.

Zhao, L.Y., L. J. S. Hadlocon, R. B. Manuzon, M.J. Darr, H. M. Keener, A. J. Heber, and J.Q. Ni. 2016. Ammonia concentrations and emission rates at a commercial manure composting facility. Biosystems Engineering  150: 69-78.

Acknowledgements

The wet scrubber development was supported by National Research Initiative Competitive Grant 2008-55112-1876 from the USDA Cooperative State Research, Education, and Extension Service Air Quality Program. The ammonia emission modelling work was supported by the USDA-NIFA Grant 2018-67019-27803.

The electrostatic precipitation-based dust control work was supported by the USDA National Institute of Food and Agriculture Grant 2016-67021-24434.

The Project funding for the Mitigation of Ammonia and Particulate Matter at Cage-free Layer Housing with New Floor Substrate presentation was provided by the U.S. Poultry & Egg Association. GrassWorx LLC provided the AstroTurf and financed the building of the flooring systems.

Appreciation is also expressed to the U.S. EPA, and participating producers and staff for their collaboration and support.


The authors are solely responsible for the content of these proceedings. The technical information does not necessarily reflect the official position of the sponsoring agencies or institutions represented by planning committee members, and inclusion and distribution herein does not constitute an endorsement of views expressed by the same. Printed materials included herein are not refereed publications. Citations should appear as follows. EXAMPLE: Authors. 2022. Title of presentation. Waste to Worth. Oregon, OH. April 18-22, 2022. URL of this page. Accessed on: today’s date.

Updating manure N and P credits: A growth chamber study

For a long time, farmers have realized the benefits of using manure as a nutrient source.  The ratio of various nutrients in manure, however, rarely matches the exact plant needs. Consequently, farmers must choose between overapplying some nutrients, or underapplying others and meeting the remaining needs with commercial fertilizers. Figuring out nitrogen (N) credits can be a difficult task since the total amount of N found in manure is not fully available the year of application, nor even after the second year of application. In addition, understanding P availability in manure is necessary because excess P can ultimately lead to eutrophication of surface waters. The amount of N that is available will depend on several factors such as animal species, bedding (if any), manure storage, and application method. We assume approximately 80% of the total manure P is available the first year, but even this can vary depending on soil texture, manure chemistry, and weather conditions. Current University of Minnesota recommendations help determine N and P credits for a variety of manures (Hernandez and Schmitt 2012). These recommendations were developed several decades ago and need an update since the diets of animals, storage of manures, and manure application equipment have changed over the years. Therefore, the primary purpose of this study is to estimate N and P mineralization from a variety of manures and soil types across different temperature regime. Our goal is to verify and/or update N and P credit recommendations from manure so that farmers are able to make better decisions when purchasing and applying commercial fertilizers in following years.  

What did we do?

Laboratory incubations were used to assess N and P release characteristics from a variety of manures in several different soil types. The incubation studies were a complete factorial with 4 replications and with manure type, soil type, and temperature as the main factors. We also included a control treatment that did not include any manure application to see how much nitrogen and phosphorus mineralized from the soils themselves. We tested 8 manures, including: dairy liquid (separated and raw [non-separated]), swine liquid (from a finishing house and a sow barn), beef manure (solid bedded pack and liquid from a deep pit), and poultry (turkey litter and chicken layer manure). Manure analyses to determine nutrient content were conducted on all samples prior to incubations. Soils for the incubations included a coarse textured soil from the Sand Plain Research Center at Becker, MN; a medium textured soil from a research field near Rochester, MN; and a fine textured soil from the West Central Research and Outreach Center in Morris, MN. Soils were collected from the top six inches of soil at each location in bulk and then air dried, ground down to pass a 2-mm sieve, and analyzed for nutrient and organic matter content.  

One liter clear glass canning jars were filled with 200 g of sieved soil and were kept at 60% of field capacity which was maintained by weighing every 4-6 days and adding deionized water as needed to replace the weight lost. We used the University of Minnesota guidelines and manure analysis results to calculate the appropriate application rate for each manure type. During the incubation study, the temperature inside the incubator was kept at either 25⁰C (77⁰F). We collected subsamples at 0, 7, 14, 28, and 56 days after the experiment had begun. Subsamples were destructively analyzed for potassium chloride extractable ammonium and nitrate and Bray-1 or Olsen extractable phosphate. Figure 1 shows the schematics of our experimental set-up and components.  

Figure 1: Growth chamber incubation study experimental set-up.

What have we learned?

At the time of writing, the experiment has only been run at one temperature, 25⁰C (77⁰F) and subsamples for days 0-28 have been collected. Ammonium and nitrate have been analyzed for subsamples for days 0-14. The remaining treatments will be completed later in 2019. Statistical analyses have not been conducted at this time.

The results of the initial soil and manure tests can be found in Tables 1 and 2, respectively. This will give an idea of the starting conditions of the soils and manures. For visual reference, Figure 2 shows the inorganic N (ammonium + nitrate) from each treatment from days 0-14 for the incubation at 25⁰C. The control samples showed that more inorganic N was present in the medium textured soil than the other soils. In general, the swine manure from both finisher and sow barns released the most inorganic N compared with other manures. Of the beef manures, the liquid deep pit manure tended to release more inorganic N than the bedded pack manure, likely due to the lack of bedding to tie up nitrogen. Of the dairy manures, the raw and liquid separated tended to release inorganic N similarly, except in the medium textured soil where the liquid separated manure released more inorganic N. Across soil types, the inorganic N release tended to be stable in the coarse textured soil, while in the medium and fine textured soil, it appears to have increased initially then slowly decreased. It is unclear why this may have happened but could be due to volatilization of ammonium, denitrification of nitrate, or immobilization of N into organic forms. More tests are needed and will be completed later in 2019.

Table 1. Initial characteristics of three soil types used in this study: coarse textured soil from Becker, MN; medium textured soil from Rochester, MN; and a fine-textured soil from Morris, MN.
Soil Characteristics Soil Textural Class
Coarse Medium Fine
Organic matter (%) 1.1 1.0 3.3
pH 5.1 5.2 7.9
Phosphorus – Olsen (ppm) 11 8 7
Potassium (ppm) 95 101 140
Magnesium (ppm) 42 49 570
Calcium (ppm) 274 310 3482
Ammonium (ppm) 3.4 2.8 8.6
Nitrate (lb/acre) 3.0 2.5 8.5
Table 2. Initial characteristics of eight manure types used in this study. The units of nutrients are in pounds per ton for solid manure and in pounds per 1000 gallons for liquid manure.
Species Type Manure Type Moisture Total N Ammonium-N Total P (as P2O5) Total K (as K2O) C:N Ratio
(%) (lbs per unit) (lbs per unit) (lbs per unit) (lbs per unit)
Beef Bedded Pack, Solid 60.5 13.43 2.37 9.59 18.01 22:1
Deep Pit, Liquid 86.6 56.72 36.7 23.43 30.83 9:1
Dairy Separated, Liquid 93.2 32.7 15.8 13.31 29.26 7:1
Raw, Liquid 88.9 33.17 15.66 13.08 31.29 13:1
Swine Finisher, Liquid 86.8 59.16 41.63 37.63 27.35 9:1
Sow, Liquid 99.3 16.5 15.69 1.38 11.34 1:1
Poultry Chicken Layer, Solid 48.6 55.51 14.39 35.78 25.91 7:1
Turkey Litter, Solid 53.0 28.2 13.16 26.69 28.65 12:1
Figure 2. The amount of inorganic-N (the sum of ammonium-N + nitrate-N) in soil mixed with various manure types in: a. coarse textured soil from Becker, MN; b. medium textured soil from Rochester, MN; and c. fine textured soil from Morris, MN.

Future plans

We plan to analyze all the 25 °C samples for nitrogen and phosphorus as well as samples from experiment at 15 and 5 °C this year. We also collected ammonia (NH3) gas samples from the headspace of each jars. We plan to analyze these samples to understand the effects of manure application on ammonia volatilization losses. In addition, on a separate set of experiments we deployed anion and cation exchange resins in each jar. These resins were replaced each week on average. We plan to extract these resins for N and P.

Authors

Dr. Suresh Niraula

Postdoctoral Associate

Department of Soil, Water, and Climate

University of Minnesota (sniraula@umn.edu)


Dr. Melissa Wilson

Assistant Professor and Extension Specialist

Manure Management & Water Quality

Department of Soil, Water, and Climate

University of Minnesota

(Corresponding author email: mlw@umn.edu)

Acknowledgements

This material is based on work that is supported by the Sugarbeet Research and Education Board of Minnesota and North Dakota as well as the Agricultural Fertilizer Research and Education Council of Minnesota.

Additional information

Hernandez JA, Schmitt MA. 2012. Manure management in Minnesota. Saint Paul (MN): University of Minnesota Extension [accessed 24 Nov 2017].

Pagliari PH, Laboski CAM. 2014. Effects of manure inorganic and enzymatically hydrolyzable phosphorus on soil test phosphorus. Soil Soc. of Am. J. 78(4): 1301-1309.

Russelle MP, Blanchet KM, Randall GW, Everett LA. 2009. Characteristics and nitrogen value of stratified bedded pack dairy manure. Crop Management 8(1). https://dl.sciencesocieties.org/ publications/cm/abstracts/8/1/2009-0717-01-RS.

The authors are solely responsible for the content of these proceedings. The technical information does not necessarily reflect the official position of the sponsoring agencies or institutions represented by planning committee members, and inclusion and distribution herein does not constitute an endorsement of views expressed by the same. Printed materials included herein are not refereed publications. Citations should appear as follows. EXAMPLE: Authors. 2019. Title of presentation. Waste to Worth. Minneapolis, MN. April 22-26, 2019. URL of this page. Accessed on: today’s date.

Production of Greenhouse Gases, Ammonia, Hydrogen Sulfide, and Odorous Volatile Organic Compounds from Manure of Beef Feedlot Cattle Implanted with Anabolic Steroids

Animal production is part of a larger agricultural nutrient recycling system that includes soil, water, plants, animals and livestock excreta. When inefficient storage or utilization of nutrients occurs, parts of this cycle become overloaded. The U.S. Beef industry has made great strides in improving production efficiency with a significant emphasis on improving feed efficiency. Improved feed efficiency results in fewer excreted nutrients and volatile organic compounds (VOC) that impair environmental quality. Anabolic steroids are used to improve nutrient feed efficiency which increases nitrogen retention and reduces nitrogen excretion. This study was conducted to determine the methane (CH4), carbon dioxide (CO2), nitrous oxide (N2O), odorous VOCs, ammonia (NH3), and hydrogen sulfide (H2S) production from beef cattle manure and urine when aggressive steroid implants strategies were used instead of moderate implant strategies.

What Did We Do?

Two groups of beef steers (60 animals per group) were implanted using two levels of implants (moderate or aggressive). This was replicated three times, twice with spring-born calves and once with fall-born calves, for a total of 360 animals used during the study. Both moderate and aggressive treatment groups received the same initial implant that contain 80 mg trenbolone acetate and 16 mg estradiol. At second implant, steers in the moderate group received an implant that contained 120 mg trenbolone acetate and 24 mg estradiol, while those in the aggressive group received an implant that contained 200 mg trenbolone acetate and 20 mg estradiol. Urine and feces samples were collected individually from 60 animals that received a moderate implant and 60 animals that received an aggressive implant at each of three sampling dates (Spring and Fall 2017 and Spring 2018). Within each treatment, fresh urine and feces from five animals were mixed together to make a composite sample slurry (2:1 ratio of manure:urine) and placed in a petri dish. There were seven composite mixtures for each treatment at each sampling date. Wind tunnels were used to pull air over the petri dishes. Ammonia, carbon dioxide, and nitrous oxide concentrations were measured using an Innova 1412 Photoacoustic Gas Analyzer. Hydrogen sulfide and methane were measured using a Thermo Fisher Scientific 450i and 55i, respectively. Gas measurements were taken a minimum of six times over 24- to 27-day sampling periods.

What Have We Learned?

Flux of ammonia, hydrogen sulfide, methane, nitrous oxide, and total aromatic volatile organic compounds were significantly lower when an aggressive implant strategy was used compared to a moderate implant strategy. However, the flux of total branched-chained volatile organic compounds from the manure increased when aggressive implants were used compared to moderate implants. Overall, this study suggests that air quality may be improved when an aggressive implant is used in beef feedlot animals.

Table 1. Overall average flux of compounds from manure (urine + feces) from beef feedlot cattle implanted with a moderatea or aggressiveb anabolic steroid.
Hydrogen Sulfide Ammonia Methane Carbon Dioxide Nitrous  Oxide Total Sulfidesc Total SCFAd Total BCFAe Total Aromaticsf
µg m-2 min-1 ——–mg m-2 min-1——–
Moderate 4.0±0.1 2489.7±53.0 117.9±4.0 8795±138 8.6±0.1 0.7±0.1 65.2±6.6 5.9±0.5 2.9±0.3
Aggressive 2.7±0.2 2186.4±46.2 104.0±3.8 8055±101 7.4±0.1 0.8±0.1 63.4±5.7 7.6±0.8 2.1±0.2
P-value 0.01 0.04 0.01 0.01 0.01 0.47 0.83 0.05 0.04
aModerate treatment =  120 mg trenbolone acetate and 24 mg estradiol at second implant; bAggressive treatment = 200 mg trenbolone acetate and 20 mg estradiol at second implant; cTotal sulfides = dimethyldisulfide and dimethyltrisulfide; dTotal straight-chained fatty acids (SCFA) = acetic acid, propionic acid, butyric acid, valeric acid, hexanoic acid, and heptanoic acid;  eTotal branch-chained fatty acids (BCFA) = isobutyric acid and isovaleric acid; fTotal aromatics = phenol, 4-methylphenol, 4-ethylphenol, indole, and skatole

Future Plans
Urine and fecal samples are being evaluated to determine the concentration of steroid residues in the livestock waste and the nutrient content (nitrogen, phosphorus, potassium and sulfur) of the urine and feces.

Authors

mindy.spiehs@ars.usda.gov Mindy J. Spiehs, Research Animal Scientist, USDA ARS Meat Animal Research Center, Clay Center, NE

Bryan L. Woodbury, Agricultural Engineer, USDA ARS Meat Animal Research Center, Clay Center, NE

Kristin E. Hales, Research Animal Scientist, USDA ARS Meat Animal Research Center, Clay Center, NE

Additional Information

Will be included in Proceedings of the 2019 Annual International Meeting of the American Society of Agricultural and Biological Engineers.

USDA is an equal opportunity provider and employer. 

Acknowledgements

The authors wish to thank Alan Kruger, Todd Boman, Bobbi Stromer, Brooke Compton, John Holman, Troy Gramke and the USMARC Cattle Operations Crew for assistance with data collection.

The authors are solely responsible for the content of these proceedings. The technical information does not necessarily reflect the official position of the sponsoring agencies or institutions represented by planning committee members, and inclusion and distribution herein does not constitute an endorsement of views expressed by the same. Printed materials included herein are not refereed publications. Citations should appear as follows. EXAMPLE: Authors. 2019. Title of presentation. Waste to Worth. Minneapolis, MN. April 22-26, 2019. URL of this page. Accessed on: today’s date.

Effects of Adding Clinoptilolite Zeolite on Dairy Manure Composting Mix on the Compost Stability and Maturity

The purpose of this project was to demonstrate the effects of adding natural clinoptilolite zeolites to a dairy manure compost mix at the moment of initiating the composting process on characteristics of the final compost and nitrogen (N) retention. On-farm composting of manure is one Best Management Practice (BMP) available to dairy producers. Composting reduces the volume of composted wastes by 20 to 60% and weight by 30 to 60%, which allows the final product to be significantly more affordable to transport than raw wastes. When done properly, composting can convert a considerable fraction of the N present in the raw manure into a more stable form, which is released slowly over a period of years and thereby not partially lost to the environment (Rynk et al., 1992; Magdoff and Van Es, 2009). During the manure handling and composting process, between 50 and 70% of the N can be lost as ammonia (NH3) if additional techniques are not used to increase nitrogen retention. Most of the time, manures from dairies and other livestock operations don’t have the proper carbon to nitrogen ratio (C:N) to be composted efficiently without added carbon. A balanced mix for composting should be between C:N of 30:1 to 40:1 (Rynk et al., 1992; Fabian et al., 1993). Since manures are richer in nitrogen (C:N ratios below 15:1), and bedding doesn’t add enough carbon during most of the year, a great proportion of the available N is lost as NH3 due to the lack of carbon to balance the composting process, resulting in a lower grade compost that can generate local and regional pollution due to NH3 emissions. In many arid zones there are not enough sources of carbon to balance the nitrogen present in the manure. Due to this lack of adequate carbonaceous material, additional methods to reduce the loss of N as NH3 during the composting process are needed. Several amendments have been evaluated in the past to achieve this reduction in N loss (Ndegwa et al., 2008). Zeolites are minerals defined as crystalline, hydrated aluminosilicates of alkali and alkaline earth cations having an infinite, open, three-dimensional structure. Clinoptilolite zeolite is mined in several western states including Idaho, where mining is near the dairy production areas.

This paper showcases an on-farm project that explored the effects of adding clinoptilolite to dairy manure at the time of composting as a tool to reduce NH3 emissions, retain N in the final composted product, and evaluate its effect on the final product.

What did we do?

This on-farm research was conducted at an open-lot dairy in Southern Idaho with 100 milking Jersey cows. Manure stockpiled during the winter and piled after the corral’s cleaning was mixed with fresh pushed-up manure from daily operations and straw from bedding and old straw bales, in similar proportions for each windrow. The compost mixture was calculated using a compost spreadsheet calculator (WSU-Puyallup Compost Mixture Calculator, version 1.1. Puyallup, WA). Moisture was adjusted by adding well water to reach approximately 50% to 60% moisture on the initial mix. Windrows were mixed and mechanically turned using a tractor bucket. Three replications were made for control and treatment. The control (CTR) consisted of the manure and straw mix as described. The treatment (TRT) consisted of the same mix as the control, plus the addition of 8% w/w (15%DM) of clinoptilolite zeolite during the initial mix. Windrows were actively composted for 149 days on average. Ammonia emissions were measured using passive samplers (Ogawa & Co. Kobe, Japan) and results were described in a previous Waste to Worth proceeding paper (de Haro Martí, et al. 2017). Complete initial manure (compost feedstock mix) and final screened compost nutrient lab analyses were performed for each windrow. Compost maturity tests were performed using the SOLVITA® test (Woods End Laboratories, Mt Vernon, ME). Statistical analyses were conducted using SAS 9.4 (SAS Institute, Cary, NC). Analyses included ANOVA (PROC MIXED) and paired t-test when applicable.

What have we learned?

The initial mix lab analysis revealed no significant differences in all parameters between control and treatment, except for ammonium (NH4+) where a tendency was observed. Many of the most stable parameters were very close to one another numerically, indicating a good management of the on-farm feedstock formulation and mixing. Ammonium at 553.4±100 mg/kg for CTR and 256.77±100 mg/kg for TRT showed a tendency (0.05<p≤0.1, Figure 1).

Figure 1. Ammonium ppm before and after composting   
Figure 1. Ammonium ppm before and after composting

This difference from the beginning of the process indicates that clinoptilolite has an immediate impact on NH4+ when added to the compost mix, changing the NH4+ and NH3 behavior and volatilization even during the construction of the windrow.

Nitrate (NO3) concentration in the TRT compost, 702±127 mg/kg was three times higher than the CTR, 223±127 (p= 0.05, Figure 2).

Figure 2. Nitrate ppm before and after composting

The presence of such high amount of NO3 compared to the control indicates a strong prevalence of nitrification processes (Sikora and Szmidt, 2001; Weil and Brady, 2017). Elevated NO3 concentrations are desirable in high quality compost used in plant nurseries, green houses, and horticulture, and are usually obtained from feedstock with much higher carbon content than the one used in this research. The NO3 to NH4+ ratio (NO3:NH4) in the treated windrows is also indicative of a much more stable compost than what is to be expected in a dairy compost with such low initial C:N (Sikora and Szmidt, 2001). High NO3 concentrations in compost could, however, generate a concern for NO3 leaching if the compost is not managed properly during storage and at the time of application (Miner et al., 2000; Weil and Brady, 2017). Total nitrogen (TN) on the compost was 14,933±1,379 mg/Kg (1.5%) for CTR and 11,300±1,379 mg/Kg (1.1%) for TRT (p=0.13), showing no significant difference.

Table 1. Solvita® test results on finished compost
Sample TRT or CTR

CO2
Index

NH3
Index

Maturity Index Compost Condition O2 depletion Phytotoxicity Noxious hazard pH NH4+ Estimate (ppm) N-Loss potential
W 1 CTR 6.5 3.5 5.5 Curing 1.60% Medium/ Slight Moderate /Slight 9.1 500 Moderate/Low
W 2 CTR 6.5 2 4.5 Active 2.50% High Severe 9.3 1500 M/ High
W 5 CTR 6.5 2 4.5 Active 2.50% High Severe 9.8 1500 M/ High
W 3 TRT 7 5 7 Finished 0.70% None None 9.5 <200 V Low-None
W 4 TRT 7 5 7 Finished 0.70% None None 8.9 <200 V Low-None
W 6 TRT 6 5 6 Curing 1.20% None None 9.3 <200 V Low-None

The Solvita® test results from the screened composts (Table 1) show a significant difference (p=0.007) in the NH3 test results between CTR, index 2.5±0.35 and TRT, index 5.0±0.35. Carbon Dioxide (CO2) test results showed no significant differences between CTR and TRT. All other calculated parameters showed a significant difference between control and treatment. Maturity index was 4.8±0.33 for CTR and 6.7±0.33 for TRT (p<0.02). Oxygen depletion was 0.022±0.002 for CTR and 0.009±0.002 for TRT (p<0.02). NH4+ estimate was 1167 for CTR and <200 for TRT (p=0.05). Other estimated test parameters indicate a significant difference between CTR and TRT results. Control windrows showed more unstable conditions, reaching the active or curing status, medium to high phytotoxicity, moderate to severe noxious hazard, and moderate to low N-loss potential. In contrast, treatment windrows showed more stable conditions, including reaching finished and curing status, no phytotoxicity or noxious hazard, and very low to no N-loss potential.

These results, coupled with the NO3:NH4 ratio and much higher NO3 values in the zeolite amended compost, indicate that the addition of clinoptilolite zeolite to a dairy manure compost mix in this study induced nitrification processes, produced NH4+ retention, NH3 emissions reduction, and lower oxygen depletion without significantly modifying the CO2 production. It also led to compost maturity characteristics that are regularly achieved only in compost mixes with much higher carbon content  and C:N ratios, usually associated with high quality composts. No negative effects were observed in the composting process or final product.

Future Plans

A greenhouse trial on silage corn comparing treatment and control compost effects followed. Results need to be analyzed and published.

Authors

Mario E. de Haro-Martí. Extension Educator. University of Idaho Extension, Gooding County, Gooding, Idaho. mdeharo@uidaho.edu  

Mireille Chahine. Extension Dairy Specialist. University of Idaho Extension, Twin Falls R&E Center, Twin Falls, Idaho.

Additional information


References:

de Haro-Martí, M.E., H. Neibling, M. Chahine, and L. Chen. 2017. Composting of dairy manure with the addition of zeolites to reduce ammonia emissions. Waste to Worth, Advancing Sustainability in Animal Agriculture conference. Raleigh, North Carolina.

Fabian, E. E., T. L. Richard, D. Kay, D. Allee, and J. Regenstein. 1993. Agricultural composting: a feasibility study for New York farms. Available at:  http://compost.css.cornell.edu/feas.study.html . Accessed 04/28/2011.

Lorimor, J., W. Powers, A. Sutton. 2000. Manure Characteristics. Manure Management System Series. Midwest Plan Service. MPWS-18 Section 1. Iowa State University.

Magdoff, F., & Van Es, H. (2009). Building soils for better crops – Sustainable soil management (3rd ed.). Brentwood, MD, USA: Sustainable Agriculture Research and Education program.

Miner, J. R., Humenik, F. J., & Overcash, M. R. 2000. Managin livestock wastes to preserve environmental quality (First ed.). Ames, Iowa, USA: Iowa State University Press.

Mumpton, F.A. 1999. La roca magica: Uses of Natural Zeolites in Agriculture and Industry. Proceedings of the National Academy of Sciences of the United States of America, Vol.     96, No. 7 (Mar. 30, 1999), pp. 3463-3470

Ndegwa, P. M., Hristov, A. N., Arogo, J., & Sheffield, R. E. 2008. A review of ammonia emission mitigation techniques for concentrated animal feeding operations. Biosystems Eng. (100), 453-469.

Rink, R., M. van de Kamp, G.B. Willson, M.E. Singley, T.L. Richard, J.J. Kolega, F.R. Gouin, L.L. Laliberty Jr., D.K. Dennis. W.M. Harry, A.J. Hoitink, W.F.Brinton. 1992. On-Farm Composting Handbook. NRAES-54. Natural Resource, Agriculture, and Engineering Service. Cooperative Extension. Ithaca, New York.

Sikora, L. J., & Szmidt, R. A. 2001. Nitrogen sources, mineralization rates, and nitrogen nutrition benefits to plants from composts. In P. J. Stofella, & B. A. Kahn (Eds.), Compost utilization in horticultural cropping systems (pp. 287-306). Boca Raton, Florida, USA: CRC Press LLC.

Weil, R. R., & Brady, N. C. 2017. The nature and properties of soils (Fifteenth. Global Edition ed.). Harlow, Essex, England: Pearson Education Limited.

Acknowledgements

This project was made possible through a USDA- ID NRCS Conservation Innovation Grants (CIG) # 68-0211-11-047. The authors also want to thank the involved dairy farmer and colleagues that helped during this Extension and research project. Thanks to USDA-ARS Kimberly, ID for the loan and sample analysis of the Ogawa passive samplers.

The authors are solely responsible for the content of these proceedings. The technical information does not necessarily reflect the official position of the sponsoring agencies or institutions represented by planning committee members, and inclusion and distribution herein does not constitute an endorsement of views expressed by the same. Printed materials included herein are not refereed publications. Citations should appear as follows. EXAMPLE: Authors. 2019. Title of presentation. Waste to Worth. Minneapolis, MN. April 22-26, 2019. URL of this page. Accessed on: today’s date.