
Evaluation of geospatial data for livestock operation location and estimation of manure nutrient utilization capacity in five Nebraska counties

Purpose

Livestock and poultry manure are valuable sources of organic material and nutrients for crop production and pasture growth. Nonetheless, the trend away from diversified farms has disrupted the natural nutrient recycling of manure-fertilized cropping-systems. Meanwhile, inorganic fertilizer sales in Nebraska during 2020 reached a thirty-year high. This importation of nutrients, especially nitrogen and phosphorus fertilizer to areas rich in organic fertilizer products leaves an excess of nutrients that still must be utilized and leads to higher risk for nutrient contamination of surface and groundwater sources that would reduce quality of the water.

In areas where there is a high density of livestock production, utilization of manure nutrients may require additional cropland outside the livestock operations. Moreover, the transportation and application of manure has logistical challenges that remain critical to address to motivate the local recycling of organic nutrient amendments by crop producers and livestock owners.

The present research aims to bridge this gap of knowledge by developing a clearer understanding of nutrient utilization and supply capacities through exploration of county level geospatial data.

This analysis will have two main objectives:

    1. Quantify livestock inventories, associated manure production, inorganic fertilizer imports, and potential crop nutrient utilization, and calculate nutrient surpluses or deficits in five Nebraska counties.
    2. Identify and describe the suitable land for manure applications in each of the five target counties.

What Did We Do?

The research team selected five Nebraska counties (Scottsbluff, Cuming, Custer, Nemaha, and Antelope) for their agricultural importance and diverse geographical location and characteristics. The analysis of nutrients was realized using publicly available geospatial data and governmental databases.

Objective 1. Quantify livestock inventories, associated manure production, inorganic fertilizer imports, and potential crop nutrient utilization, and calculate nutrient surpluses or deficits in five Nebraska counties.

For this research, “livestock” includes poultry, pigs, and cattle (beef and dairy). The team used data from the USDA National Agricultural Statistics Service (NASS) (Table 1) to estimate the total animal units within each category based on NASS data for sales and end-year inventory.

The scope of this assessment was limited to include only commercial production livestock operations, which were operations with at least three animal units or with more than $2,000 in sales of livestock products. To obtain an annual average number of animal units at county-level two important assumptions, based on Kellog, Lander, Moffit, & Gollehon (2000) research: (1) different cycles of confinement for each animal category (according to its spans form birth to market) ; and (2) that sales throughout the year did not have seasonal variation. Algorithms for estimating animal units, average amount of recoverable manure, and its consequent rate for nitrogen and phosphorus levels were calculated using as reference the formulas and conversion factors adapted from Kellog, Lander, Moffit, & Gollehon (2000) and Gollehon, Kellog, & Moffitt (2016).

Table 1. Input data and formulas
Data/formula Date Source
Hogs and pigs inventory and sales. 2017 USDA- NASS


Cattle and Calves inventory and sales. 2017 USDA-NASS
Poultry inventory and sales. 2017 USDA-NASS
Estimated nutrients from commercial fertilizers. 2016 NUGIS- The Fertilizer Institute
Crop production Layer 2020 USDA-NRCS-NASS
Balance of nutrient [Eq. 1]


Balance = Farm fertilizer nutrient used + Recoverable manure nutrient use – Nutrient in harvested crops 


The balance of nutrients was thus determined using Eq 1 (Table 1); where farm fertilizer is estimated by fertilizer imports at county level (NuGis database, 2016). The nutrient in harvested crops is estimated with the yield report (USDA-NRCS-NASS), and average phosphorus and nitrogen uptake and fixation rate based on literature review [1].

Objective 2. Identify and describe the suitable land for manure application for each of the five target counties.

Six suitability factors were identified for manure application: land cover, potential for phosphorus uptake, proximity to road and streets, proximity to urban areas, slope, and proximity to water bodies (Table 2). Each factor class was weighted for their impact on manure application feasibility using the Analytic Hierarchy Process (AHP) and pairwise comparison method described by Doegan, Dodd, & McMaster (1994) where factors were given scores on nine objectives (A- Reducing surface water pollution, B-Reducing ground water pollution, C- Reducing soil contamination, D- Reducing runoff loss of nutrients, E- Reducing leaching loss of nutrients, F- Avoiding excessive use of manure, G-Increasing nutrient use efficiency, H-reducing cost of manure application, I- Reducing bad odor) through an objectives-oriented comparison (OOC) which values were adapted form Basnet, Apan, & Raine (2001) (Table 3).

Table 2. Input factors and constraints.
 

Input Factors


Data type

Excluded land
Land cover National Land Cover Database Other land cover besides cropland
Potential uptake of cropland-P2O5 Cropland Data Layer (CDL) Grasslands, pastures, developed spaces, natural ecosystems.
Proximity to developed/urban areas National Land Cover Database Area less than 100 ft
Proximity to road and streets TIGER Primary and secondary roads and streets > 35 ft
Slope DEM of Nebraska’s County > 10%
Proximity to water bodies National Hydrography Dataset > 35 ft


Table 3. Weight distribution using an AHP process.
Land cover Criteria Weight
Potential uptake of cropland-P2O5 36
Proximity to developed/urban areas 6
Proximity to road and streets 6
Slope 20
Land cover 26
Proximity to water bodies, rivers and streams 6
*Consistency ratio of weight distribution= 0.00 (This range is a measure if the reliability of the comparison and should be <0.1)

[1] (Warncke, Dahl, & Zandstra, Nutrient Recommendations for Vegetable Crops in Michigan, 2004)(Kang, et al., 2020)(Meena, Kumar, Dhar, Paul, & Kumar, 2015)(Grains Research & Development Corporation, 2018)(Fertilizer Canada, 2001)(Grains Reseach & Development Research, 2018)Manitoba Government. (2009).(Barker, 2019) and ((Barker, 2017)(Warncke, Dahl, & Jacobs, 2009)(Sullivan, Peachey, Heinrich, & Brewer, 2020)(Grains Research & Development Corporation, 2018)(Sullivan, Peachey, Heinrich, & Brewer, 2020)International Plant Nutrition Institute (2013)).

What Have We Learned?

Objective 1.

The total balance of nutrients for each county showed that even though none of the counties we assessed have a surplus of nutrients at the county level, some of them are very close to meeting or surpassing the capacity of the land in the county to utilize additional nutrients. Of the five counties, Cumming county has the lowest phosphorus assimilation available at the county level, followed by Nemaha, Antelope, Custer, and Scotts Bluff. Balance nutrients showed a lower assimilation capacity on phosphorus than nitrogen. Since phosphorus is a nutrient limiting the growth of aquatic organisms and reduction on water quality, it was important to represent the potential phosphorus sinks at the geospatial level for Objective 2 (Figures 1 and 2).
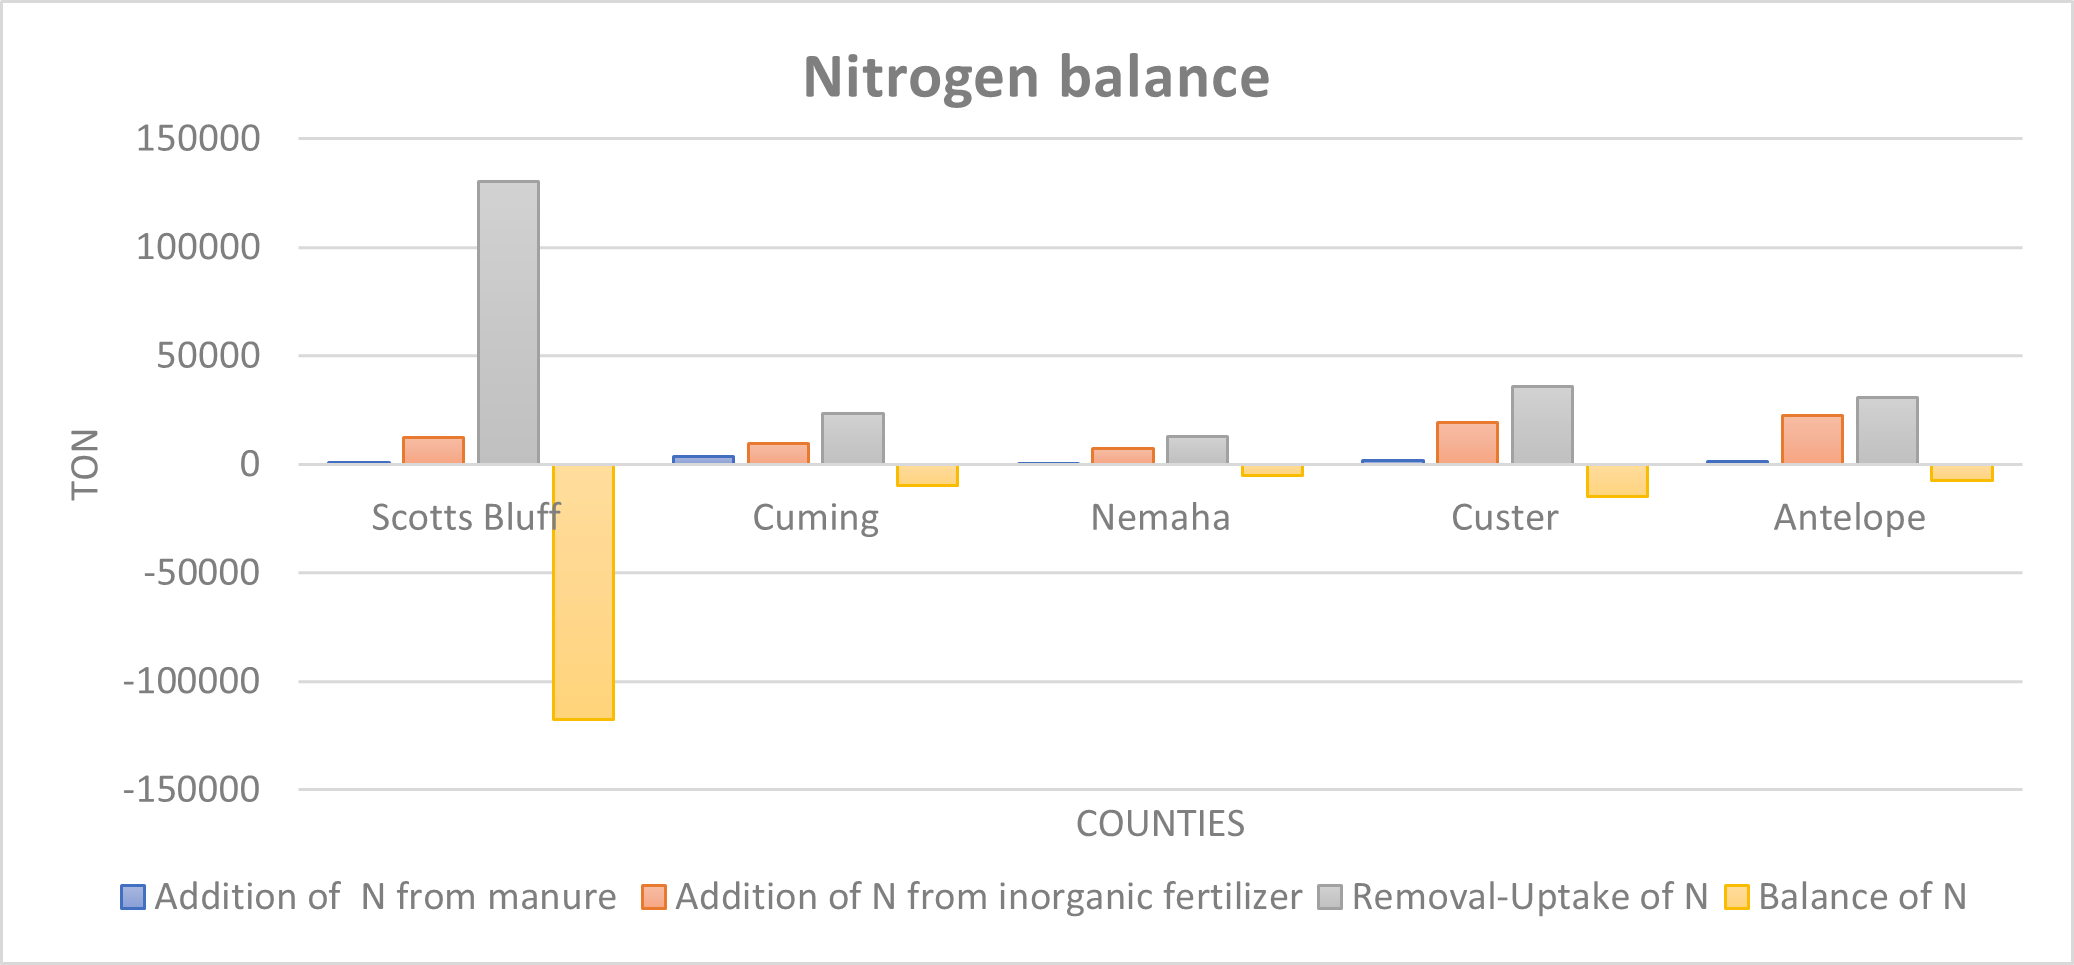
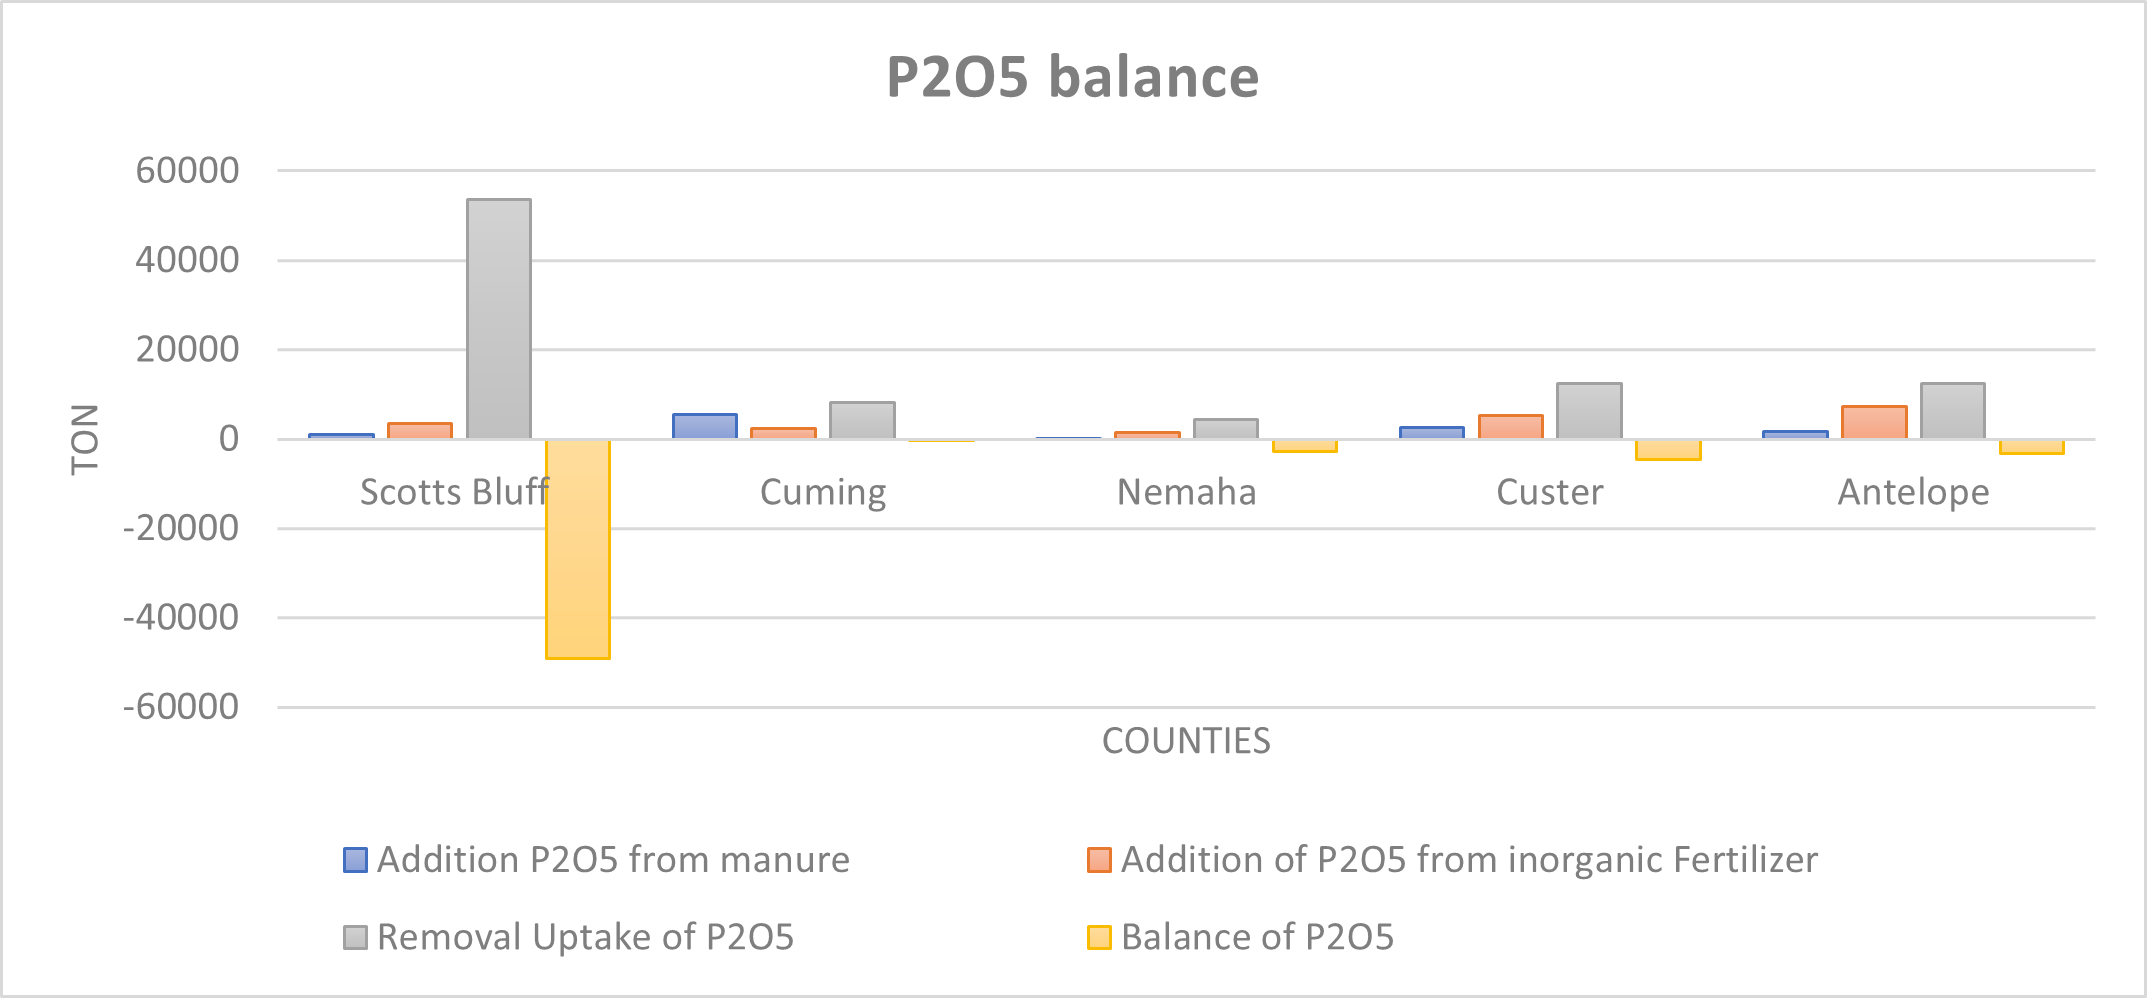
Figure 1. County level nitrogen balance.


Figure 2. County level P2O5 balance.

Objective 2.

The area suitable for manure application in the five counties was mapped (Figure 3) with the Weighted Overlay Raster tool, on ArcGis Pro 2.9.1. This allowed the researchers to incorporate multicriteria effects with a weight for each factor. The results are summarized in Table 4 and present the proportion of land in each county that is either not suitable for manure application, has a marginal (medium) suitability, or is very suitable (high).  These classifications were determined by natural breaks (Jenks) classification which partitioned data into classes based on natural groups in the data distribution.

We recognize that land suitable for manure application is closely associated with acres in crop production, which for Custer and Scottsbluff Counties is less than 50% of the total acres. Whereas Cuming County had the highest percentage of area dedicated to crop production, which explains the high proportion of “High suitability land”. The category of “Medium suitability” has the lowest percentage for all counties because it is mainly driven by differences in low and medium potential phosphorus uptake, based on crop type and area destinated for crop production, which are regularly more spatially scarce in vegetation patches.

Figure 3. Suitable land for manure application.


Future Plans

    • Validate the model of suitable land for manure application by checking the available data for manure production, cropland areas and slope with other official sources, and taking random samples among the counties to compare the results under field conditions.
    • Incorporate a socio-economic analysis for manure transportation among and within different counties.
    • While the county level context and characteristics have value, it would increase the accuracy of the model if more information about individual and smaller scale farms and animal feeding operations could be geospatially available. Thus, where possible, it is the researcher’s goal to improve the current analysis with the addition of more accurate data on animal operations within each county to adjust the estimation of manure production, and the nutrients balance.
    • Promote Outreach efforts with farmers for making decisions based on a nutrient management approach that could decrease the importation of inorganic fertilizers, where possible.

Authors

Presenting author

María José Oviedo, Graduate Research Assistant, University of Nebraska-Lincoln

Corresponding author

A. Millmier Schmidt, Associate Professor & Livestock Manure Management Engineer, University of Nebraska-Lincoln

Corresponding author email address

aschmidt@unl.edu

Additional authors

A. Millmier Schmidt, Associate Professor & Livestock Manure Management Engineer, University of Nebraska-Lincoln; J. Iqbal, Assistant Professor, University of Nebraska-Lincoln; A. Yoder, Associate Professor, University of Nebraska Lincoln; and B. Maharjan, Assistant Professor, University of Nebraska Lincoln

Additional Information

Basnet, B. B., Apan, A. A., & Raine, S. R. (2001). Selecting Suitables Sites for Animal Waste Application Using Raster GIS. Environmental Management, 519-531.

Cassman, K., Dobermann, A., & Walters, D. (2002). Agroecosystems, Nitrogen-use Efficiency, and. Agronomy & orticulture– Faculty Publications, 356.

Fergunson, R. (2015). Groundwater Quality and NItrogen Use Efficiency in Nebraska’s Central Platte River Valley. Journal of Environmental Quality.

Gollehon, N., Caswell, M., Ribaudo, M., Kellog, R., Lander, C., & Letson, D. (2011). Confined Animal Production and Manure Nutrients. Washington, DC: Resource Economics Division, Economic Research Service, U.S. Department of.

Kellog, R. L., Lander, C. H., Moffit, D. C., & Gollehon, N. P. (2000, Diciembre). Manure Nutrients Relative to the Capacity of Cropland and Pastureland to Assimilate Nutrients. Retrieved from USDA: www.nhq.nrcs.usda.gov/land/index/publication.html

Nebraska Agriculture Department. (2021). Nebraska Agriculture Fact Card. Retrieved from https://nda.nebraska.gov/facts.pdf#:~:text=In%202020%2C%20Nebraska%20ranked%20second%20in%20ethanol%20production,operations%20were%20found%20on%2048%25%20of%20Nebraska%20farms.

Nebraska Department of Agriculture. (2020). Nebraska Fertilizer, Soil Conditioner and Ag Lime Tonnage and Sampling Reprot Calendar year 2020. Lincoln: nda.nebraska.gov.

Spiegal, S., Kleinman, P., Endale, D., Bryan, R., Dell, C., Goslee, S., . . . Gowda, e. a. (2020, June). Manuresheds: Advancing nutrient recycling in US agriculture. Agricultura Systems 182, 102813. doi:https://doi.org/10.1016/j.agsy.2020.102813

Doegan, H. A., Dodd, F. J., & McMaster, T. B. (1994). A Statistical Approach to Consistency in AHP. Marh.Comput.Modelling., 19-22.

Barker, B. (2017, April 4). Moderate flax response to nitrogen. Top Crop Manager. Retrieved from https://www.topcropmanager.com/moderate-flax-response-to-nitrogen-19985/#:~:text=Generally%2C%20flax%20takes%20up%202.83,sensitive%20to%20seed%2Dplaced%20fertilizer.

Barker, B. (2019, December 3). Managing phosphorus in flax. Top Crop Manager. Retrieved from https://www.topcropmanager.com/managing-phosphorus-in-flax/

Fertilizer Canada. (2001). Phosphorus Management for Pulses. Canola Council of Canada. Retrieved from https://www.canolacouncil.org/download/2042/canola-watch/14659/cfi_nutrient_uptake_for_wcanada_2001

Grains Reseach & Development Research. (2018). Grownotes: Chickpea-Section 5. Grains Reseach & Development Research. Retrieved from https://grdc.com.au/__data/assets/pdf_file/0030/369444/GrowNote-Chickpea-West-5-Nutrition.pdf

Grains Research & Development Corporation. (2018). Grownotes: Lentils- Section 7. Grains Research & Development Corporation. Retrieved from https://grdc.com.au/__data/assets/pdf_file/0028/366166/GrowNote-Lentil-West-7-Nutrition-Fertiliser.pdf

Grains Research & Development Corporation. (2018). Grownotes: Triticale-Section 5. Grains Research & Development Corporation. Retrieved from https://grdc.com.au/__data/assets/pdf_file/0025/370645/GrowNote-Triticale-South-05-Nutrition.pdf

Kang, F., Wang, Z., Xiong, H., Li, Y., Wang, Y., Fan, Z., . . . Zhang, Y. (2020). Estimation of Watermelon Nutrient Requirements based on the QUEFTS Model. Agronomy, 1776. Retrieved from file:///C:/Users/Majo/Downloads/agronomy-10-01776-v2.pdf

Manitoba Government. (2009). Calculating Manure Application Rates. Manitoba Provin. Retrieved from https://www.gov.mb.ca/agriculture/environment/nutrient-management/pubs/mmf_calcmanureapprates_factsheet.pdf

Meena, B. P., Kumar, A., Dhar, S., Paul, S., & Kumar, A. (2015). Productivity, nutrient uptake and quality of popcorn and potato in relation to organic nutrient management practices. ICAR-Indian Agricultural Research Institute, 110 012.

Sullivan, D. M., Peachey, E., Heinrich, A., & Brewer, L. J. (2020). Nutrient and Soil Health Management for Sweet Corn (Western Oregon). Oregon State University. Retrieved from https://catalog.extension.oregonstate.edu/sites/catalog/files/project/pdf/em9272.pdf

Warncke, D., Dahl, J., & Jacobs, L. (2009). Nutrient Recommendations for Field Crops in Michigan. Michigan State University. Retrieved from https://www.canr.msu.edu/fertrec/uploads/E-2904-MSU-Nutrient-recomdns-field-crops.pdf

Warncke, D., Dahl, J., & Zandstra, B. (2004). Nutrient Recommendations for Vegetable Crops in Michigan. Michigan State University.

Merits of Manure Content Library

Purpose

The right amount of animal manure in the right location can benefit crops, soil, and water resources.  However, too much manure or manure in the wrong place is an environmental concern.  A recent survey of attitudes from farmers and their advisors on the benefits and barriers for manure use indicates that there is widespread knowledge of manure value for cropping systems, but logistical and community barriers remain. The survey also found that all respondents rated peer-to-peer interactions as the most influential on their decision-making for these topics. Thus, more extension efforts should be focused in assisting AFO managers and advisors to communicate messages on the value of manure and strategies for overcoming barriers, among their specific networks. For example, knowledge of the relationship of manure and soil health benefits is low among some segments. Farmers and their advisors all have very low opinions and understanding of manure’s benefits to environmental quality. Helping farmers, educators, and advisors articulate among themselves and to their rural communities the water quality benefits of organic fertilizers when applied to only meet agronomic needs of the crop may need expanded investments. With these needs in mind a team from the Universities of Nebraska, Minnesota, and Iowa State, and the assistance of the North Central Region Sustainable Agricultural Research and Education program developed a library to provide educators and advisors with access to recommended resources that will assist in the discussion of manure’s benefits and challenges.

What Did We Do?

Consultation among the team identified the following categories of interest for readily accessible educational or outreach materials for manure impacts on:

    1. Soil health and soil quality
    2. Economics of production and yield
    3. Crop fertility
    4. Water quality
    5. On-farm research

And guidance to navigating barriers such as:

    1. Direct costs associated with manure use
    2. Odor and other community issues
    3. Agronomic challenges (such as imbalance nutrients)
    4. Regulations
    5. Logistical issues of application
    6. Using manure in specialty systems (such as organic production)

With the categories for materials established, the team conducted an initial survey of extant educational and outreach materials via general internet searches and review of content available through the Livestock and Poultry Environmental Learning Community. The types of content thus assembled were varied: social media content, video, summaries of research, published extension and scientific journal articles, websites, and other content such as podcasts and decision support tools. All were included since it was intended that these resources be helpful for educators, producers, or others to converse with their own networks easily and confidently on the manure topics identified. The team anticipated that users could use the library to expand their social media activity, and thus their communication networks, or to prepare more confidently to discuss manure via a local radio presentation or discussion with a county board. Or even to add an article to local print media or a blog or personal website. All items included in the library were free to repurpose (with attribution) in local outlets or personal sites.

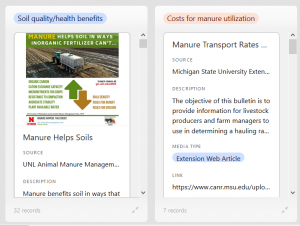
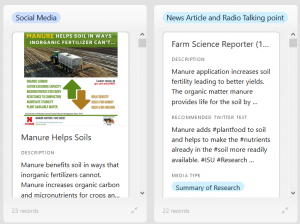
After consultation, the library was built using Airtable ™, a platform to create low-code databases, tools, or other apps. This platform allows the team to internally build a flexible database of content which can be sorted easily into pre-set categories (for example, topics of specific seasonal relevant), and arrange content into easily perused views to improve the user experience on a platform that could be easily embedded into existing team sites, such as lpelc.org (Figure 1).

Figure 1. The user interface for the merits of manure library, several such sorted views are embedded on the LPELC website for audience exploration by topic, media type, or seasonal relevance. Within each view individual entries can be further searched or sorted to further narrow exploration.

Each entry (Figure 2) in the library has an individual entry card, which includes keywords and text descriptions to improve searchability as well as a downloadable file, or links to the resource where appropriate, and a short example of how this material could be shared in the user’s social media network (recommended twitter text). The team intended to provide library users with not only the educational content, but also the means to improve their own in-network communication on manure topics. Accordingly, when posting to social media, hashtags, mentions and links to other content help (a) reach users who are following a specific topic (e.g., #manure), (b) recognize someone related to the post (e.g., @TheManureLady) and (c) direct users to more content related to the graphic (e.g., URL to online article). For our content library, each item is accompanied by recommended text that can be copied and pasted into the post of a social media engine if desired.

Figure 2. A single-entry page for the library.

What Have We Learned?

Since its launch in 2021 the library has had 343 unique users, average time that each user spends interacting with the library is 129 seconds, a solid interaction time for a website – industry standard is 120-180 seconds. However, we do not have any measure for how time spent on the library page is transformed into use of the library content. It is evident that more work is needed to improve awareness of the tool among audiences of interest. To this end, the team decided to develop a recognizable brand for library materials which might help other potential users to find their way to the site (Figure 3).

Figure 3. Library logo.

Future Plans

Library administrators continue to look for ways to improve the library content, user experience, and awareness of the tool among potential users. An overview of content, accessibility, re-purposing, and submission of relevant material will be shared to publicize the resource, encourage utilization of available materials, and invite submissions of new content relevant to the manure management community.

Authors

Amy Schmidt, Associate Professor, University of Nebraska

Corresponding author email address

aschmidt@unl.edu

Additional authors

Leslie Johnson, Associate Extension Educator, Mara Zelt, Schmidt Lab Project Director, Amber Patterson, Schmidt Lab Media Communications Specialist, and Rick Koelsch, Professor Emeritus, University of Nebraska-Lincoln; Erin Cortus, Associate Professor, and Melissa Wilson, Assistant Professor, University of Minnesota; and Dan Andersen, Associate Professor, Iowa State University

Additional Information

The full library is accessible at https://lpelc.org/value-of-manure-library/.

Acknowledgements

This product was assembled with financial assistance from the North Central Region Sustainable Agricultural Research and Education program.  NCR-SARE is one of four regional offices that run the USDA Sustainable Agriculture Research and Education (SARE) program, a nationwide grants and education program to advance sustainable innovation to American agriculture.

Value of Manure Library By Season

Winter

Spring

Summer

Fall

Authors/Sponsors

The project team assembling this product includes Amy Schmidt, Leslie Johnson, and Rick Koelsch, University of Nebraska-Lincoln; Erin Cortus and Melissa Wilson, University of Minnesota; and Dan Andersen, Iowa State University. These resources represent our recommendations for discussing the Value of Manure.

This product was assembled with financial assistance from the North Central Region Sustainable Agricultural Research and Education program. NCR-SARE is one of four regional offices that run the USDA Sustainable Agriculture Research and Education (SARE) program, a nationwide grants and education program to advance sustainable innovation to American agriculture.

Value of Manure Library By Media Type

Media types include social media, news articles, web pages, educational publications, decision support tools, and recommended research articles.

Authors/Sponsors

The project team assembling this product includes Amy Schmidt, Leslie Johnson, and Rick Koelsch, University of Nebraska-Lincoln; Erin Cortus and Melissa Wilson, University of Minnesota; and Dan Andersen, Iowa State University. These resources represent our recommendations for discussing the Value of Manure.

This product was assembled with financial assistance from the North Central Region Sustainable Agricultural Research and Education program. NCR-SARE is one of four regional offices that run the USDA Sustainable Agriculture Research and Education (SARE) program, a nationwide grants and education program to advance sustainable innovation to American agriculture.

Value of Manure Library By Topic Area

Topics include agronomics, economics and yield, soil health/quality, water quality, organic systems, neighbors, regulations and logistics.

Authors/Sponsors

The project team assembling this product includes Amy Schmidt, Leslie Johnson, and Rick Koelsch, University of Nebraska-Lincoln; Erin Cortus and Melissa Wilson, University of Minnesota; and Dan Andersen, Iowa State University. These resources represent our recommendations for discussing the Value of Manure.

This product was assembled with financial assistance from the North Central Region Sustainable Agricultural Research and Education program. NCR-SARE is one of four regional offices that run the USDA Sustainable Agriculture Research and Education (SARE) program, a nationwide grants and education program to advance sustainable innovation to American agriculture.

Value of Manure Library Grid View

Authors/Sponsors

The project team assembling this product includes Amy Schmidt, Leslie Johnson, and Rick Koelsch, University of Nebraska-Lincoln; Erin Cortus and Melissa Wilson, University of Minnesota; and Dan Andersen, Iowa State University. These resources represent our recommendations for discussing the Value of Manure.

This product was assembled with financial assistance from the North Central Region Sustainable Agricultural Research and Education program. NCR-SARE is one of four regional offices that run the USDA Sustainable Agriculture Research and Education (SARE) program, a nationwide grants and education program to advance sustainable innovation to American agriculture.

Value of Manure Library for Educators and Advisors

Purpose

Manure is a resource that comes with many benefits and challenges.  This library is designed to provide educators and advisors with access to recommended resources that will assist you in your discussion of manure’s benefits and challenges.  Educators, please feel free to share and re-purpose educational products in this library with local audiences. Advisors, the library’s resources shall provide you with decision tools and educational products for enriching your discussions with clientele and rural community residents.

How to find materials

For those seeking specific resources, materials are organized visually by topic area and type of media. For those that would rather search materials more linearly, there is a grid version available.

In all views, there is a search button in the top right corner that looks like a magnifying glass and an expansion button that looks like two outward pointing arrows to view in full screen.

By Topic Area

Preview of manure value library database sorted by topic.
    • Manure as a fertilizer
    • Manure economics
    • Soil quality/health effects
    • Water quality effects
    • Use in organic systems
    • Neighbors
    • Regulatory concerns
    • Logistics

By Media Type:

Preview of manure value library database sorted by purpose.
    • Social media
    • Short news articles and web pages
    • Educational publications
    • Decision support tools
    • Recommended research articles


Instructions for Re-purposing Educational Content

Our team encourages and welcomes educators and advisors re-purposing of many of the social media and web page/news article resources found in this library.  Would these resources be helpful to you for Tweeting to your followers? Assembling talking points for a local radio presentation or discussion with a county board?  Or adding an article to local print media or your blog?

Example of social media graphic to be re-purposed.
    • Twitter Posts:  A broad range of Twitter posts, graphics with an educational message and short text introduction, are included for use with your social media connections.  Please re-purpose these for your local use. We ask that you maintain the “N Extension” and “WSA” logos in your re-purposed post.  You may replace the “Manure Happens. Take Credit” caption and the “Learn more at: http:// ________”  with an appropriate recognition of your organization and/or a web page that you would like to promote.
    • Web Page/News Articles:  Many of these library products can be repurposed for a variety of local uses.  News articles and web pages may be revised to add local information with the new authors name included if the original authors continue to be listed.
    • Any Educational Products:  Any of the Library resources may be used as talking points for a local radio broadcast or community group presentations. Please recognize the original authors and resource title in your presentation.


Is something missing from our library?

We welcome your suggestions of resources that you have found beneficial in your educational or advisory role.  Please email any of the project team members with your suggestions or submit them via our google form for our consideration.

Authors/Sponsors

The project team assembling this product includes Amy Schmidt, Leslie Johnson, and Rick Koelsch, University of Nebraska-Lincoln; Erin Cortus and Melissa Wilson, University of Minnesota; and Dan Andersen, Iowa State University.  These resources represent our recommendations for discussing the Value of Manure.

This product was assembled with financial assistance from the North Central Region Sustainable Agricultural Research and Education program.  NCR-SARE is one of four regional offices that run the USDA Sustainable Agriculture Research and Education (SARE) program, a nationwide grants and education program to advance sustainable innovation to American agriculture.

Transforming Manure from ‘Waste’ to ‘Worth’ to Support Responsible Livestock Production in Nebraska

The University of Nebraska – Lincoln (UNL) Animal Manure Management (AMM) Team has supported the environmental stewardship goals of Nebraska’s livestock and crop producers for many years using multiple traditional delivery methods, but recently recognized the need to more actively engage with clientele through content marketing activities. A current programming effort by the AMM Team to increase efficient manure utilization on cropland in the vicinity of intensive livestock production is the foundation for an innovative social media campaign.

What did we do?

content marketing plan
Figure 1. Content marketing plan to direct traffic to the AMM Team website.

While traditional extension outputs remain valuable for supporting the needs of clientele who actively seek out information on a topic, “content marketing” is a strategic tactic by which information is shared to not only attract and retain an audience, but to drive impactful action. Social media platforms are popular tools for delivery of current, research-based information to clientele; a key barrier to effectively using social media for content marketing by the project directors has been time. For instance, using Twitter efficiently requires regular attention to deliver messages frequently enough to remain relevant and to do so at times when user activity characteristics demonstrate the greatest opportunity for posts to be viewed and disseminated. Because this proved to be a challenge, a content marketing plan (Figure 1) was initiated using “waste to worth” as the topic of focus.

Three major components were identified as being critical to the success of the project (Figure 2): design of high-quality graphics that are tied to online content and resources and are suitable for use on Twitter, Facebook, or other social media platforms; development of a content library containing packaged content (graphic + suggested text for social media posts) that is easy to navigate and available for partners to access and utilize; and development  of a communication network capable of reaching a broad audience.

Graphics

circles containing graphics, content library and communication network
Figure 2. Components identified for successful content marketing effort.

An undergraduate Agricultural Leadership, Education and Communication (ALEC) student was recruited to support graphical content development using three basic guidelines: 1) Eye-catching but simple designs; 2) Associated with existing content hosted online; and 3) Accurate information illustrated Canva.com was utilized by team members  to design, review and edit social media content (Figure 3).

Content Library

Completed graphics are downloaded from Canva as portable network graphics (*.png) and saved to Box folders, by topic, using a descriptive title. When posting to social media, hashtags, mentions and links to other content help (a) reach users who are following a specific topic (e.g. #manure), (b) recognize someone related to the post (e.g. @TheManureLady) and (c) direct users to more content related to the graphic (e.g. URL to online article). For our content library, each graphic is accompanied by a file containing recommended text (Figure 4) that can be copied and pasted into Twitter or Facebook.

content example graphics
Figure 3. Graphical content examples for the “waste to worth” project
content example with sample text
Figure 4. Sample text to accompany a related image when posting on social media

Communication Network

content distribution network diagram
Figure 5. Content distribution network diagram.

Disseminating our messages through outlets outside the University was identified as a critical aspect of achieving the widespread message delivery that was desired. As such, agricultural partners throughout Nebraska were asked to help “spread the word about spreading manure” by utilizing our content in their social media outputs, electronic newsletters, printed publications, etc. Partners in this project include nearly 30 livestock and crop commodity organizations, media outlets, agricultural business organizations, and state agencies in Nebraska (Figure 5).

The effort to distribute content through the established communication network was launched in September 2018. Each month, three to four graphics with accompanying text are placed in a Box file to which all partners in the distribution network have access. Partners are notified via e-mail when new content is released. Folders containing prior months’ releases remain available to allow partners to re-distribute previous content if they wish.

What we have learned?

Since launching, 34 partnering organizations (Figure 6) have helped disseminate content to 50,000+ producers, advisors, allied industry members, and related professionals each month. Invited media appearances (radio and television) by team members have increased substantially in the past six months. For instance, the Nebraska Pork Producers Association hosts a weekly “Pork Industry Update” on a radio station that is part of the Rural Radio Network. Team members have recorded numerous interviews for broadcast during this weekly programming spot.

parter organizations
Figure 6. Partner organizations contributing to content distribution.

Page views within the AMM Team’s website (manure.unl.edu) increased by 139% from the fourth quarter of 2017 to the fourth quarter of 2018. Additional analytics are being collected to better define routes by which traffic is reaching the AMM Team’s website.

Future Plans

A survey is being prepared for distribution to audiences targeted through this project to assess impacts of this effort on changes in knowledge and behavior related to responsible use of manure in cropping systems, recognition of the AMM Team as a trusted source for manure and nutrient management information in Nebraska, and quality of AMM Team outputs.

Author

Amy Millmier Schmidt, Associate Professor, Biological Systems Engineering and Animal Science, University of Nebraska-Lincoln (UNL), aschmidt@unl.edu

Co-authors

Rick Koelsch, Professor, Biological Systems Engineering and Animal Science, UNL

Abby Steffen, UG Student, Ag Leadership, Education and Communication, UNL

Additional Information

Sign up for monthly notifications about new content from the UNL Animal Manure Management team at https://water.unl.edu/newsletter. Follow team members and the AMM Team.

Animal Manure Management Team    Amy Schmidt

Twitter: @UNLamm    Twitter: @TheManureLady

Facebook: https://www.facebook.com/UNLamm/    Facebook:  https://www.facebook.com/TheManureLady/


Rick Koelsch

Twitter: @NebraskaRick

Acknowledgements

Funding sources supporting this effort include We Support Ag, the Nebraska Environmental Trust, and the North Central Sustainable Agricultural Research and Education (NC-SARE) program.


The authors are solely responsible for the content of these proceedings. The technical information does not necessarily reflect the official position of the sponsoring agencies or institutions represented by planning committee members, and inclusion and distribution herein does not constitute an endorsement of views expressed by the same. Printed materials included herein are not refereed publications. Citations should appear as follows. EXAMPLE: Authors. 2019. Title of presentation. Waste to Worth. Minneapolis, MN. April 22-26, 2019. URL of this page. Accessed on: today’s date.