
Soil Amendments Reduced Herbicides Mobility into Agricultural Runoff

Waste to Worth: Spreading science and solutions logoWaste to Worth home | More proceedings….

Abstract

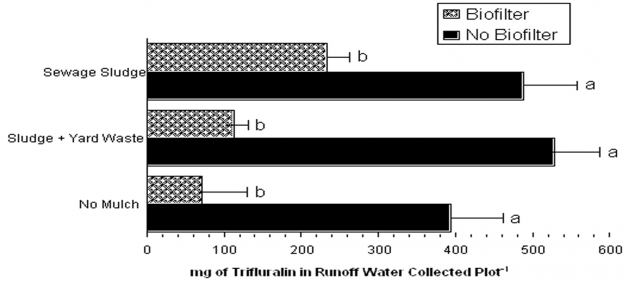
Recycling waste such as municipal sewage sludge (SS) and yard waste (YW) for use as low-cost fertilizer resulted in positive effects on the growth and yield of vegetable crops. Eighteen runoff plots were established at Kentucky State University research farm (Franklin County, KY) to study the impact of soil amendments on reducing surface runoff water contamination by residues of dimethazone and trifluralin herbicides arising from agricultural fields. Three soil management practices: municipal sewage sludge (SS), SS mixed with YW, and no-mulch rototilled bare soil were used to monitor the impact of soil amendments on herbicide residues in soil following natural rainfall events. Biobeds (a soil cavity filled with a mixture of wheat straw, peat moss, and top soil) reduced dimethazone and trifluralin by 84 and 82%, respectively in runoff water that would have been transported down the land slope of agricultural fields and contaminate natural water resources. Biobeds installed in SS and SS+YW treatments reduced dimethazone by 65 and 46% and trifluralin by 52 and 79%, respectively. We concluded that soil amendments could be used to intercept pesticide-contaminated runoff from agricultural fields, creating optimum conditions for sorption and biodegradation such that the amount of pesticides adjacent to water bodies is significantly reduced. This practice might provide a potential solution to pesticide contamination of surface and seepage water from farmlands.

What Did We Do?

Eighteen runoff plots were established at Kentucky State University research farm to study the impact of soil amendments on reducing surface runoff water contamination by residues of dimethazone and trifluralin herbicides arising from agricultural fields.The field trial area was established on a Lowell silty loam soil (pH 6.7, 2% organic matter) of 10% slope located at the Kentucky State University (KSU) Research Farm (Franklin County, KY). The farm is located in the Kentucky River Watershed in the Blue Grass Region. Eighteen (18) field plots of 3.7 m wide and 22 m long each were installed with stainless steel borders along each side to prevent cross contamination between adjacent treatments. A gutter was installed across the lower end of each plot with 5% slope to direct runoff to the tipping buckets and collection bottles for runoff water measurement. At the bottom of each plot, a pan lysimeter (n=18) of 1.5 m deep was installed for collecting infiltration water following natural rainfall events.

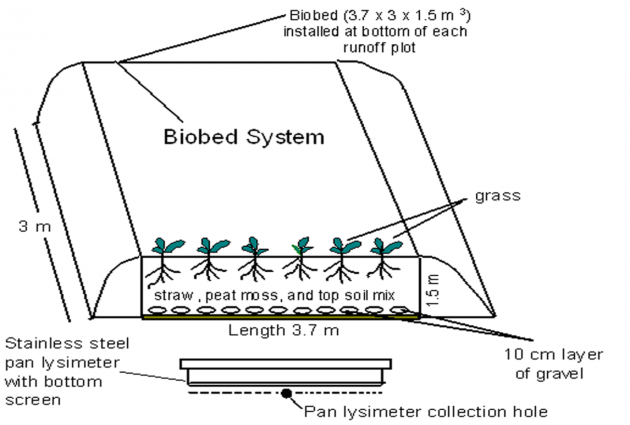
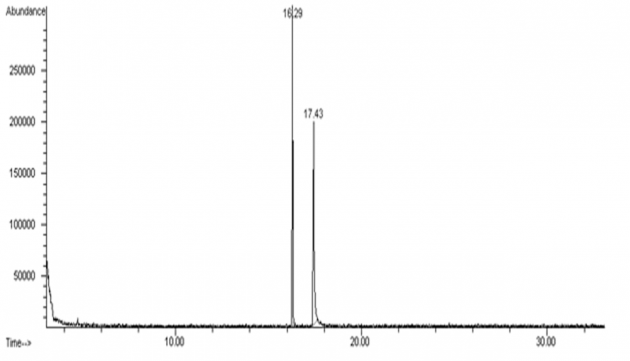
At the lower end of each of nine experimental plots, nine biobed systems were installed (Figure 1.). Three soil management practices were used in experimental plots: 1) municipal sewage sludge obtained from Metropolitan Sewer District, Louisville, KY was mixed with yard waste compost (obtained from Con Robinson Company, Lexington, KY) and incorporated into native soil at 15 t acre-1 (on dry weight basis) with a plowing depth of 15 cm, 2) municipal sewage sludge  was mixed with native soil at 15 t acre-1 (on dry weight basis) with a plowing depth of 15 cm, and 3) a no-mulch (NM) control treatment (roto-tilled bare soil) was used for comparison purposes. The soil in the experimental area was sprayed with a mixture of dimethazone (Command 3ME) and trifluralin (Treflan) formulations at the recommended rates of application in Kentucky. [1] Seedlings of muskmelon (Cucumis melo cv. Athena) and bell pepper (Capsicum annuum cv. Artistotle) were planted with 25 and 60 cm in-row spacing, respectively. Runoff water under three natural rainfall events was collected and quantified at the lower end of each plot throughout the growing season using tipping-bucket runoff metering apparatus. Pan lysimeters were used to monitor the presence or absence of pesticide residues in the vadose zone, the unsaturated water layer below the plant root. Trifluralin and dimethazone were extracted with 150 mL of a mixture of methylene chloride [CH2Cl2] + acetone (6:1, v/v) using liquid-liquid partition. Concentrated extracts were injected into a gas chromatograph (GC) equipped with flame ionization detector (FID). The gas chromatograph (HP 5890, Hewlett Packard) was equipped with a 30-m (0.23-mm diameter, 0.33-µm film thickness) fused silica capillary column with HP-5 (5% phenyl polysiloxane, 95% methyl polysiloxane) liquid phase. Operating conditions were 230, 250, and 280 °C for injector, oven, and detector, respectively. Under these conditions retention times (Rt) of trifluralin and dimethazone averaged 16.29 and 17.43 min, respectively (Figure 2).

Figure 1. Schematic diagram of a slot-mulch biobed system. Note that a pan lysimeter is installed at the bottom of each biobed system to collect infiltration water and monitor herbicide mobility.

Figure 2. Gas chromatographic (GC) chromatograms of native soil extracts prepared in acetonitrile: hexane: methanol (45:45:10 v/v) at 1 h (upper graph) and 3 d (lower graph) following spraying with a mixture of Clomazone and Treflan formulations at the recommended rate of application

What Have We Learned?

Herbicide residues detected in soil and water (Figures 3 & 4) were confirmed using gas chromatography (GC)/mass spectrometry (GC/MS) (Hewlett Packard Model 5971a). The increased organic matter content of soil due to the addition of soil amendments (SS and SS mixed with YW compost) increased the concentration of dimethazone and trifluralin retained in soil. Dimethazone residues extracted from SS and SS+YW compost increased by 14 and 50%, respectively compared to no-mulch soil. Similarly, trifluralin residues increased by 17 and 75% in SS and SS mixed with yard waste, respectively, compared to no-mulch native soil. This could be explained by the adsorption properties of dimethazone on soil particles [2] that varied with increasing percentages of organic matter following the addition of amendments as well as the partial degradation of dimethazone by soil microbes. [3] Loux et al. [2] proposed hydrophobic bonding to organic matter to be the primary mechanism of dimethazone sorption and that bioavailability and dissipation of dimethazone in soil are determined by dimethazone adsorption properties. Yard waste compost contains significant concentrations of humic acid, the main constituent of soil organic matter. Functional groups in humic acid, namely carboxylic and phenolic groups appeared to be the principle sites for the adsorption and interaction with trifluralin. [4]

Table 1. indicated that the soil binding property (Koc) of dimethazone is 150-562 mL g-1 while Koc of trifluralin is 8,000 mL g-1. Greater Koc values of trifluralin indicated a tighter binding to the soil particles. Plots amended with SS+YW mix increased volume of water percolated into the vadose zone by 55% compared to no-mulch treatments. Plots with biofilters also increased the volume of water percolated into the vadose zone. This increase was greatest (44%) in SS+YW treatments.  This increase could be attributed to the reduced bulk density and increased soil particle interspaces after addition of yard waste compost. As indicated previously, water solubility, vapor pressure, and Koc value of a pesticide have a great impact on its mobility and distribution in the environment. Dimethazone residues in infiltration water were reduced from 0.5 to 0.31 mg plot-1 (38 % reduction), while trifluralin residues were reduced from 17.7 to 7.3 mg plot-1 (60 % reduction). This is attributed to the presence of biobeds (biofilters) as well as the physical and chemical characteristics of each of the two herbicides that vary from the high water solubility and low Koc values of dimethazone to the low water solubility and high Koc values of trifluralin (Table 1).

Figure 3. Dimethazone residues in runoff water (upper graph) and trifluralin residues in runoff water (lower graph) collected down the land slope under three soil management practices. Each plot is 3.7 m x 22 m long (0.02 acre). Statistical comparisons were done between plots with biofilters and plots with no biofilters.

Figure 4. Dimethazone residues in infiltration water (upper graph) and trifluralin residues in infiltration water (lower graph) collected under three soil management practices. Statistical comparisons were done between plots with biofilters and plots with no biofilters.

Future Plans

Future objectives will be to test the performance of biobed systems in reducing trace-elements mobility from soil amendments into runoff and seepage water.

Authors

George F. Antonious, Professor, Kentucky State University –College of Agriculture, Food Science, and Sustainable Systems- Division of Environmental Studies and Sustainable Systems, Frankfort, KY 40601, USA george.antonious@kysu.edu

Eric T. Turley, Co-Investigator, Kentucky State University-College of Agriculture, Food Science, and Sustainable Systems- Division of Environmental Studies and Sustainable Systems, Frankfort, KY 40601, USA

Regina R. Hill, Research Assistant, Kentucky State University-College of Agriculture, Food Science, and Sustainable Systems- Division of Environmental Studies and Sustainable Systems , Frankfort, KY 40601, USA

Additional Information

https://kysu.edu/academics/cafsss/agriculture-research/division-of-environmental-studies-and-sustainable-systems/

Acknowledgements

The authors acknowledges Darrell Slone and Janet Pfeiffer for their kind assistance in planting pepper and melon at KSU research farm. This investigation was supported by two grants from USDA/CSREES to Kentucky State University under agreements No.KYX-10-08-43P & No.KYX-2006-1587.

The authors are solely responsible for the content of these proceedings. The technical information does not necessarily reflect the official position of the sponsoring agencies or institutions represented by planning committee members, and inclusion and distribution herein does not constitute an endorsement of views expressed by the same. Printed materials included herein are not refereed publications. Citations should appear as follows. EXAMPLE: Authors. 2013. Title of presentation. Waste to Worth: Spreading Science and Solutions. Denver, CO. April 1-5, 2013. URL of this page. Accessed on: today’s date.

Nutrient Planning on Swine Farms

Introduction


LESSONS LEARNED – See links below for more detail.
Mouse over the bottom of the slide to slow or pause slides.

Thirteen swine producers from Corn Belt states participated in a project with faculty from University of Nebraska and Purdue University to understand the movement of nutrients (nitrogen and phohsphorus) on commercial swine facilities. These farms ranged in size from 2,000 to 16,000 head finishing capacity with most farms being wean to finish or feeder pig to finish operations. The project team developed a whole farm nutrient balance for each farm for both 2006 and 2007 based upon farm specific data.

Primary project outcomes include an understanding of the primary sources of nutrients arriving on these farms, the magnitude of imbalances experience by these farms, and the value of specific nutrient management practices to minimizing the nutrient imbalances experienced by swine production.

To learn more about the concept of Whole Farm Nutrient Balance (WFNB), the lessons learned from this on-farm research, and the tools developed for use by producers, the following introduction is suggested:

WFNB for Pork Production – An Introduction

Lessons Learned

Tools

Archived Workshop on WFNB

  • Introduction to WFNB
  • Lessons Learned from 13 Commercial Swine Facilities
  • Introduction to WFNB Tools

Authors:

This project was funded by The National Pork Board. The authors wish to extend their appreciation for the financial support provided for completing this on-farm research project.

Snap-Shot Assessments of Nutrient Use on Dairy Farms

Nutrient Use Efficiency

Escalations in feed and fertilizer cost, and ebbing milk prices are motivating many dairy farmers to find new ways to improve nutrient use efficiency (NUE) on their farms. But how can NUE be determined and monitored easily on dairy farms, and what improvement in NUE can be realistically expected? Over the past several years researchers at the U.S. Dairy Forage Research Center and the University of Wisconsin-Madison have been developing and using rapid assessment methods to provide snap-shot assessments of feed, fertilizer, and manure use on dairy farms in various settings. The most recent work was a survey of 54 Wisconsin dairy farms known as On Farmers’ Ground.

Snap-Shot Assessments of Nutrient Use on Dairy Farms Webcast

This webcast describes and demonstrates the usefulness of using rapid assessment methods to provide snap-shot assessments of feed, fertilizer, and manure use on dairy farms in various settings.

Resources Available Through “On Farmers’ Ground”

  • Fact Sheet which outlines the procedures used to provide ‘snap-shot’ assessments of feed, fertilizer and manure use. Some examples are provided of the information obtained using snap-shot assessment techniques.
  • Survey Questionnaire designed to compile information on herd size and composition, livestock facilities, land use, management practices, and motivations and goals related to feed, fertilizer and manure management.
  • Manure Tracking Book used to systematically tract how, when and where farmers spread manure, and factors that influenced farmer decisions related to manure management.
  • Final Farmer Report which contains analytical results of feed and manure samples taken during the farm visits, including information on how farmers may use these results to improve feed and manure management. The Final Farmer Report also contains estimates of manure collection, as well as a series of farm maps depicting crop rotations, manure spreading practices, nitrogen and phosphorus applications as fertilizer, manure and legume-fixed N, and farm cropland areas that are impacted by USDA-NRCS 590 Nutrient Management Standards.
  • Four scientific journal articles related to the On Farmers’ Ground project

Author

J. Mark Powell
Soil Scientist-Agroecology, USDA-ARS US Dairy Forage Research Center
Professor of Soil Science, University of Wisconsin-Madison
1925 Linden Drive West
Madison, WI 53706
<mark.powell@ars.usda.gov>

Air Emission and Energy Usage Impacts of No Pit Fans in a Wean to Finish Deep Pit Pig Facility

What Is Being Measured?

The objectives of this research project are to monitor the indoor air quality of a deep-pit; wean-to-finish pig building over one pig-growth cycle (six months) by semi-continuously measuring concentrations of ammonia (NH3), hydrogen sulfide (H2S), carbon dioxide (CO2), methane (CH4), and volatile organic compounds (VOCs) and intermittently measuring particulate matter (PM10) and odor. The project will also monitor semi-continuous emissions of NH3, H2S, CO2, CH4, and VOCs plus intermittent sampling of odor emissions from the barn’s pit and wall exhaust streams over the six month growth period. Energy usage, both electrical and LP gas usage will be measured for both pit and non-pit ventilated rooms over the pig growth, along with pig performance (daily gain, feed efficiency, and death loss) between the rooms.

Current Activities

A cooperating pork producer is being located in southern Minnesota with a tentative starting date of July 1, 2008 for data collection.

Does the Use of Pit Fans Make a Difference in Air Emissions from Deep-Pit Pig Barns?

Air emissions from tunnel ventilated pig finishing barns have been monitored and partitioned between pit and wall fans during the past two years in Minnesota. The results showed that a disproportionate amount of hydrogen sulfide (H2S) and ammonia (NH3) emissions were emitted from the deep pit finishing barn through pit fans even though it was concluded that “pit” ventilation has little effect on the barn’s indoor air quality (figure 1). Thus producers might be able to reduce emissions of these hazardous gases and the associated odor of these gases simply by limiting or not using pit ventilation fans. Such a strategy would save electrical energy use since larger more efficient wall fans could replace the less efficient pit fans.

Figure 1. Hydrogen Sulfide Emissions from a 1200 head pig finishing barn with varying pit ventilation rates during a winter (January 26 to March 4, 2006) period. Contributed to eXtension CC2.5

Why is This Important?

Data collected from the deep pit facility will be used to determine the benefit of pit fans to indoor air quality in swine wean to finish buildings and what impact the use of pit fans has on energy usage and gas, odor, and particulate matter emissions from this stage of pork production buildings .

For More Information

Jacobson, L.D., B.P. Hetchler, and D.R. Schmidt. 2007. Sampling pit and wall emission for H2S, NH3, CO2, PM, & odor from deep-pit pig finishing facilities. Presented at the International Symposium on Air Quality and Waste Management for Agriculture. Sept 15-19, 2007. Broomfield, CO. St. Joseph, Mich.: ASABE

Authors: Larry D. Jacobson, David Schmidt and Brian Hetchler, University of Minnesota

This report was prepared for the 2008 annual meeting of the regional research committee, S-1032 “Animal Manure and Waste Utilization, Treatment and Nuisance Avoidance for a Sustainable Agriculture”. This report is not peer-reviewed and the author has sole responsibility for the content.

Market Based Conservation

Market-based conservation is an evolving concept that can mean different things to different people. Market-oriented approaches to conservation can include:

  • Using economic approaches, such as auctions and trading of credits, niche marketing, and a variety of payment for ecosystem services strategies
  • Encouraging competitions, such as bidding for grants or offers to pay for a greater share of the cost
  • Providing data to inform the conservation investment decisions of others
  • Focusing on monetary and non-monetary incentives
  • Fostering knowledge-based conservation

Webcast Presentation

The LPE Learning Center hosted a webcast on Market Based Conservation: Implications for Manure Management in May, 2008.

Market Based Conservation as a Policy

At the White House Conference on Cooperative Conservation in 2005, Agriculture Secretary Johanns announced a new U.S. Department of Agriculture Policy on Market-Based Environmental Stewardship. The goal of this policy is to broaden the use of markets for environmental and ecosystem services through voluntary market mechanisms. These mechanisms may include environmental credit trading, insurance, mitigation banking, competitive offer-based auctioning, eco-labeling—and more. The intent of this new policy is to make a deliberate, determined effort to help bring producers and consumers together and to develop innovative tools to quantify environmental impacts. In December of 2008, the USDA announced the creation of the Office of Environmental Markets to catalyze the development of markets for ecosystem services.

Until the last few years, in the U.S., most of the incentives for conservation have been provided by government through sharing the cost of conservation practices on private lands because these practices also have public environmental benefits. Trading is a market approach that is gaining acceptance through the cap and trade system. The Environmental Protection Agency policy on water quality trading is an example of the market approach. With trading, regulated industries have the flexibility to find the least cost avenue to comply with emissions, or at times, to trade with others to improve environmental quality. That is, when regulated industries must reduce emissions it may be cheaper to pay other firms or farms to reduce emissions than to do it themselves. Trading has the potential to accelerate air and water quality improvement and reduce compliance costs. The key to market-based incentives is that they are voluntary, verifiable, and transparent.

Examples of Market Based Conservation or Trading Programs

The New York City Watershed Agricultural Program is a great example of market based trading with a complementary municipal and agricultural partnership. Local farmers and agribusiness worked with the city to protect drinking water quality on nearly 500,000 acres of farmland in the watershed that supplies New York with drinking water. This saved the city millions of dollars in the development of advanced treatment systems and helped the rural community maintain its character.

One of the best manure based examples that is currently available is the Environmental Credit Corporation Lagoon Cover Program. Through this program, they will design, finance, and install lagoon covers to capture methane and other emissions at no cost to the farmer. They use the results to sell the carbon credits and can provide additional income to producers in some cases. Companies that buy and sell credits like ECC are called aggregators of credits. While national carbon legislation in the US has still not passed, there are still voluntary opportunities that exist for those in the agricultural sector as outlined in this webcast on opportunities for pork producers.

A final example is Vermont’s Cow Power program. Central Vermont Public Service, a utility, created a surcharge/premium people can pay to purchase green power generated by anaerobic digesters on dairy farms. This premium goes back to the farmer, generating a marketplace incentive and reward for farmers who are generating renewable, green energy from manure.

Recommended Reading on Market Based Conservation

EPA has just issued a new publication as part of its effort to support innovative, market-based approaches to water quality trading. The Water Quality Trading Toolkit for Permit Writers: Interim Technical Guide provides National Pollutant Discharge Elimination System (NPDES) provides permitting authorities with the tools they need to incorporate trading provisions into permits. The Toolkit also serves as EPA’s first “how-to” manual on designing and implementing trading programs consistent with EPA’s 2003 National Water Quality Trading Policy and will be valuable to all stakeholders. The Toolkit is focused on trading nitrogen and phosphorus, although, based on the Trading Policy, other pollutants may be considered for trading on a case-by-case basis.

The USDA Economic Research Service published a publication on Environmental Credit Trading; Can Farming Benefit. This six page document outlines several opportunities and discusses the potential markets for agricultural credit providers. They also published a document called The Use of Markets to Increase Private Investment in Environmental Stewardship that provides an overview of some market based conservation options.

American Farmland Trust’s Center for Agriculture in the Environment helps protect America’s agricultural lands and promotes healthy farming practices. This public policy research center has some excellent materials on market based conservation such as insurance programs to pay for yield reductions do to reduced nutrient inputs and materials on ecosystem services provided by agriculture.

The Ecosystem Marketplace Website provides many links to great resources and is a good example of an established trading program.

Harnessing Farms and Forests in the Low-Carbon Economy: How to Create and Verify Greenhouse Gas Offsets, a technical guide for farmers, foresters, traders and investors. A preview of the guide is available online at the Duke University Nicholas Institute for Environmental Policy Studies

Research Summaries on Market Based Conservation

An economic analysis of nutrient trading in the Chesapeake Bay Region: A study looks into nutrient credit trading as a means to improve the quality of water in the Chesapeake Bay.

Water Quality Trading in the United States provides a great overview of water quality trading programs implemented in the U.S. The primary source of information for this overview is a detailed database, collected and compiled by a team of researchers at Dartmouth College.

Paying For Environmental Performance: Using Reverse Auctions To Allocate Funding For Conservation Since demand for funding in conservation programs usually exceeds the available funds, allocating funding in a way that achieves the greatest environmental outcomes is essential. Reverse auctions are one way to efficiently allocate funding. This paper examines two reverse auctions conducted in Pennsylvania, designed to fund best management practices that reduced phosphorus pollution. It explains how reverse auctions can be used to maximize environmentally desirable outcomes, and outlines lessons learned from the Conestoga Reverse Auction Project within Pennsylvania’s Susquehanna River Watershed.

The Florida Ranchlands Environmental Services Project: Field Testing a Pay-for-Environmental-Services Program This paper examines a project in Florida that will field test a program that pays cattle ranchers to provide environmental services that will benefit the lake. The program came about after a 2004 study conducted by World Wildlife Fund (WWF) with several cattle ranchers concluded that a program to promote changes in water management practices on 850,000 acres of improved and unimproved pasture could moderate water flows to the lake, reduce phosphorus loads, and add to wetlands habitat. The study concluded that the agencies could buy these environmental services from cattle ranchers at a lower cost than producing the services by building new public works projects.

Doug Parker at the University of Maryland has written a report on Creating Markets for Manure: Basin-wide Management in the Chesapeake Bay Region. This report summarizes various methods for creating manure based markets. Other reports and programs from Georgia and Arkansas have focused on improving markets for poultry litter.

Author: Mark Risse, University of Georgia
Reviewers: John Lawrence, Iowa State University and Suzy Friedman, Environmental Defense Fund

Livestock and Poultry Environmental Stewardship Curriculum

LPES Curriculum Lessons

The lessons are divided into six modules: Introduction, Dietary Strategies, Manure Storage and Treatment, Land Application and Nutrient Management, Outdoor Air Quality, and Related Issues.

Small Farm Fact Sheets

The small farm fact sheet series were developed to assist smaller-scale livestock and poultry producers with questions about regulations and environmental stewardship.

Agricultural Environmental Management Systems (EMS) Series

The Ag EMS series is based on the ISO 14001 international standard for environmental management systems (EMS). The series is targeted toward educators and producers and assists with integrating environmental considerations into a systematic approach to day-to-day farm management.

Ag Environmental Management Systems Publications Curriculum Materials

This series of agricultural environmental management system (EMS) publications are the result of a five year project, Partners for Livestock EMS that field tested EMS tools with over 200 beef, dairy, and poultry producers in nine states. The ag EMS processs process is aimed at helping farmers and ranchers integrate environmental decision making into the day to day management of their operation. The process emphasizes the following actions:

  • Assess current performance and regulatory compliance.
  • Establish effective communication.
  • Set priorities for environmental improvement.
  • Develop action plans focused on measurable objectives.
  • Maintain comprehensive, well-organized records.
  • Identify and control potential sources of error.
  • Monitor progress toward objectives.
  • Regularly improve plans and re-assess priorities.

Users are encouraged to create individualized approaches to achieving objectives. The result is an ag-friendly EMS that is consistent with international standards.

Who Should Download the Ag EMS Publications?

These publications are targeted for use by farmers, ranchers, and their advisers. Educators and agency staff will find them useful in program development. Download the entire package (.ZIP format – includes both Word and PDF versions of all six publications)

An Introduction to Ag EMS (PDF format) | (Word format) (Word cover)

Target audience: Farmers, educators, and coaches/advisers
Purpose: An introduction to Environmental Management Systems (EMS) concepts for farmers, educators, coaches, and others. It explains the basic requirements and the benefits of the EMS process. It can also be distributed to those potentially interested in an EMS educational program. Download PDF | Download Word & cover

EMS Fact Sheets (PDF format) | (Word format)

Target audience: Farmers
Purpose: A companion to My EMS Workbook. This publication contains a fact sheet for each step of the EMS process. It provides an explanation for each topic, examples, and a list of recommended tasks. Download PDF | Download Word

My EMS Workbook (PDF format) | (Word format)

Target audience: Ag producers
Purpose: Intended for use with the EMS Fact Sheets. This publication contains blank worksheets that producers can complete. When completed, the workbook will serve as a summary or manual of their EMS. Download PDF | Download Word

Example My EMS Workbook (PDF format) | (Word format)

Target audience: Ag producers, educators, and coaches
Purpose: This publication is an example of the My EMS Workbook already completed for a case study beef feedlot. The example is intended to provide producers with a sense of how the materials will look when completed and offer ideas for their own EMS. Educators and coaches may use the example as-is, or they can modify it to reflect a particular animal species or geographical location. Download PDF | Download Word

EMS Sample Record Keeping Forms (PDF format) | (Word format)

Target audience: Ag producers, educators, and coaches
Purpose: These forms are blank templates that can be used as-is or modified to accommodate a producer’s record-keeping systems. The publication covers a wide range of environmental record-keeping topics that are commonly required in regulatory programs, in cost share programs, and by producers wishing to demonstrate a high level of environmental stewardship. Note: The CAFO regulations have been modified since the publication of this material. It is recommended that you verify requirements in federal and your state regulations and modify the materials if necessary before distribution. Download PDF | Download Word

EMS Supplement (PDF format) | (New handout 4b) | (Word format)

Target audience: Educators and coaches
Purpose: This publication provides guidance on setting up an educational program and gives additional information related to each topic. A list of recommended tasks or activities is included. It also contains one or more handouts for each step that can be photocopied and given to producers. This publication compares the relationship between the ISO 14001 standard and the EMS model outlined in the publication. Note: You should replace the handout 4b in both versions with the file downloaded as “new handout 4b”.  (PDF format) | (New handout 4b) | (Word format)

Resources for More Information on Ag EMS

Agriculture Environmental Management Systems

What is an EMS?

Environmental Management Systems (EMS) are a method of improving environmental and economic performance of a firm. They are widely accepted across many industries and are increasingly common in agriculture. An EMS is a process for integrating environmental considerations and requirements into day-to-day management and long-term planning for a farm.

This management approach examines a production system from start to finish, from inputs to products. With an EMS, the owner/operator and employees develop a plan for action that fits specific needs and resources, builds upon their stewardship principles, helps comply with legal requirements, and works to continually improve the operation. Also see What is an Ag EMS?

An EMS does NOT replace regulations, but may help in attaining compliance or realizing other benefits related to reduced environmental liability and better management. The EPA encourages adoption of EMS’s as a method of improve regulatory compliance, encourage environmental performance, and perhaps reduce regulatory burden.

An emerging concept that is very similar to an EMS is known as ‘adaptive management’. Check out an archived webinar on Adaptive Nutrient Management and a recorded symposium presentation on opportunities for adaptive grazing management in drought-stricken areas.

The EMS process was developed for industry and is commonplace in manufacturing world wide. The most recognized system is ISO 14001 which involves third party certification and formal auditing. As farms become larger and more complex and rely on more employees and outsource more services, the farmer needs a systematic method of managing his or her operation. While formal certification may not be necessary, the EMS process and principles can help farmers improve their environmental and economic performance. There are Ag EMS Publications tailored for agriculture that make it practical to implement on the farm.

The EMS model is a Plan, Implement, Check and Correct, and Review sequence, a proven successful management process. The planning process begins with establishing an environmental policy for the farm/ranch that describes the farmer’s commitment to environmental stewardship, to meeting regulations, and to continual improvement.

An Environmental Management System (EMS) helps to integrate environmental decisions into the overall farm management. CC2.5 LPELC

Environmental Policy Statement

An EMS policy statement describes the environmental principles that are important to you, and establishes your goals for managing them. Everyone who works on your farm should know and share a commitment to the policy statement. You can showcase this statement to the public to demonstrate your environmental commitment. An EMS policy statement should at a minimum describe your commitment to:

    • pollution prevention,
    • continual improvement, and
    • compliance with environmental regulation.

Plan

Next, the farmer assesses the current operation to identify strengths and weaknesses and identifies which if any are causing significant environmental concerns. He or she has now identified a small list of priorities to address first. Then, an action plan with defined objectives, measurable outcomes, and specific steps, timelines, and assignments is developed for each priority. Some assessments can be found at:

Implement

“Implement” involves communicating the plan to the people that are responsible for making it happen. This includes preparing operating procedures, training, and resources as needed.

Record keeping is an essential component of an effective EMS. CC2.5 LPELC

Check

“Check” is a regular review of the plan’s progress and environmental performance. If problems arise “Correct” refers to corrective actions taken. Documenting regular monitoring actions taken helps the farmer measure progress and shows a proactive approach to environmental improvement.

Review

“Review” closes the loop on the continuous improvement process. Farmers annually review their operation and their plan to determine if they are headed in the right direction, using the best methods, and making progress.

Chances are good that components of the EMS process are already being utilized on a farm. These may include management plans for manure handling, pests, or nutrients, in addition to records on soil testing, chemical applications, feeding requirements, or worker training. An EMS helps organize and document these efforts and improve the environmental and economic performance of the farm.

Examples of Environmental Management Systems for Agriculture

Resources For More Information

Author: John Lawrence, Iowa State University Reviewers: Mark Risse, University of Georgia and Tommy Bass, Montana State University

Whole Farm Nutrient Balance

What is Whole Farm Nutrient Balance?

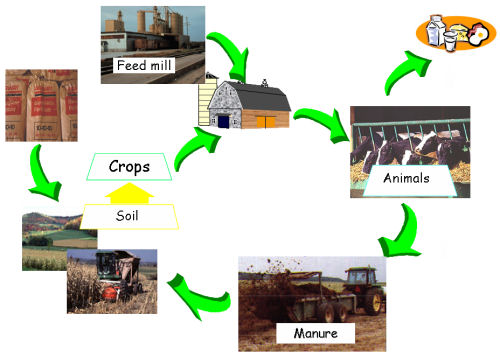
Nutrient management is a process of planning for manure and fertilizer applications to individual crop fields. Whereas whole farm nutrient balance considers the location and flow of nutrients onto, within and off the entire farm. Whole farm nutrient balance involves taking a step back and also comparing the amount of nitrogen (N), phosphorus (P), and potassium (K) and other nutrients entering the farm as purchased feed, fertilizer, animals etc. with the amount of nutrients leaving the farm as milk, animals, crops, manure exports to other farms, etc. Such a comparison can help in determining the economic and environmental impacts of nutrient management on dairy and livestock farms.

A comparison of the flows of nutrients onto and off dairy and livestock farms results in whole farm nutrient balance assessment. This balance is usually calculated from records of the nutrient-containing materials coming onto the farm (feed, fertilizer, purchased animals) and those leaving the farm in the form or products (milk, meat, eggs, crops, etc.). Balances can be expressed as percentage remaining, lbs/acre remaining or, for dairy farms, as lbs remaining per unit milk produced. For an example, see the Cornell Whole Farm Nutrient Balance Software or other such tools.

An estimate of the whole farm nutrient balance can also be determined from the density of livestock on the farm. Animal Density is usually estimated from the number of animal units per acre. (See box below)

Animal Density=Animal Units (AU)/Acre on an annualized basis,

  • AU=1000 lb live weight/A
  • Acres=acres available for manure application
  • Annualized=days our of 365 animals are on the farm producing manure

Animal Density=AU/Acre*(Days/365)

Go to the Animal_density_Calculator (Excel file)

Source: Doug Beegle, Pennsylvania State University.

Why Is the Whole Farm Nutrient Balance Important?

When the inflow of nutrients is greater than the outflow, annual losses and/or accumulation of nutrients will occur. The whole farm nutrient balance can indicate the potential for non-point source pollution from nutrients on the farm which can help to target management efforts to minimize the impact of nutrients on the environment. As such, the assessment of a farm’s nutrient mass balance can assist producers in determining the need for and identification of management practices that can reduce nutrient imports or enhance exports such as off site movement of manure, manure treatment, feed ration adjustments, land purchases and herd size adjustments to land acres. Knowing a farm’s nutrient balance is especially useful for farms looking at expansion or costly upgrades of equipment and buildings to ensure the long term sustainability of the farm.

The whole farm nutrient balance brings a number of important characteristics of the farm to the forefront that can optimize the economics of manure management while minimizing the environmental impacts from manure nutrients. Some of these are summarized in the table below.

The economics of nutrient management are often linked to the whole farm nutrient balance. For example, most people assume that improved nutrient management will always result in a positive economic return for the farm, but in fact, on many of the farms with a high potential for nutrient pollution, the economics of improved nutrient management to protect the environment will be costly. For farms that have excess nutrients the goals become maximizing safe utilization of nutrients and developing a strategy for removing excess nutrients from the farm. Examples of different nutrient management strategies based on nutrient balance can be seen by selecting the appropriate link in the table below.

Characteristics of Farms Based on Manure Nutrient Balance
Manure Nutrient Balance Deficit Balanced Excess
Animal Density* Low (<1.25 AU/A) Medium (1.25-2.25 AU/A) High (>2.25 AU/A)
Feed Source (% Off Farm) <50% 50-80% >80%
Land for Manure Application Adequate Limited Inadequate
Manure Management Strategy Deficit Balance Strategies Nutrient Balance Strategies Excess Nutrient Strategies
Economics of Nutrient Management Positive Neutral Negative
Non-point Source Pollution Potential Low Low to High High

*For P balance assessment, animal densities shown here should be halved.

Recommended Resources for Calculating Whole Farm Nutrient Balance

Excess Nutrients Management Goal = Reduce the Excess

  • Remove manure nutrients from the farm
  • Reduce the animal density
  • Manage nutrients remaining on the farm based on nutrient balance.
  • Example tactics:
    • Sell manure
    • Give manure away
    • Acquire more land
    • Reduce animal numbers

“In Balance” Management Goal = Maximize Safe Use of Manure Nutrients

  • Manage manure based on nutrient balance
  • Manage nutrients so that over time inputs balance outputs
  • Example tactics:
    • Spread manure on legumes
    • Don’t incorporate manure. Note: This strategy is currently sustainable but will likely change if air emissions need to be reduced.
    • Increase intensity of cropping system
    • Detailed plan needed

Deficient Management Goal = Maximize Efficient Use of Manure Nutrients

  • Manage based on expected crop response to manure nutrients.
  • Manage nutrients to increase yields or decrease purchased inputs.
  • Example tactics:
    • Spread manure in the spring as near to the time of crop utilization as practical
    • Use cover crops to conserve nutrients from fall and winter applied manure
    • Incorporate manure immediately to conserve nitrogen
    • Spread manure on N requiring crops
    • Don’t spread manure on legumes – they don’t need the N
    • Spread manure on fields with low P & K soil test levels

Page Manager: Douglas Beegle, Penn State University

Software and Web-Based Resources for Nutrient Management

Why Utilize Tools for Nutrient Planning?

The process of nutrient management planning can be complex and time consuming. Doing a good job requires:

  • collecting and organizing extensive information about a farm;
  • making a diverse series of decisions and calculations about crops, fertilizer and manure management; and
  • communicating the completed plan to a multiple audiences including the farmer.

There is an expanding list of web-based and personal-computer-based tools that can help nutrient management planners write effective nutrient management plans. Some of these tools help with a specific element of the nutrient management process where others perform multiple parts of the process.

The objective of this page is to show some of the diversity in software tools that may be useful to nutrient management planners. The listing is not and cannot be comprehensive and will focus on tools that have a national audience. Some state-specific tools are included if they provide a particularly unique service or approach.

There are many state-specific tools. If you see a helpful resource on this site you may want to search for an analogous program developed in your region or state that may have more relevant supporting data integrated into the program. Links to state-specific nutrient management pages may be listed on State Specific Manure Nutrient Management Information.

Data Collection and General Information

  • Google Map provides aerial view of areas of interest and driving directions. A good place to get started.
  • University of Missouri National Data Finder. Download spatial and soils data needed to run RUSLE2, MMP and SNMP for any location in the U.S. Includes selected soils data and black and white georeferenced aerial photos (DOQ’s). Clip areas up to 10,000 acres.
  • University of Missouri Animal Feeding Operation Site Assessment Tool (AFO SITE): Available only for Missouri. Web-based application that produces a detailed site assessment evaluating the sites suitability for an animal feeding operation.
  • Web Soil Survey. Download tabular and spatial soils data for U.S. counties. Whole county data sets sent in an email.
  • NRCS Geospatial Gateway provides access to a diverse set of spatial layers. Cannot clip to area of interest so file sizes typically too large to download over the internet.
  • USDA National Agricultural Imagery Program provides georeferenced aerial photography of agricultural land taken during the growing season. The imagery is available for download as mosaicked DOQQ’s either individually or as compressed county images.

Nutrient Balance Calculators

Whole farm nutrient balance looks at all nutrient imports and exports on a farm and can be a useful tool to evaluate the nutrient status of a farm. Are there too many nutrients? Is the farm nutrient deficient?

  • University of Nebraska Nutrient Balance Calculator. A spreadsheet based calculator. The web site includes links to good supporting information.
  • Cornell University Nutrient Balance Calculator. A spreadsheet based calculator. The web site includes links to good supporting information.

Nutrient Management Software

This software helps the user through the many steps of completing a nutrient management plan. Many states have there own software including NC, NY, VA, and WI.

  • Purdue’s Manure Management Planner. The most complete multi-state software for writing nutrient management plans. Includes state-specific fertilizer recommendations, manure nutrient availability calculations and generates plans that meet national standards for USDA-NRCS and EPA. Automated links to SNMP for geographic information and to the record keeping program WinMax. A free stand alone program available for 34 states.

Economics of Manure Management

What is manure worth? This can be a complicated question to answer. These tools provide some help in making economic decisions about manure.

  • Feed Nutrient Management Planning Economics (FNMP$): a comprehensive program connecting feed ration characteristics, manure storage type and cropping systems impacts on the value of manure as a fertilizer. FNMP$ estimates: 1) manure nutrients, 2) land requirements, 3) labor and equipment application time, and 4) costs and value for land application. Spreadsheet-based program. Instructions for program.
  • University of Missouri Manure Value Spreadsheet A spreadsheet-based calculator of the fertilizer value of manure based on manure test results, crop fertilizer recommendations and fertilizer prices.
  • University of Minnesota What Is Manure Worth? spreadsheet.

Other Tools and Resources

  • Spatial Nutrient Management Planner (SNMP): an ArcView 3.x program that facilitates delineating farm fields, mapping setbacks and soil test levels and calculating field sizes and spreadable acres. Available for all states. Links automatically to MMP. An ArcView 9.x version to be released soon.
  • Revised Universal Soil Loss Equation ver. 2 (RUSLE(2)): Used by USDA-NRCS to estimate edge-of-field erosion losses. Complicated to get started and not fully intuitive to use. The good news is that it will soon be fully integrated into MMP.
  • NRCS eFOTG (electronic Field Office Technical Guide: This is not software, but this website has links to conservation standards such as Nutrient Management (590) and Waste Utilization (633) for every state. Search in section IV under “Conservation Practices”.
  • Phosphorus Index: There is no national P index. Instead individual states have developed P indexes that meet the needs of their state. Look for information about the P index through the state NRCS office or Land Grant University.
  • Animal Waste Management (AWM) software: Facilitates sizing of manure storage facilities for animal feeding operations. Estimates the volume of manure, waste water and solids generated by animals in confinement. Does not address state-specific requirements. Some states have state-specific programs. To view a tutorial on using this software, see Animal Waste Management Software Training Video

If there is web page or software program you would like to have included on this webpage please contact John Lory.

Author: John Lory, University of Missouri, loryj@missouri.edu
Reviewers: Rick Koelsch, University of Nebraska and Rich Meinert, University of Connecticut