
Purpose
The main goal of the study is to determine the singular or combined effects of crop rotation, tillage system, N fertility levels and sources on crop grain and biomass production, crop diseases, and soil attributes (nitrogen, phosphorus, organic matter and pH). Secondly, our goal is to assess the economics of some of the crops grown in the experimental area during the period of time from 2008-2014. The results presented in this summary show that composted manure can replace commercial fertilizer applications in a crop rotation system, maintaining the same level of yields and increasing profits during a 7-year period. Related: Manure value & economics
What did we do?
In 1987, a long-term cropping system study was initiated at the North Dakota State University (NDSU) Carrington Research Extension Center (CREC). The study takes place on approximately 40 acres and consists of cycles of three, 4-year crop rotations with three replicates. The base rotation is hard red spring wheat (HRSW) – sunflower – barley – soybean. Other rotations are composed of HRSW – field pea – corn – soybean and HRSW – corn – soybean – canola. Each crop within each rotation is planted every year. Tillage treatments (conventional tillage-CT, minimum tillage-MT and no-tillage-NT) are imposed along the north-south direction and fertility treatments (nitrogen rates and sources) are imposed along the east-west direction. Nitrogen sources are urea (applied each spring to non-leguminous crop plots at 0, 50, or 100 lbs of N/ac) and composted beef feedlot manure (applied once in the spring at a rate of 200 lbs of N/ac on the first year of each cycle).
The crops (barley, corn, field peas, soybean and HRSW) and period of time (from 2008 to 2014) were selected based on data available to compute production costs (tillage, fertilizer, seeds, chemicals, seeding, combining, overhead and land) and gross return (crop yields and prices). Due to a lack of protein data, barley and HRSW from 2008 were not included in the calculations. The economics were calculated based on two scenarios for the composted manure treatment: Scenario 1 (CompSCN 1) – the producer owns the compost and the only cost associated with it is the application cost; Scenario 2 (CompSCN 2) – the producer pays for each unit of N in the compost the same price paid per unit of N as commercial fertilizer. Barley was graded according to its protein content as feed (protein >12%) or malting barley (protein ≤12%). For HRSW, we used an average discount of $0.08/bu for each 1/5% of protein lower than 14% across all years.
What have we learned?
|
|
| Figure 1. Average (2008-2014; 2009-2014 for barley and HRSW) yield3 (left) and net income (right) for crops in a long term cropping system at the NDSU Carrington REC, Carrington, ND. 0,50, and 100 N represent, respectively, 0, 50 and 100 lbs of N/ac. COMP/MAN= composted manure. MT= minimum tillage; NT= no tillage; CT= conventional tillage. CompSC1 and CompSC2 are compost manure scenarios 1 and 2, respectively. Averages followed by the same letter are not significantly different (Tukey Test, p=0.05). 1 Protein content: >12%= feed barley, <=12%= malting barley. 2 Wheat protein discount= $0.08/bu per 1/5 below 14%. 3 Provisional data. |
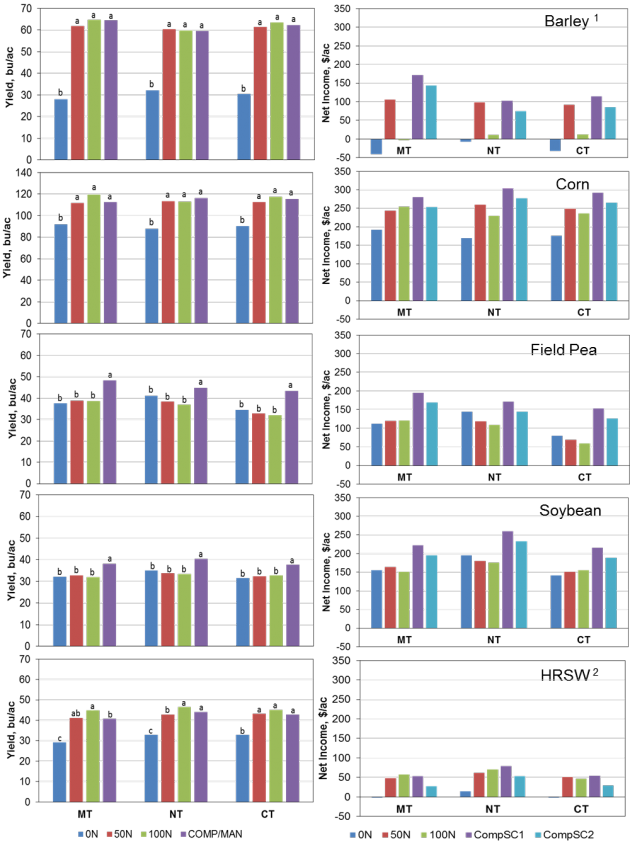
Barley and corn yields were increased by nitrogen application, but there was no response to either N rates or source across the tillage systems (Figure 1). The field pea and soybean yield differences between the sources of N (Figure 1) was likely due to composted manure application every four years (2007 and 2011) regardless of the crop growing on those plots, while N fertilizer is applied only to non-leguminous crops. The composted manure (COMP/MAN) treatment produced similar HRSW yields to the highest N rate (100 lbs N/ac) treatment under no-till and conventional tillage and it was out yielded by the same treatment under minimum tillage.
The CompSC1 was the most profitable treatment across the tillage systems for the majority of the crops, except for HRSW. Similar results were seen even when the compost was paid for based on its N content (CompSC2). The lower income for barley with 100 lbs N/ac was due to the high protein in the kernel (feed barley=lower selling price). For HRSW, the CompSC1 treatment showed lower net income than the highest N rate under minimum tillage and higher net income under the other two tillage systems, while the CompSC2 treatment showed much lower income than the other N treatments. The higher income when using composted manure is due to both similar yields and lower production cost when using that product in comparison with the other N treatments. Protein content in HRSW was lower when using composted manure, which resulted in large protein discounts, which were over $50/ac in some cases.
Future Plans
In the future, we would like to investigate strategies for N application during the wheat growing season to boost protein content and net income per acre in areas fertilized with fresh feedlot manure.
Authors
Paulo Flores, Nutrient Management Specialist at NDSU Carrington Research Extension Center, paulo.flores@ndsu.edu.
Ezra Aberle, Research Specialist – Crop Systems at NDSU Carrington Research Extension Center
Additional information
For more information about the field research conducted on the long term cropping system, described on this summary, you are welcomed to contact Ezra Aberle (ezra.aberle@ndsu.edu) at the Carrington Research Extension Center (CREC, Phone: 701.652.2951). For more information about this summary please contact Paulo Flores (paulo.flores@ndsu.edu) at the CREC.
The authors are solely responsible for the content of these proceedings. The technical information does not necessarily reflect the official position of the sponsoring agencies or institutions represented by planning committee members, and inclusion and distribution herein does not constitute an endorsement of views expressed by the same. Printed materials included herein are not refereed publications. Citations should appear as follows. EXAMPLE: Authors. 2015. Title of presentation. Waste to Worth: Spreading Science and Solutions. Seattle, WA. March 31-April 3, 2015. URL of this page. Accessed on: today’s date.