
Manure Application Method and Timing Effects on Emission of Ammonia and Nitrous Oxide

Waste to Worth: Spreading science and solutions logoWaste to Worth home | More proceedings….

Abstract

We conducted a field study on corn to evaluate the effect of liquid dairy manure applied pre-plant (injection or surface broadcast with immediate or 3-day disk incorporation) or sidedressed at 6-leaf stage (injected or surface-applied) on emission of NH3 and N2O. Manure was applied at a rate of 6500 gal/acre, which supplied an average of 150 lb/acre of total N and 65 lb/acre of NH4-N. Ammonia emission was measured for 3 days after manure application using the dynamic chamber/equilibrium concentration technique, and N2O flux was quantified using the static chamber method at intervals of 3 to 14 days throughout the season. Ammonia-N losses were typically 30 to 50 lb/acre from pre-plant surface application, most of the loss occurring in the first 6 to 12 hours after application. Emission rates were reduced 60-80% by quick incorporation and over 90% by injection. Losses of N2O were relatively low (1 lb/acre or less annually), but pronounced peaks of N2O flux occurred from either pre-plant or sidedress injected manure in different years. Results show that NH3 emission from manure can be reduced substantially by injection or quick incorporation, but there may be some tradeoff with N2O flux from injection.

Why Study Land Application Emissions of Ammonia and Nitrous Oxide?

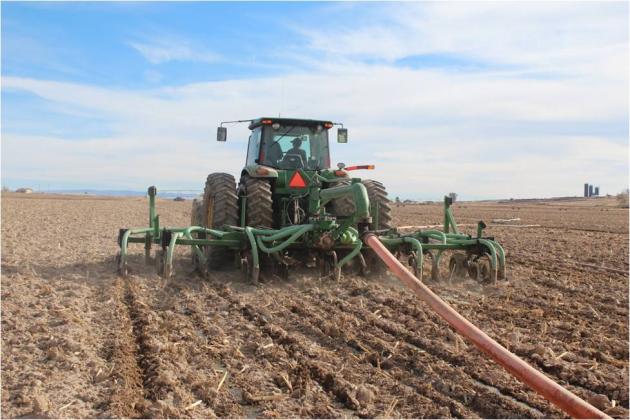
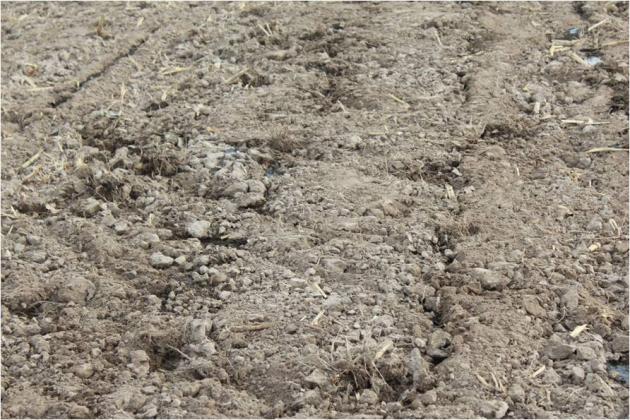
Figure 1. Injection equipment used for pre-plant application (top) and sidedress application (bottom) of liquid dairy manure.

Manure is a valuable source of nitrogen (N) for crop production, but gaseous losses of manure N as ammonia (NH3) and nitrous oxide (N2O) reduce the amount of N available to the crop and, therefore, its economic value as fertilizer. These N losses can also adversely affect air quality, contribute to eutrophication of surface waters via atmospheric deposition, and increase greenhouse gas emission. And the decreased available N in manure reduces the N:P ratio and can lead to a more rapid build-up of P in the soil for a given amount of available N. The most common approach to controlling NH3 volatilization from manure is to incorporate it into the soil with tillage or subsurface injection, which can reduce losses by 50 to over 90% compared to surface application (Jokela and Meisinger, 2008). Injecting into a growing corn crop at sidedress time offers another window of time for manure application (Ball-Coelho et al., 2006). While amounts of N lost as N2O are usually small compared to NH3, even low emissions can contribute to the greenhouse effect because N2O is about 300 times as potent as carbon dioxide in its effect on global warming (USEPA, 2010). We carried out a 4-year field experiment to evaluate the effect of dairy manure application method and timing and time of incorporation on a) corn yield, b) fertilizer N credits, c) ammonia losses, and) nitrous oxide emissions.

What Did We Do?

Figure 2. Average (2009-2011) NH3-N emission rates as affected by method and timing of manure application.

This field research was conducted at the Univ. of Wisconsin/USDA Agricultural Research Station in Marshfield, WI, on predominantly Withee silt loam (Aquic glossudalf), a somewhat poorly drained soil with 0 to 2% slope. Dairy manure was applied either at pre-plant (mid- to late May) or sidedress time (5-6-leaf stage). Pre-plant treatments were either injected with an S-tine injector (15-inch spacing; Fig. 1) or incorporated with a tandem disk immediately after manure application (< 1 hour), 1-day later, or 3 days later. All plots were chisel plowed 3 to 5 days after application. Sidedress manure applications were either injected with an S-tine injector (30-inch spacing) or surface applied (Fig. 1). Fertilizer N was applied to separate plots at pre-plant at rates of 0, 40, 80, 120, 160, and 200 lb/acre as urea and incorporated with a disk. Liquid dairy manure (average 14% solids) was applied at a target rate of 6,500 gal/acre. Manure supplied an average of 158 lb total N and 62 lb NH4-N per acre, but rates varied across years and application times.

Ammonia emission was measured following pre-plant and sidedress manure applications in 2009-2011 with the dynamic chamber/equilibrium concentration technique (Svensson, 1994). Measurement started immediately after manure application and continued through the third day. Ammonia measurement ended just before disking of the 3-day incorporation treatment, so the 3-day treatment represents surface-applied manure. Nitrous oxide was measured using the static, vented chamber technique following the GRACEnet protocol (Parkin and Venterea, 2010). Measurement began two days after pre-plant manure application and continued approximately weekly into October.

What Have We Learned?
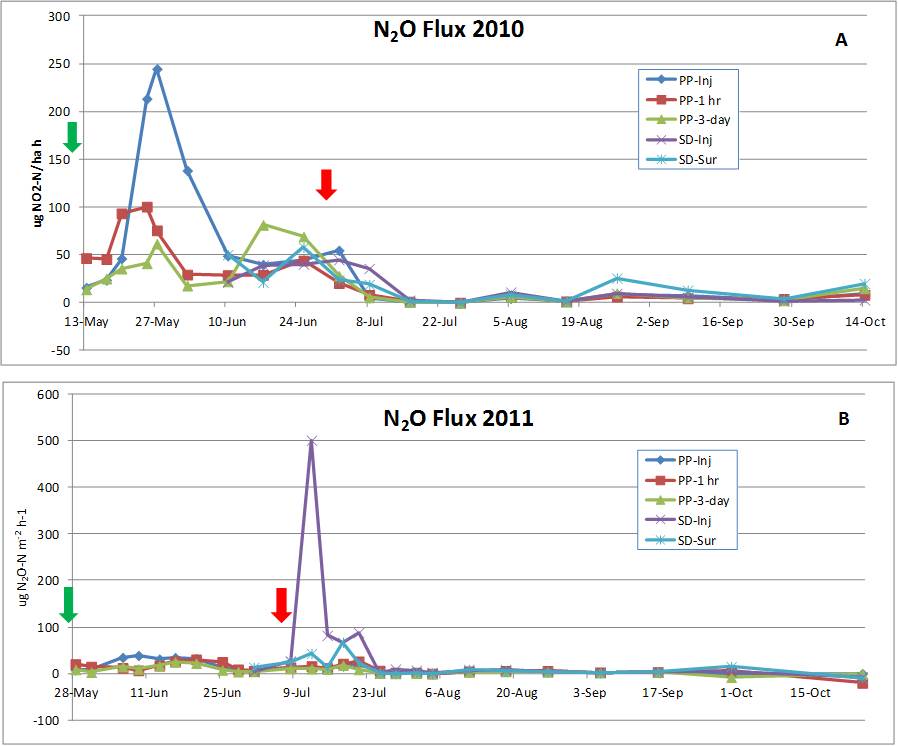
Figure 3. Nitrous oxide (N2O) flux as affected by method and timing of dairy manure application from May to October of 2010 (A) and 2011 (B). Arrows show times of manure application. Note differences in scale for 2010 and 2011.

The 3-year average annual NH3 emission rate from surface applied (3-day incorporation) manure was relatively high immediately following application but declined rapidly after the first several hours to quite low levels (Fig. 2). Cumulative NH3-N loss over the full measurement period averaged over 40 lb/acre from surface application but was reduced by 75% with immediate disking and over 90% by injection. Ammonia losses varied somewhat by year, but patterns over time and reductions by incorporation were similar. The pattern of ammonia loss, 75% of the total loss in the first 6 to 12 hours, emphasizes the importance of prompt incorporation to reduce losses and conserve N for crop use.

Nitrous oxide flux was quite low for most manure treatments during most of the May to October period in both years (Fig. 3). However, there were some increases in N2O flux after manure application, and pronounced peaks of N2O emission from the injection treatment at either pre-plant (2010) or sidedress (2011) time. Greater emission from injection compared to other treatments may have occurred because injection of liquid manure places manure in a relatively concentrated band below the surface, creating anaerobic (lacking in oxygen) conditions. Nitrous oxide is produced by denitrification, a microbial process that is facilitated by anaerobic conditions. Reasons for the difference between 2010 and 2011 are not readily obvious, but are probably a result of different soil moisture and temperature conditions.
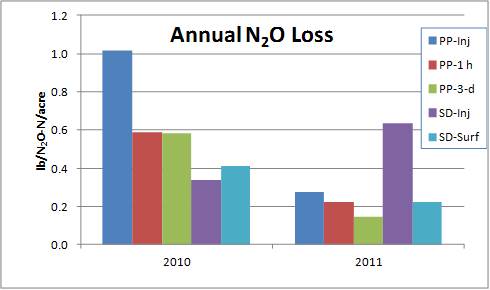
Figure 4. Annual (May-Oct.) loss of N2O as affected by method and timing of liquid dairy manure application. 2010 and 2011.

Based on these results, injection of liquid dairy manure resulted in opposite effects on NH3 and N2O emission, suggesting a trade-off between the two gaseous N loss pathways. However, the total annual N losses from N2O emissions (1 lb/acre or less; Fig. 4) were only a fraction of those from ammonia volatilization, so under the conditions of this study N2O emission is not an economically important loss. As noted earlier, however, N2O is a potent greenhouse gas, so even small amounts can contribute to the potential for global climate change. The dramatic reduction in NH3 loss from injection, though, may at least partially balance out the increased N2O because 1% of volatilized N is assumed to be converted to N2O (IPCC, 2010). Immediate disk incorporation was almost as effective as injection for controlling NH3 loss and, on average, resulted in less N2O emission than injection. But the separate field operation must be done promptly after manure application to be effective. A possible alternative is to use sweep injectors or other direct incorporation methods that place manure over a larger volume of soil and/or create more mixing with soil, thus creating conditions less conducive to denitrification and N2O loss.

Manure application timing and method/time to incorporation significantly affected grain yield in 2009, 2010, and 2012 and silage yield in 2012. Pre-plant injection produced greater yields than one or more of the broadcast treatments in 2009 (grain) and 2012 (grain and silage). Overall, yield effects of application and incorporation timing were variable from year to year, probably because of differences in weather and soil conditions and actual manure N rates applied. The fertilizer N equivalence of manure was calculated by comparing the yield achieved from each manure treatment to the yield response function from fertilizer N. Fertilizer N equivalence values were quite variable by year, but 4-year averages expressed as percent of total manure N applied were 52% for injection (pre-plant and sidedress), 37% for 1-hour or 1-day incorporation, and 34% for 3-day incorporation. So, when expressed as a percent of total manure N applied, N availability generally decreased as time to incorporation increased, which reflects the amounts of measured NH3 loss.

In summary, ammonia volatilization losses increased as the time to incorporation of manure increased. Injection of manure resulted in the lowest amount of NH3 volatilization, but higher N2O emissions. In this study, reducing the large NH3 losses by injecting manure provided more environmental benefit compared to the small increase in N2O emissions. In addition, injection or immediate incorporation resulted, on average, in higher fertilizer N value of manure for corn production. The decreased need for commercial fertilizer N could potentially result in greater profitability and a smaller carbon footprint.

Future Plans

We have started other research to evaluate yield response, N cycling, and emission of NH3 and N2O from various low-disturbance manure application methods in silage corn and perennial forage systems.

Authors

Bill Jokela, Research Soil Scientist, USDA-ARS, Dairy Forage Reserch Center, Marshfield, WI, bill.jokela@ars.usda.gov

Carrie Laboski, Assoc. Professor, Dept. of Soil Science, Univ. of Wisconsin

Todd Andraski, Researcher, Dept. of Soil Science, Univ. of Wisconsin

Additional Information

Acknowledgements

The authors gratefully acknowledge Matt Volenec and Ashley Braun for excellent technical assistance in conducting this research. Funding was provided, in part, by the USDA-Agricultural Research Service and the Wisconsin Corn Promotion Board.

The authors are solely responsible for the content of these proceedings. The technical information does not necessarily reflect the official position of the sponsoring agencies or institutions represented by planning committee members, and inclusion and distribution herein does not constitute an endorsement of views expressed by the same. Printed materials included herein are not refereed publications. Citations should appear as follows. EXAMPLE: Authors. 2013. Title of presentation. Waste to Worth: Spreading Science and Solutions. Denver, CO. April 1-5, 2013. URL of this page. Accessed on: today’s date.
Model of a Successful Regulatory-Industry Partnership to Address Air Emissions from Dairy Operations in Yakima, WA

Waste to Worth: Spreading science and solutions logoWaste to Worth home | More proceedings….

Why Is It Important for Industry and Regulators to Work Together?

The community in the Yakima Region of Washington State has raised concerns over the potential adverse effects of air emissions from dairy operations. To address these concerns, the Yakima Regional Clean Air Agency (YRCAA) proposed a policy process in October 2010 to control and mitigate emissions through implementation of site-specific best management practices (BMPs) on dairy operations. Absent a lack of reliable methodologies for estimating emissions from dairies, the YRCAA enrolled experts and scientists to help create tools that could be used for estimation of emissions from dairy operations. The assessment of BMPs aimed at mitigating air emissions from dairies was also included to determine their effect on the character, amount, and dispersion of specific air pollutants. This project assessed the effect of voluntary verses policy driven action on the dairy industry, community, and environmental impacts of air emissions from dairy operations.

What Did We Do?

The Yakima Regional Clean Air Agency (YRCAA) proposed a draft policy in October 2010 to control and mitigate emissions through implementation of site-specific best management practices (BMPs) on dairy operations. To validate the policy, a “Pilot Research Project” was launched in February 2011 to gather information for one year to test the feasibility of implementing and determining policy effectiveness. Twelve operations, representing ~40% of the estimated regional cow numbers, volunteered to participate.

A description of proven BMPs and a BMP selection-guide were created to help producers develop site-specific Air Quality Management Plans (AQMP). Each AQMP identified, systematically, specific BMPs to mitigate emissions from each area of the dairy system (nutrition, feed management, milk parlor, housing-drylot, housing-freestall, grazing, manure management, land application, other) based on effectiveness, practicality and economics. The pollutants addressed in each AQMP included ammonia, nitrous oxide, hydrogen sulfide, volatile organic compounds, odor, particulate matter, oxides of nitrogen, and methane. A universal score-sheet was created to assess implementation of BMPs at each dairy. The YRCAA inspectors were trained to evaluate, score, and record BMP implementation. A whole-farm score was generated during each visit, which identified areas of improvement to be addressed.

The process was very unique in that the dairy industry took a proactive role and actively participated. Using science and air quality experts to create and validate the evaluation tools and process also brought authority to the process. The policy was revised based on information collected from the pilot project and was adopted in February 2012. To date, 22 operations, representing 57% of total cow numbers in the Yakima Region, are enrolled.

What Have We Learned?

The voluntary approach used during the pilot project phase of the policy was very effective in enrolling the dairy community. Producers stepped up to volunteer and cooperatively participate in an unknown process. Even though they were very robust and integrated a large amount of scientific information, the emission assessment tools created as an outcome of the pilot project were very user friendly and easy to interpret by planners and producers. The air quality BMP assessment tool is currently being evaluated for use by other agencies and institutions.

Future Plans

The YRCAA has entered into phase two of the policy process and are now mandating that dairies participate in the air quality assessment. Starting in March 2013, all dairy operations in the Yakima basin will be either voluntarily or mandatorily inspected and assessed for air quality improvements. This provides an opportunity to compare voluntary and mandatory policy processes. The long-term impact of the process is yet unknown.

Authors

Nichole M. Embertson, Ph.D., Nutrient Management Specialist, Whatcom Conservation District, Lynden, WA, nembertson@whatcomcd.org

Gary Pruitt, Executive Director, Yakima Regional Clean Air Agency Air, Yakima, WA

Hasan Tahat, Engineering and Planning Supervisor, Yakima Regional Clean Air Agency Air, Yakima, WA

Pius Ndegwa, Biological and Systems Engineering, Washington State University, Pullman, WA

Additional Information

https://www.yakimacleanair.org/site/files/file_manager/page/shared/Resource%20Guide%20for%20BMP%20for%20Dairy%20Oparation%20Aug18.pdf


The authors are solely responsible for the content of these proceedings. The technical information does not necessarily reflect the official position of the sponsoring agencies or institutions represented by planning committee members, and inclusion and distribution herein does not constitute an endorsement of views expressed by the same. Printed materials included herein are not refereed publications. Citations should appear as follows. EXAMPLE: Authors. 2013. Title of presentation. Waste to Worth: Spreading Science and Solutions. Denver, CO. April 1-5, 2013. URL of this page. Accessed on: today’s date.
Manure management and temperature impacts on gas concentrations in mono-slope cattle facilities

Waste to Worth: Spreading science and solutions logoWaste to Worth home | More proceedings….

Why Study Air Emissions from Mono-slope Beef Barns?

Mono-slope buildings (Figure 1) are one type of roofed and confined cattle feeding facility that is becoming increasingly popular in the Northern Great Plains. However, little is known about the impact of these housing systems and associated manure management methods on the air quality inside and outside the barn.  The objective of this study was to determine gas concentrations in mono-slope beef cattle facilities and relate these concentrations to environmental and manure management factors.

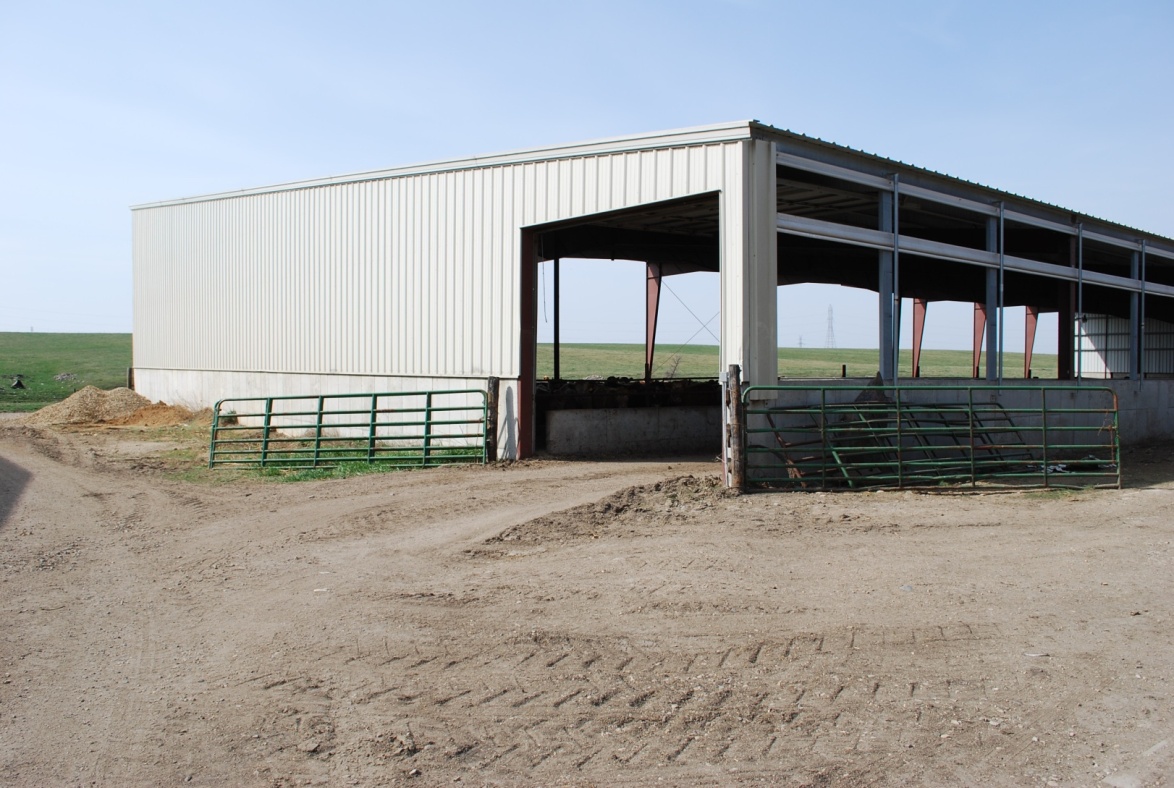
Figure 1. View of a monoslope cattle facility from the northeast. Adjustable curtains in the rear (north) wall are used to limit airspeed through the barn during colder weather.

What Did We Do?

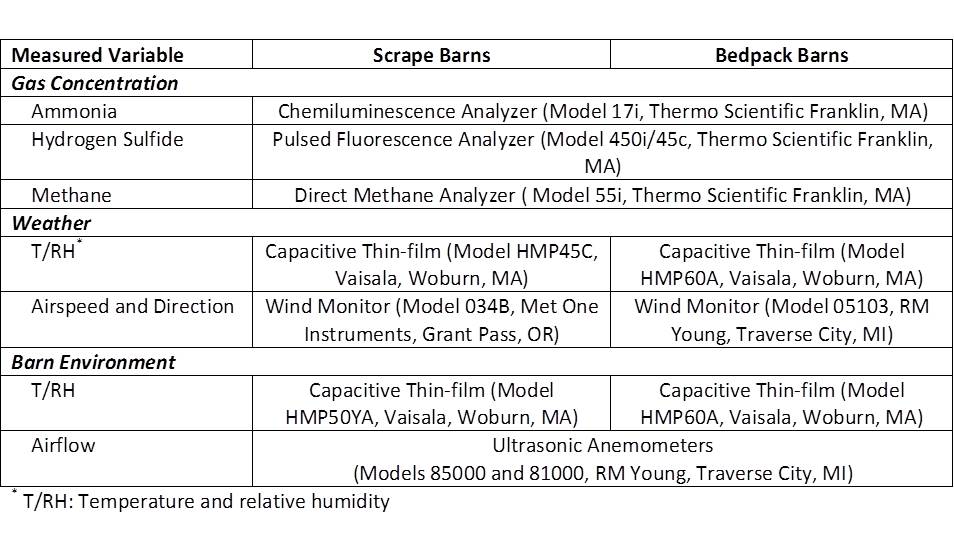
Four producer-owned and operated beef deep-bedded mono-slope facilities were selected for monitoring. Two barns maintained deep-bedded manure packs (Bedpack), whereas two barns scraped manure and bedding from the pens weekly (Scrape). Each site was monitored continuously for one month each quarter for two years to capture both daily and seasonal variations. At each facility, the environment-controlled instrument trailer and associated equipment were located adjacent to the barn. The trailer contained:  a gas sampling system (GSS) that consisted of Teflon tube sample lines connected to a computer-controlled sampling manifold, gas analyzers, computer, data acquisition system, calibration gas cylinders, and other supplies. In addition to the sampling lines, there were environmental instruments to measure the airflow and weather conditions for two pens in each barn. The analyzers and sensors used are summarized in Table 1.

Table 1. Analyzers and sensors used for air quality and environmental monitoring

Ammonia, hydrogen sulfide and methane concentrations were sequentially sampled from two south wall locations and three north wall locations per pen. The maximum hourly mean concentrations measured at the north or south wall of either pen in the barn were used in this analysis. The seasonal average hourly means of maximum concentrations and corresponding environmental variables were calculated.

What Have We Learned?

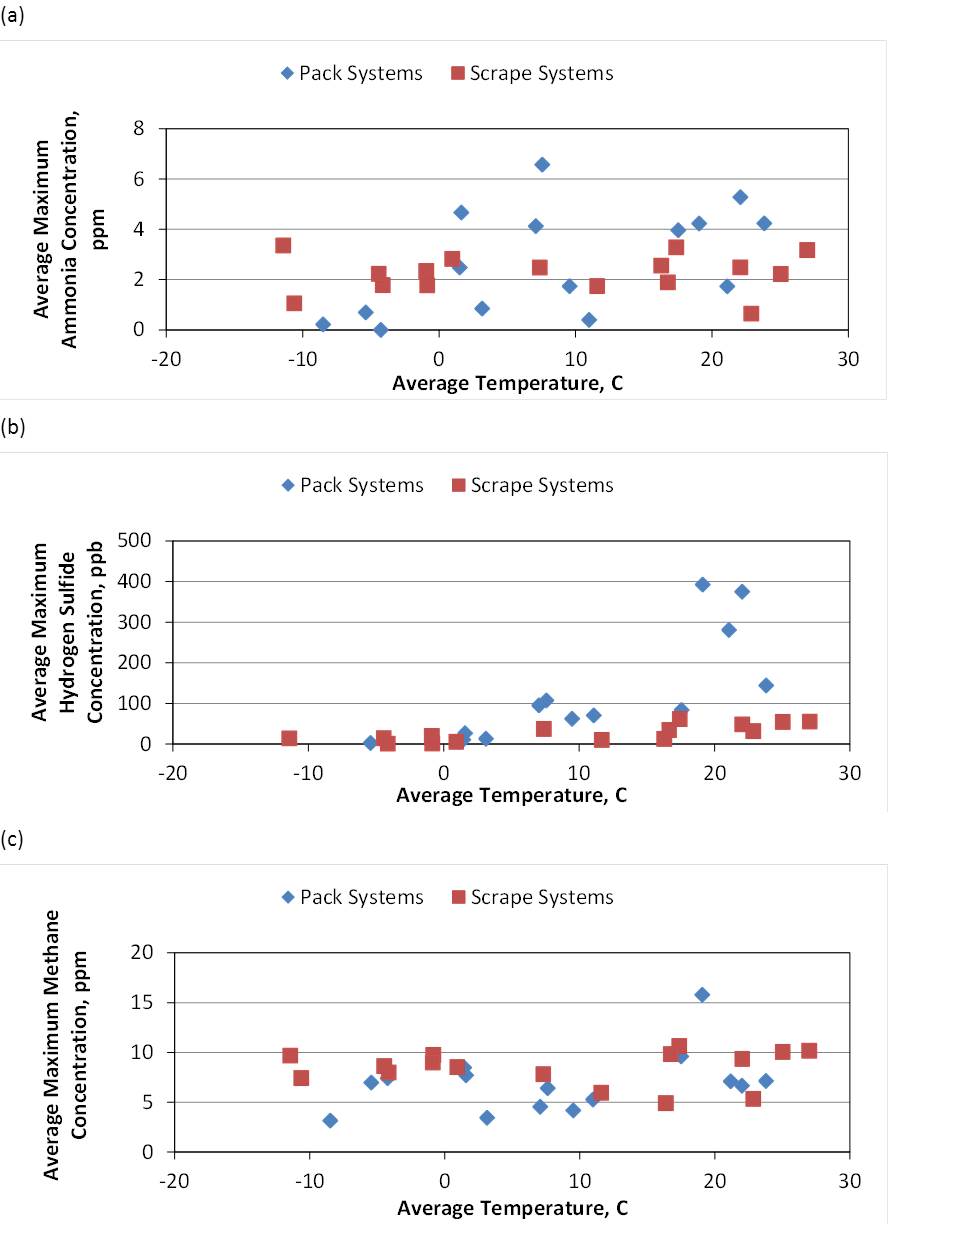
Figure 2. Seasonal averages of maximum hourly mean ammonia (a), hydrogen sulfide (b) and methane (c) concentrations for the bedpack and scrape manure management systems monitored in four monoslope cattle facilities, as influenced by ambient temperature.

The seasonal average hourly maximum ammonia concentration ranged from 0.6 to 3.3 ppm with the Scrape barns and from 0.2 to 7.1 ppm with the Bedpack barns (Fig 2a). The range of maximum hydrogen sulfide concentrations was 0 to 61 ppb in the Scrape barns and 0 to 392 ppb in the Bedpack barns (Fig 2b). The maximum methane concentration ranges were 4.9 to 10.6 and 3.1 to 15.8 ppm in the Scrape and Bedpack barns, respectively (Fig 2c). There are indications of differences between gas release rates for bedpack and scrape manure management systems and increased release rates with temperature for ammonia and hydrogen sulfide. Methane concentrations were more consistent between systems and for different temperature conditions.

This project expands the knowledge base of gaseous concentrations from deep-bedded beef barns. This integrated project also provides management techniques that producers can implement to minimize emissions, and improve air quality.

Future Plans

Emission values will be calculated using these concentration data, in conjunction with airflow data, which also varies with site and temperature conditions.

Authors

Erin L. Cortus, Assistant Professor, South Dakota State University, erin.cortus@sdstate.edu

Md Rajibul Al Mamun, Graduate Research Assistant, South Dakota State University

Ferouz Y. Ayadi, Graduate Research Assistant, South Dakota State University

Mindy J. Spiehs, Research Animal Scientist, USDA ARS Meat Animal Research Center

Stephen Pohl, Professor, South Dakota State University

Beth E. Doran, Extension Beef Program Specialist, Iowa State University Extension and Outreach

Kris Kohl, Extension Ag Engineer Program Specialist, Iowa State University Extension and Outreach

Scott Cortus, Engineering Research Technician, South Dakota State University

Richard Nicolai, Associate Professor (Retired), South Dakota State University

Additional Information

Acknowledgements

Project funded by Agriculture and Food Research Initiative Competitive Grant no. 2010-85112-20510 from the USDA National Institute of Food and Agriculture. Technical assistance provided by Alan Kruger, John Holman, Todd Boman, and Bryan Woodbury.

The authors are solely responsible for the content of these proceedings. The technical information does not necessarily reflect the official position of the sponsoring agencies or institutions represented by planning committee members, and inclusion and distribution herein does not constitute an endorsement of views expressed by the same. Printed materials included herein are not refereed publications. Citations should appear as follows. EXAMPLE: Authors. 2013. Title of presentation. Waste to Worth: Spreading Science and Solutions. Denver, CO. April 1-5, 2013. URL of this page. Accessed on: today’s date.

On-Farm Comparison of Two Liquid Dairy Manure Application Methods in Terms of Ammonia Emission, Odor Emission, and Costs

Waste to Worth: Spreading science and solutions logoWaste to Worth home | More proceedings….

Abstract

* Presentation slides are available at the bottom of the page.

Ammonia and odor emissions from land application of liquid dairy manure, and costs associated with manure land application methods are serious concerns for dairy owners, regulators, academic, and the general public. Odor and ammonia samples from agricultural fields receiving liquid dairy manure applied by surface broadcast and subsurface injection methods were collected and analyzed. Costs associated with both of the manure application methods were estimated. The test results showed that subsurface injection reduced both the odor and ammonia emissions compared with surface broadcast; therefore, applying liquid dairy manure by subsurface injection could be recommended as one of the best management practices to control ammonia and odor emissions. The estimated costs associated with subsurface injection were higher than surface broadcast. However the higher costs could be partially compensated by the higher nitrogen fertilizer value captured in the soil by the deep injection method.

Why Study Air Emissions from Dairy Farms?

A floating self-propelled mixing pump and a remote controller (yellow)

Agriculture is the single most important economic sector in Idaho. Dairy production currently stands as the single largest agricultural pursuit in Idaho. Currently, Idaho ranks as the third largest milk production state in the US. Idaho has roughly 550 dairy operations with 580,000 milk cows. Over 70% of milk cows are located in the Magic Valley in southern Idaho (Idaho Department of Agriculture-Bureau of Dairying, 1/22/2013). A number of dairies in the Magic Valley use flushing systems resulting in huge amount of lagoon water which is applied to crop lands near the lagoons via irrigation systems during the crop growing seasons. The volatilization of ammonia (NH3) from the irrigated lands and lagoons is not only a loss of valuable nitrogen (N), but also causes air pollution. Concentrated dairy production in a limited area such as the Magic Valley has caused air and water quality concerns. Controlling odor and capturing N in dairy manure are big challenges facing the southern Idaho dairy industry.

Direct injection incorporates manure directly beneath the soil surface and thus minimizes odor and NH3 emissions during application. Injecting manure decreases soluble phosphorus (P) and N in runoff relative to surface application. Some common types of direct injection applications are liquid tankers with injectors and drag-hose systems with injectors. Manure can be successfully injected in both conventional tillage and non-till systems with currently available equipment. The manure direct injection has been proven in other regions, such as the Midwest, to effectively manage odors and manure nutrients. The purpose of this research was to demonstrate, evaluate, and encourage the widespread adoption of the manure direct injection method in southern Idaho for mitigating odors and managing manure nutrients.

Subsurface injection with drag hose system

What Did We Do?

A manure application field day was held on October 31, 2012 on a dairy in Buhl, Idaho, to demonstrate and evaluate dairy manure land application via a drag-hose system and manure mixing equipment. The dairy had approximately 3,500 milking cows managed in a free-stall and open-lot mix set-up, with about 60% of the cows housed in free stalls. Waste is flushed from lanes running under the feeding alleys and from the milking parlor. The wastewater passes through solids removal equipment and basins and then into three lagoons in series. Manure used for this demonstration study was from the last lagoon, which had about 9 million gallons of manure at the beginning of the demonstration field day and its sludge had been not cleaned for 5 years.

Soil after manure subsurface injection

The on-farm manure application trials conducted at two sites were comprised of two manure application methods: surface broadcast and subsurface injection. At each of the sites, a square plot of approximately 3,600 m2 in the western portion of the site was used for surface broadcast and the rest of the land was used for subsurface injection. The western portion of the site was chosen because the prevailing winds were from the north during the test period. The previous crop at the two sites was corn; both sites had been disked after harvest.

The manure lagoon was agitated before and during application with a floating mixing pump. Manure was pumped from the lagoon directly to the application field via drag hoses. The two manure application methods were demonstrated with the same equipment. Subsurface injection placed manure behind the shank in a band approximately 20 cm (8 inches) deep. Surface broadcast was realized by lifting the shanks above ground so manure was applied on the soil surface. Manure was applied from east to west and back again until the site was finished. The equipment shanks were lifted only when the equipment was in the designated 3,600 m2 square plot for surface application. After manure application in the site, three towers, each 1.5 m high, were placed in a north-to-south orientation with approximately 15 m spacing. The middle tower was placed at the center of the manure surface applied plot. Three towers were placed in the manure subsurface injected field parallel to the ones in the manure surface broadcasted plot and approximately 200 m apart to avoid or minimize cross-contamination between the two manure application methods.

Passive NH3 samplers (Ogawa & Co. USA Inc., Pompano Beach, FL) were installed on each tower at a height of 0.5 and 1 m to determine the NH3 concentration at each location. Ammonia samplers were changed approximately every 24 hours over a two-day period after manure application. Right after collection of NH3 samplers in field, samplers were placed into airtight containers and then shipped back to the U-Idaho Twin Falls Waste Management Laboratory where the NH3 sampler filters were carefully removed from the samplers and transferred into 15-mL centrifuge tubes. Five mL of 1 M KCI was added to each of the centrifuge tubes to extract NH3 trapped in the filters. The extractant was transported to the USDA Northwest Irrigation and Soils Research Laboratory (NWISRL) located in Kimberly, Idaho where it was analyzed for NH4-N using a flow-injection analysis system (Quickchem 8500, Lachat Instruments, Milwaukee, WI). Background concentrations of NH3 were determined by placing three towers 50 m upwind (north) of the site following the same procedure described previously. Concentrations from passive samplers are time-average concentrations for the amount of time the sampler was exposed to the air and were calculated with the following equation:

[NH3-N]air (mg/m3) = 1,000,000 *[NH4-N]extractant (mg/L)/200/time deployed (min)/31.1 (cm3/min)

In this, [NH3-N]air is the concentration of NH3-N in the air, [NH4-N]extractant is the concentration of NH4-N in the extractant, and 31.1 cm3/min is a constant used to calculated diffusion to the trap (Roadman et al., 2003; Leytem et al., 2009). Details regarding the design and calculation of NH3 concentrations can be found in Roadman et al. (2003) and Leytem et al. (2009).

Air samples were collected from the first test site right after manure application using Tedlar bags. One air sample was collected at 1 m above ground from each of the three towers located in the surface broadcast plot, subsurface injection, and background, respectively. A total of nine air samples were collected and then sent via UPS over-night service to Iowa State University Olfactometry Laboratory for odor analysis. The nine air samples were analyzed within 24 hours based on ASTM E679-04 (ASTM, 2004).

For each test site, a grab sample (about 1 L) of liquid manure was collected and transported to a commercial lab (Stukenholtz Laboratory, Inc., located in Twin Falls, Idaho) for pH and total nitrogen analysis. The manure pH, total N, and calculated total N application rates are shown in Table 1. The liquid manure application rate was approximately 20,000 gallons per acre on both the test sites.

Table 1. Manure pH and total N concentrations and application rates of total N at the two test sites

Site and Application Method

Manure pH

Manure total N concentration (mg/L)

Manure total N Application Rate (kg/acre)

Site 1

7.4

3433

257

Site 2

7.3

3519

265


A soil temperature probe with data logger (HOBO U23 Pro v2 2x external temperature data logger-U23-003) was placed 3 cm below the soil surface to record soil temperature data in 15-min increments. Wind speed, temperature, and relative humidity data were obtained from local Buhl Airport, located six miles from the test sites, due to failure of the mobile weather station set on the test sites. The ambient weather conditions and soil temperature at the test sites over the test period are shown in Table 2.

Table 2. Ambient weather conditions and soil temperature at the test sites


Site 1

Site 2

Item

Day 1

Day 2

Day 1

Day 2

Average wind speed, m/s

5.0

4.2

4.2

3.1

Air temperature,  average(minimum, maximum),˚F

61 (42, 78)

49 (45, 63)

49 (45, 63)

47 (38, 61)

Average relative humidity,  %

28

53

53

51

Soil temperature, average(minimum, maximum), ˚F

50.9               (51.1, 56.1)

47.3              (51.1, 51.2)

46.5                (51.5, 52.1)

66.7              (51.6, 69.1)

Cost analysis was carried out for four different manure land application systems as shown in the “What Have We Learned?” section below. Cost calculations are based on 500 hours annual use for the tractor and 200 hours annual use for the injection system. Tractor operator labor is figured at $11.70/hour, diesel is figured at $4.00/gallon. Equipment costs were determined using the MACHCOST program from the University of Idaho’s department of Agricultural Economics and Rural Sociology. The program is available on the AERS web page at https://www.uidaho.edu/cals/idaho-agbiz/resources/tools. Equipment data was provided by John Smith at Smith Equipment Co. Rupert, ID 83350. Some machinery data was taken from “Costs of Owning and Operating Farm Machinery in the Pacific Northwest” PNW 346 available on line at: https://www.extension.uidaho.edu/publishing/pdf/PNW/PNW0346/PNW0346.html.

What Have We Learned?

Odor results from test site 1

T-test for Odor showed there was no significant difference between the background and subsurface injection (P=0.41), there was significant difference between the background and surface broadcast (P=0.03), and P value was 0.08 for the t-test of mean difference between the subsurface injection and surface broadcast. The field day attendees felt there was significant difference in odor perception between the subsurface injection and surface broadcast methods.

Test site 1

First day ammonia sample results from test site 1.

Second day ammonia sample results from test site 1.

The NH3 concentration data from test site 1 showed significant difference between surface broadcast and subsurface injection based on P<0.05. The NH3 concentration data from test site 1 showed 82% and 64% reduction in NH3 concentration for first and second sampling day, respectively when liquid dairy manure was applied by subsurface injection vs. surface broadcast.

Test site 2

First day ammonia sample results from test site 2.

Second day ammonia sample results from test site 2.

The NH3 concentration data from test site 2 showed significant difference between surface broadcast and subsurface injection based on P<0.05. There were 64% and 41% decrease in NH3 concentration for first and second sampling day, respectively when manure was applied by subsurface injection compared with surface broadcast.

The NH3 concentration data from both the test sites showed lower NH3 concentration in the air from the subsurface injected soil vs. surface applied land which means higher nitrogen fertilizer value captured in the soil by the subsurface injection method.

Cost analysis results:

*Fuel and Lubricant Costs are assigned to the Power Unit.

The above fact sheet summarizes probable costs of operation for a 7,400 gallon tank with a 2,000 gpm discharge rate and a 15 foot wide broadcast unit. A 180 PTO HP tractor is needed to pull this unit at an average ground speed of 8 mph. Up to 10 acres per hour can be covered with the unit. The tank is discharged in approximately 4 minutes. Time and equipment to refill the tank is not included in these calculations.

*Fuel and Lubricant Costs are assigned to the Power Unit.

The above fact sheet summarizes probable costs of operation for a 7,400 gallon tank with a 2,000 gpm discharge rate and a 12 foot wide broadcast unit. A 215 PTO HP tractor is needed to pull this unit at an average ground speed of 7 mph. Up to 7 acres per hour can be covered with the unit. The tank is discharged in approximately 4 minutes. Time and equipment to refill the tank is not included in these calculations.

*Fuel and Lubricant Costs are assigned to the Power Unit.

The above fact sheet summarizes probable costs of operation for a 7,400 gallon tank with a 2,000 gpm discharge rate and a 12 foot wide broadcast unit. A 225 PTO HP tractor is needed to pull this unit at an average ground speed of 7 mph. Up to 7 acres per hour can be covered with the unit. The tank is discharged in approximately 4 minutes. Time and equipment to refill the tank is not included in these calculations.

*Fuel and Lubricant Costs are assigned to the Power Unit.

The above fact sheet summarizes probable costs of operation for a system utilizing 5,280 FT of 8 inch hose and 1,320 FT of 5 inch hose. The pump unit capacity is 1,500 gpm to a 16 foot knife injection unit. A 250 PTO HP tractor is needed for the injection unit operating at 75% field efficiency and at an average ground speed of 3.5 mph. The lagoon pump is a 270 HP unit and operating efficiency assumed at 70%. Beyond 2 miles a booster pump would be necessary. Up to 4.75 acres per hour can be covered with the unit. Operation is continuous as no tank refill is needed.

Based on the estimated costs above, the subsurface injection method has higher costs mainly due to the need of larger tractor and lower operating speed. However, we did not include the time and equipment costs associated with refilling the tank for the tank application system. Due to the short time to discharge the tank on the tank broadcast and tank injection systems additional equipment to refill the tank in a timely fashion would be desirable. This would increase the investment in equipment and also would reduce the number of acres that could be covered per hour due to down time while the tank is refilled.

In summary, subsurface injection can reduce both the odor and NH3 emissions compared with surface broadcast; therefore, applying liquid dairy manure by subsurface injection could be recommended as one of the best management practices to control NH3 and odor emissions. The estimated costs associated with subsurface injection were higher than surface broadcast. However, the higher costs could be partially compensated by the higher nitrogen fertilizer value captured in the soil by the subsurface injection method.

Future Plans

We will finish development of educational videos to demonstrate the manure subsurface injection technique and disseminate results from this study to our stakeholders.

Authors

Lide Chen, Waste Management Engineer and Assistant Professor, Biological and Agricultural Engineering Department, University of Idaho lchen@uidaho.edu

Mario de Haro Marti, Extension Educator

Wilson Gray, District Extension Economist and Extension Professor

Howard Neibling, Extension Irrigation and Water Management Specialist and Associate Professor

Mireille Chahine, Extension Dairy Specialist and Associate Professor

Sai Krishna Reddy Yadanaparthi, Graduate student, University of Idaho

Acknowledgements

This project was supported by the USDA Natural Resource Conservation Service through a Conservation Innovation Grant. We would also like to thank Dr. April Leytem and Mr. Myles Miller (USDA Northwest Irrigation and Soils Research Laboratory (NWISRL) located in Kimberly, Idaho) for their help with analysis of ammonia samples.


The authors are solely responsible for the content of these proceedings. The technical information does not necessarily reflect the official position of the sponsoring agencies or institutions represented by planning committee members, and inclusion and distribution herein does not constitute an endorsement of views expressed by the same. Printed materials included herein are not refereed publications. Citations should appear as follows. EXAMPLE: Authors. 2013. Title of presentation. Waste to Worth: Spreading Science and Solutions. Denver, CO. April 1-5, 2013. URL of this page. Accessed on: today’s date.
 

Litter Generated Ammonia Captured by Activated Carbon Derived ffrom Broiler Litter

Waste to Worth: Spreading science and solutions logoWaste to Worth home | More proceedings….

Abstract

In 2011, the production rate of broilers was 8.6 billion with a value of $23.2 billion (USDA 2012).  Both CERCLA and EPCRA have reporting requirements for ammonia (NH3) of 100 lb of NH3/d or 18.3 tons/yr, a level that may affect large animal production facilities (NRC 2003). Although USEPA (2009) has provided an exemption for animal waste producing farms under CERCLA for reporting hazardous air emissions, it is expected that this exemption will be revoked once valid methodologies are established for monitoring. Two of the 24 sites in the NAEMS monitoring study reported similar NH3 emissions of 3.6 – 5.3 tons of NH3 per house per year (Burns et al. 2009, Heber 2010). Emissions of this level indicate a need for developing technologies that can reduce the NH3 levels produced by broiler operations. This research is focused on the use of broiler litter as activated carbon (BAC) to reduce aerial NH3 generated by litter, an opportunity to not only reuse the manure, but also treat the emissions from or within broiler houses. The objective of this study was to evaluate the efficacy of BAC to remove NH3 volatilized from litter samples in a laboratory acid-trap system. Preliminary studies using NH3/air mixture indicated that the BAC capacity to adsorb NH3 was approximately double that of Vapure 612, a commercial carbon. In the litter emission study, the BAC and Vapure performance was comparable. Breakthrough for both carbons occurred within 14 hours of the test start. At the end of the 3 day test, the NH3 emission for BAC was 75% of the litter only control, whereas, the Vapure emission was 64% of the control. The results of the study demonstrate the potential for a cyclical waste utilization strategy in using broiler litter activated carbon to capture NH3 volatilized from litter.

Why Study Ammonia and Poultry Litter?

Overall purpose of this study is to develop innovative solutions for animal waste reuse and minimize emissions from poultry operations. The specific objective of this phase of the study was to evaluate the efficacy of activated carbon from broiler litter (BAC) to remove NH3 volatilized from litter samples in a laboratory acid-trap system.

What Did We Do?

The broiler litter for producing the BAC was obtained from a commercial farm in Mississippi, where the original bedding was pine shavings.  The broiler litter as collected had a moisture content of 25 to 30%.  The commercial carbon, Vapure 612 carbon (Norit Americas, Marshall, Texas), is a steam activated coal-based carbon manufactured for use in the removal of odors, toxic vapors, irritants, and corrosive gases.  After completing initial adsorption tests with the two carbons using the NH3 and air mixture, litter samples were collected from a commercial Mississippi farm where the bedding origin was also pine shavings to perform the litter emission test.  Eleven flocks had previously been grown on the litter.  The pH and moisture content were 8.32 and 17.9% respectively. The litter samples were placed in the acid trap system described below to determine the capture capacity of the carbons for NH3 volatilized from the litter. 

Litter emissions and carbon efficacy were evaluated using 50 g fresh litter samples in the laboratory using a chamber acid trap (CAT) system. The CAT system provides a straightforward method for determining differences in NH3 evolution by capturing off-gases in H3BO3. Twelve air-tight chambers, 1000 ml each, receive humidified air from a single manifold.  Weighed litter samples were placed in each air tight chamber.  To assess litter NH3 generation, exhaust air from each chamber flowed through a series of two H3BO3 flasks at approximately 115 ml/min.  The solution from the two flasks was combined into a single sample and titrated with HCl as above.  The NH3 trapped in solution was reported as mg N recovered.  For estimating carbon column efficiency, the columns described above were loaded with BAC and Vapure carbons and placed in the exhaust flow between the chambers and acid traps.  The litter only, BAC and Vapure columns were randomly assigned to the chambers in the CAT system and each replicated three times.  All treatments were titrated each morning and afternoon at consistent times for the three day test period. 


Chamber acid-trap system for capturing NH3 in the laboratory:  a) litter in chamber, b) activated carbon column, and c) boric acid traps. 

What Have We Learned?

Preliminary studies using NH3/air mixture indicated that the BAC capacity to adsorb NH3 was approximately double that of Vapure 612, a commercial carbon. In the litter emission study, the BAC and Vapure performance was comparable. Breakthrough for both carbons occurred within 14 hours of the test start. At the end of the 3 day test, the NH3 emission for BAC was 75% of the litter only control, whereas, the Vapure emission was 64% of the control. The results of the study demonstrate the potential for a cyclical waste utilization strategy in using broiler litter activated carbon to capture NH3 volatilized from litter. 

Future Plans

The development of these activated carbons and char from broiler litter will provide an effective means of reuse that will not only reduce waste volume, but in turn comprehensively treat the emissions from the waste during bird production, storage, and land application of litter. We will conduct greenhouse gas adsorption studies to determine the efficacy of activated carbon and char to adsorb CO2, CH4, and N2O.

Additionally, our plan is to develop an outreach program to be presented to poultry farmers in the Southeast U.S. along with other stakeholders addressing poultry farm emission regulations and technologies for remediation through workshops, a webinar and professional conferences.

Authors

Kari Fitzmorris Brisolara, ScD, Associate Professor of Environmental and Occupational Health, Louisiana State University, Health Sciences Center, School of Public Health, 2020 Gravier Street, New Orleans, Louisiana kbriso@lsuhsc.edu

Dana M. Miles, PhD, USDA-ARS-Mississippi State, Genetics & Precision Agriculture Research Unit, P. O. Box 5367, Mississippi State, Mississippi, 39762 dana.miles@ars.usda.gov

Isabel M. Lima, PhD, USDA-ARS-SRRC, P.O. Box 19687, New Orleans, Louisiana 70179 isabel.lima@ars.usda.gov


The authors are solely responsible for the content of these proceedings. The technical information does not necessarily reflect the official position of the sponsoring agencies or institutions represented by planning committee members, and inclusion and distribution herein does not constitute an endorsement of views expressed by the same. Printed materials included herein are not refereed publications. Citations should appear as follows. EXAMPLE: Authors. 2013. Title of presentation. Waste to Worth: Spreading Science and Solutions. Denver, CO. April 1-5, 2013. URL of this page. Accessed on: today’s date.
Ammonia Emissions from Animal Agriculture: An Introduction

Air emissions from animal agriculture operations consist of many different gases as well as suspended particulates (dust or microbes). One of these gases, ammonia, is gaining greater attention for its role in odor, but also as a precursor of fine particulate matter (PM 2.5). PM 2.5 has implications in haze and visibility as well as human health. The materials on this page were developed to assist educators and professors who include an introduction to include ammonia emissions as a topic in their classrooms or programs.

 Fact Sheets

Alternate download: Ammonia from Cattle Operations part 1 (Introduction) and part 2 (abatement) combined in a single document (17 pages; PDF format)

Videos

Ammonia Deposition Alpine Ecosystems


A look at the growing concern about the impacts of ammonia deposition in Rocky Mountain National Park.

___

Ammonia Emissions

Rick Todd, USDA ARS (10 minutes)

Presentation Slides

Acknowledgements

These materials were developed by the Air Quality Education in Animal Agriculture (AQEAA) project with with financial support from the National Research Initiative Competitive Grant 2007-55112-17856 from the USDA National Institute of Food and Agriculture.

For questions about the materials on this page contact Dr. Ron Sheffield, Louisiana State University Ag Center. For questions about the AQEAA project, contact Dr. Rick Stowell, University of Nebraska (rstowell2@unl.edu).

If you need to download a copy of a segment, submit a request.

___

Photo (right): Ammonia is a precursor to fine particulate matter (also known as PM 2.5) which can lead to hazy conditions. These conditions are becoming a more common occurrence for visitors to Rocky Mountain National Park.

Mitigating Ammonia Emissions from Animal Agriculture

Air emissions from animal agriculture operations consist of many different gases as well as suspended particulates (dust or microbes). One of these gases, ammonia, is gaining greater attention for its role in odor, but also as a precursor of fine particulate matter (PM 2.5). PM 2.5 has implications in haze and visibility as well as human health.

The materials on this page were developed to be used by educators and professors who include this topic in their classrooms or educational programs.

Fact Sheet

Sharon L. P. Sakirkin, Texas AgriLife Research; N. Andy Cole and Richard W. Todd, USDA-Agricultural Research Service; Brent W. Auvermann, Texas AgriLife Extension Service, Texas AgriLife Research

Alternate download: Ammonia from Cattle Operations part 1 (Introduction) and part 2 (abatement) combined in a single document (17 pages; PDF format)

Videos

Reducing Ammonia Emissions from Cattle Feedyards (5 min)

Andy Cole, USDA ARS

___

Mitigation of Nitrogen Excretion Through Dietary Manipulations

Mark Hanigan, Virginia Tech (14 minutes)

Note: the pixelation present at the start cleans up at the 2:00 minute mark

Presentation Slides

Archived Webinar

This webinar contains four individual video segments (ranging from 10 to 27 minutes) that discuss current and future mitigation options for reducing ammonia emissions from poultry litter. Presenters are: Eileen Wheeler, Pennsylvania State University; Hongwei Xin, Iowa State University; and Robert Burns, University of Tennessee. The archive also includes handouts and links to additional information. If you have difficulties please see our webcast troubleshooting page. If you need to download a copy of a segment, submit a request.

Acknowledgements

These materials were developed by the Air Quality Education in Animal Agriculture (AQEAA) project with with financial support from the National Research Initiative Competitive Grant 2007-55112-17856 from the USDA National Institute of Food and Agriculture.

For questions about the materials on this page contact Dr. Kevin Janni, University of Minnesota (kjanni@umn.edu). For questions about the AQEAA project, contact Dr. Rick Stowell, Unviersity of Nebraska (rstowell2@unl.edu).

If you have presentations, photos, video, publications, or other instructional materials that could be added to the curricula on this page, please contact Dr. Janni or Jill Heemstra (jheemstra@unl.edu).

Does aeration tend to increase ammonia volatilization?

Aeration’s effect on ammonia volatilization depends on the type of system employed. Some aeration systems are specifically designed to accomplish nitrogen removal by providing enough oxygen to allow microbial reactions to convert ammonia-N to nitrate or nitrite (which can subsequently be converted to dinitrogen gas (N2) and be released harmlessly). If these systems are properly designed and operated, ammonia concentrations will be small in the treatment system, and ammonia emissions will be greatly reduced.

For low- to medium-level aeration systems, where the objective is primarily odor control, the answer is not so clear. Tendency for ammonia volatilization increases with increasing temperature and with increasing surface area between the liquid and the air (provided by increasing aeration rate). So, for a constant ammonia concentration in the liquid, ammonia volatilization would be expected to increase with increased aeration rate, although at low temperatures this effect might be small. However, volatilization rates decrease with decreasing ammonia concentration in the liquid, so if the aeration system causes a decrease in the ammonia concentration, the overall effect could be a decrease in ammonia emissions. These interactions are fairly complicated, and more work is needed before reliable predictions can be made.

Author: Sarah Liehr, North Carolina State University

Efficacy of Vegetative Environmental Buffers to Mitigate Emissions from Tunnel-Ventilated Poultry Houses

Reprinted, with permission, from the proceedings of: Mitigating Air Emissions From Animal Feeding Operations Conference.

The proceedings, “Mitigating Air Emissions from Animal Feeding Operations”, with expanded versions of these summaries can be purchased through the Midwest Plan Service.

This Technology is Applicable To:

Species: Poultry (Broiler and Turkey)
Use Area: Animal Housing
Technology Category: Environmental Barriers
Air Mitigated Pollutants: Dust, Ammonia, Odor

System Summary

Emissions of dust, gases and odor from poultry facilities pose major challenges for the poultry industry worldwide. Cost-effective technologies to abate emissions from modern tunnel-ventilated poultry houses are limited. In 2002 a three-row planting of trees was installed opposite two, 1.2 meter (4 ft) diameter tunnel fans to evaluate vegetative environmental buffers (VEB) as a means of mitigating emissions from the poultry house. The first row, 9.1 meters (30 ft) from the fans was 4.8 meter (16 ft) high bald cypress, followed by 4.3 meter (14 ft) high Leyland cypress and the outer most row of 2.4 meter (8 ft) high Eastern red cedar. Over the next six years the efficacy of these trees to reduce total dust, ammonia and odor was determined. Measurements were taken at 1.2 meter (4 ft) height on 47 days during peak fan operation with market-age broilers. The relative change in concentration across this 6.7 meter (22 ft) wide vegetative buffer found the VEB significantly reduced total dust, ammonia and odor by 56%, 54% and 26%, respectively. Meteorological conditions and the type of crop next to the VEB appeared to influence the efficacy of vegetation to reduce odor. Dust and ammonia concentration was influenced by these factors to a lesser degree. This suggests the use of trees as vegetative filters may offer a long-term, cost-effective means of partially abating emissions from houses. The local poultry industry trade association for the Delmarva Peninsula has hired a coordinator to implement tree plantings around farms to help abate emissions and to be proactive in addressing increasing neighbor-relations concerns.

Applicability and Mitigating Mechanism

  • Certain plants have the ability to absorb ammonia and capture particulates
  • Vegetation also acts as a sink for chemical constituents of odor
  • A properly designed windbreak aids in dispersion and dilutions of odors as well as reducing wind speed
  • A VEB planting has multiple goals; abate emissions, improve neighbor-relations, and provide shade and shelter of the house

Limitations

  • Growers need technical assistance on the proper design, implementation and care of VEB that is tailored to the unique features of each operation
  • Retrofitting a farm with VEB to capture emissions from all fans is difficult.
  • Species of tree and proper implementation influences time required for VEB to become effective in reducing emissions
  • VEB is a practical and multi-purpose BMP to partially abate emissions.


Cost

Average cost for implementing a VEB on an existing broiler farm is ~$5,500. Cost range from $1,500 for a limited one-row planting to provide a visual screen of the farm, and up to $12,000 for multi-row plantings around the outside perimeter of the poultry houses. There is limited information on design and efficacy of VEB plantings between houses. Locally, cost-share programs have provided support to cover most of the costs associated with implementing this program. Plantings to address neighbor-relations have been a driving factor in VEB establishment. An estimated 1/3 of all poultry farms have established VEB on the Delmarva Peninsula. A VEB is also a requirement for a new house loan from one of the major lending institutions.

Authors

George Malone1, Gary VanWicklen1, Stephan Collier1
1University of Delaware
Point of Contact:
George Malone, malone@udel.edu

The information provided here was developed for the conference Mitigating Air Emissions From Animal Feeding Operations Conference held in May 2008. To obtain updates, readers are encouraged to contact the author.

Atomization Treatment to Improve Air Quality in a Swine Concentrated Animal Feeding Operation (CAFO)

Reprinted, with permission, from the proceedings of: Mitigating Air Emissions From Animal Feeding Operations Conference.

The proceedings, “Mitigating Air Emissions from Animal Feeding Operations”, with expanded versions of these summaries can be purchased through the Midwest Plan Service.

This Technology is Applicable To:

Species: Swine
Use Area: Animal Housing
Technology Category: Other Treatment
Air Mitigated Pollutants: Particulate Matter (PM), Viable Bacteria, Ammonia

System Summary

Juergens Environmental Control Systems are designed to reduce particulate matter (PM), viable bacteria and ammonia and utilizes a high pressure atomization solution. Treatment consists of a formulation comprising proprietary proportions of corn oil, citric acid, ethyl alcohol, eucalyptus, vanilla and water. The formulation was developed to reduce airborne PM and ammonia through short- and long-term mechanisms. The short-term mechanisms include oil encapsulation through electrostatic attraction and coagulation. Long-term reductions occur through the suppression of dust re-suspension. Citric acid is added to neutralize gaseous ammonia. Alcohol helps dry the atomized aerosol and serves as an adjuvant so that formulation components are in complete suspension. Vanilla is added providing a deception for the olfactory senses, and eucalyptus for its respiratory medicinal property. Final formulation is atomized for 5 seconds, six times a day at a pressure of 235 psi (1620 kPa) and a rate of 45 mL/m2. The nozzles are located on the ceiling at 5 or 10 foot centers for complete coverage of the treated area and were designed to produce an aerosol 1-10 ímin diameter under conditions of this formulation and pressure.

Applicability and Mitigating Mechanism

  • Atomization treatment is effective at swine housing systems, such as in finishing, breeding and gestation production systems.
  • The oil is in a water formulation that includes alcohol, citric acid, vanilla and eucalyptus to dry and help mix the atomization solution, neutralize gaseous ammonia, and provide a pleasant odor, respectively.
  • The oil formulation is applied under high pressure, yielding micron-sized charged particles that efficiently remove PM through electrostatic attraction and coagulation.

Limitations

  • Atomization treatment is effective at swine housing systems, such as in finishing, breeding and gestation production systems.
  • The oil is in a water formulation that includes alcohol, citric acid, vanilla and eucalyptus to dry and help mix the atomization solution, neutralize gaseous ammonia, and provide a pleasant odor, respectively.
  • The oil formulation is applied under high pressure, yielding micron-sized charged particles that efficiently remove PM through electrostatic attraction and coagulation.

Cost

Field application of the atomization system and solutions are subject to change. The fixed cost of the system for 1000 – 8000-pig finishing operation averages $1.96 – $7.79 per pig per 3 year term (shipping and installation labor not included). The cost of atomization operating averages $ 0.01 per pig per day over one year. The fixed cost of the system for 500-5000-sow operation averages $9.00 – $16.00 per sow per 3 year term (shipping and installation labor not included). The cost of atomization averages $.01 per sow per day over one year.

Authors

Peter E. Juergens1, Gary L. Rapp11Juergens Environmental Control
Point of Contact:
Gary Rapp, garyrapp@westianet.net

The information provided here was developed for the conference Mitigating Air Emissions From Animal Feeding Operations Conference held in May 2008. To obtain updates, readers are encouraged to contact the author.