A Quantitative Assessment of Beneficial Management Practices to Reduce Carbon and Reactive Nitrogen Footprints of Dairy Farms in the Great Lakes Region

w2w17 LogoProceedings Home | W2W Home 

Purpose 

Assessing and improving the sustainability of dairy production is essential to secure future food production. Implementation of Beneficial Management Practices (BMPs) can reduce carbon and reactive nitrogen footprints of dairy farms. BMPs can and have been developed for different farm components, including feed, manure management and field cultivation practices. It is practically and economically infeasible to empirically test all combinations of BMPs at a whole farm scale. We therefore use whole-farm process-based models to assess the impact of several Beneficial Management Practices (BMPs) on carbon and reactive nitrogen footprints of dairy farms in the Great Lakes region. Specifically the aim of this study is to evaluate the influence of Beneficial Management Practices (BMPs) on carbon, reactive nitrogen and phosphorus footprints of dairy farms in the Great Lakes region.

What did we do? 

1. Baseline farms

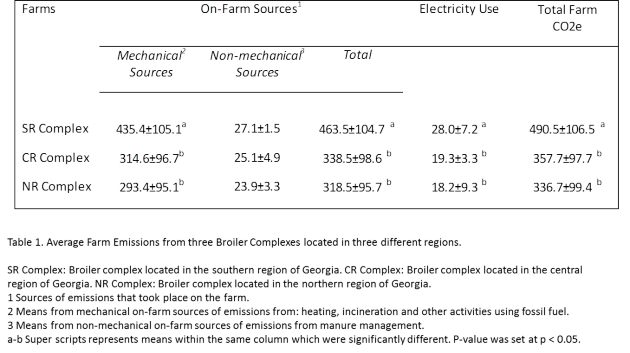
We developed two baseline model farms, a small 150 cow herd farm and a large 1500 cow herd farm, that are thought to be representative for current dairy farming practices in the Great Lakes region, particularly Wisconsin and New York State (Table 1). The two baseline dairy farms were developed based on individual team members’ expertise and a consultation with external experts (Dane County Conservationists, Madison, Wisconsin). For the 1500 cow farm, the baseline scenario was partly based on a previously-studied commercial dairy farm in NY state. Since this commercial dairy farm already employs some BMPs (e.g. anaerobic digestion as BMP in manure management), the farm was ‘downgraded’ to derive the baseline.

Table 1. Description of the baseline farms

2. Beneficial Management Practices

Farm-specific BMPs were developed for three farm components, i.e. “Feed”, “Manure Management & Storage” and “Field management”. These BMPS were developed based on expert judgement and are expected or known to reduce whole-farm GWPs.

To ensure a meaningful integration of BMPs and a consistent comparison of whole-farm BMPs to the baseline and to each other, we used the following set of rules (per farm type): i) Total cultivated area was fixed (areas of individual crops can vary per scenario); ii) Herd size was fixed; iii) Milk production was allowed to float, however, only if the production increased (no decreases in milk production); iv) Purchases of crops and protein mixes were minimized as far as possible.

Table 2. Individual BMPs for the 1500 and 150 cow farm

3. Process model simulation

The Integrated Farm System Model (IFSM4.3) was used to simulate the two baseline farms (i.e. 1500 cow farm in NY and 150 cow farm in WI) and all the individual BMPs. IFSM was used as a baseline model. The other process-based models, that is DNDC, APEX and CNCPS, were used to check IFSM predictions.

4.Whole-farm mitigation strategy

The individual BMPs were analyzed in terms of potential reduction in carbon and reactive nitrogen footprint. The best performing individual BMPs were combined into a whole-farm mitigation strategy and this whole-farm mitigation strategy was subsequently modeled in IFSM.

Figure 1. Combined mitigation strategies in terms of footprint avoided and (increase) in net return ($/cow

What have we learned? 

A comparison of model simulations of feed BMPs to the baseline shows that an integrated feed BMP (low forage, corn silage:alfalfa 3:1, ~2% NDF digestibility, reduced protein 14%, added fat, increased feed efficiency) can potentially reduce carbon and reactive nitrogen footprints with ~20% and ~24%, respectively, while remaining cost effective (18% increase in net return in $/cow), for both farm sizes.

For the small farm, replacing the bedded-pack barn with a free stall barn for the heifers, substantially reduces the carbon and the reactive nitrogen footprint with 12% and 11%, respectively. The manure management BMP ‘sealed with flare’ provides the largest potential reduction in carbon footprint for both farms (11% – 20%), primarily through a mitigation of CH4 emissions from manure storage.

Field management BMPs only provide a minimal reduction in carbon footprint (~3%), however, the field BMP ‘no-till with injection’ substantially reduces the reactive N footprint (~16%) for both farm sizes. This reduction is primarily achieved by a reduction in ammonia volatilization.

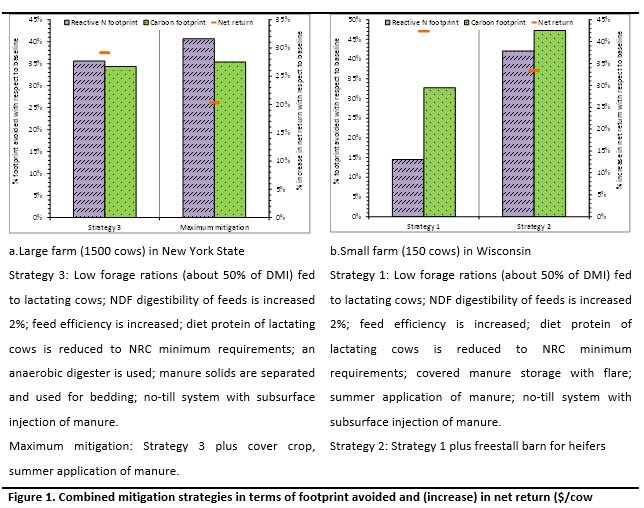
Based on the results for the individual BMPs, two combined whole-farm mitigation strategies were developed per farm and simulated in IFSM (Figure 1). For both the large farm and the small farm, the integrated whole-farm BMPs show an overall potential to reduce carbon and reactive nitrogen footprints with 33% to 37% and 15% to 42% respectively, simultaneously increasing milk production and the net return per cow with 10% to 12% and 20% to 42%, respectively.

This analysis suggests that BMPs can be applied to reduce greenhouse gas emissions and reactive nitrogen losses without sacrificing productivity or profit to the farmer.

Future Plans    

Future research plans include a further comparison and analysis of IFSM predictions with predictions from other process models, including CNCPS, APEX, and ManureDNDC. In addition, we will assess the impact of climate change on the reactive nitrogen and carbon footprint of the baseline farms and the developed whole-farm mitigation strategies.

Corresponding author, title, and affiliation         

Karin Veltman, PhD, University of Michigan, Ann Arbor

Corresponding author email    

veltmank@umich.edu

Other authors   

Alan Rotz, Joyce Cooper, Larry Chase, Richard Gaillard, Pete Ingraham, R. César Izaurralde, Curtis D. Jones, William Salas, Nick Stoddart, Greg Thoma, Peter Vadas, Olivier Jolliet

Additional information                

Veltman et al. (2017) Comparison of process-based models to quantify nutrient flows and greenhouse gas emissions associated with milk production. Agricultural Ecosystems and Environment, 237, 31–44

DairyCAP project, www.sustainabledairy.org, aims to reduce the life cycle environmental impact of dairy production systems in the US.

Acknowledgements       

This material is based upon work that is supported by the National Institute of Food and Agriculture, U.S. Department of Agriculture, under award number 2013-68002-20525. Any opinions, findings, conclusions, or recommendations expressed in this publication are those of the author(s) and do not necessarily reflect the view of the U.S. Department of Agriculture.

The authors are solely responsible for the content of these proceedings. The technical information does not necessarily reflect the official position of the sponsoring agencies or institutions represented by planning committee members, and inclusion and distribution herein does not constitute an endorsement of views expressed by the same. Printed materials included herein are not refereed publications. Citations should appear as follows. EXAMPLE: Authors. 2017. Title of presentation. Waste to Worth: Spreading Science and Solutions. Cary, NC. April 18-21, 2017. URL of this page. Accessed on: today’s date.

Are Models Useful for Evaluating or Improving the Environmental Impact of Pork Production?

green stylized pig logo

Models are basically equations that are based on real-world measurements. Measurements are made in different situations and/or different times. Models are used to make comparisons between different choices or look at “what if” scenarios without having to implement each possible option.

Generally, models that are created with large, diverse (but still compatible) data sets containing relevant information are going to be more reliable than models with smaller data sets with smaller data sets. Models can then be used to predict performance or evaluate changes in a system.

There are very good reasons to use models when looking at the environmental footprint of pork production:

  1. Efficiency. It is expensive and impractical to measure actual emissions from every farm or barn.
  2. Decision-making. Models allow farmers and their advisers to look at “what if?”. Prior to making an expensive decision, farmers can evaluate the location, type of building, manure storage, manure treatment, feed ration, etc. and select the best option.
  3. Measure progress trends. Models can be applied at different points in time to see if a farm or industry is making progress in reducing their impacts.

Are there limitations to models?

Yes. By their very nature, models are a simplified representation of a complex system. Modeling is a balance between complexity (how much information does the user need and how much time will it take?) and accuracy (how much is gained by including additional variables?).  The results must be evaluated in their appropriate context. As an example, many TV weather forecasters look at several sources of information, including models when formulating their forecast. While on a given day the forecast may be off (either due to inaccurate analysis or results) it is safe to say that overall, weather forecasting is greatly enhanced by the use of models.

Do you have an example of a model used on pig farms?

One example of a model that is currently looking at the environmental footprint of pork production is the Pork Production Environmental Footprint Calculator.  It currently estimates greenhouse gas (GHG) emissions and the day to day costs of the activities that generate those emissions, but research is underway to expand the model to include land,  and water footprints–leading to a more comprehensive “environmental footprint” model.

The model referenced above can be used for estimating the GHG emissions from the various operations on a pig farm in order to calculate the farm’s cumulative emissions. It shows where the major contributions arise, and provides a test bed for identifying strategies that reduce emissions at least cost. The model requires input information that most producers will know about their operation such as the type of barn, animal throughput, type and quantity of feed ration used, a physical description of the facilities (size of barn, insulation, fans etc.), the time in the barn, temperature profile for that area, type of manure management system (lagoon, dry lot, pit, etc.).  Sample costs for day to day farm activities are provided in the model, but can be updated by the user. The model output includes a summary of feed and energy usage for the simulation, including energy estimates for temperature control (both heating and ventilation) as well as costs.

Authors: Jill Heemstra, University of Nebraska jheemstra@unl.edu and Rick Fields, University of Arkansas rfields@uaex.edu

Reviewers: Dr. Jennie Sheerin Popp, University of Arkansas, Dr. Karl Vandevender, University of Arkansas

For More Information:

Acknowledgements

This information is part of the program “Integrated Resource Management Tool to Mitigate the Carbon Footprint of Swine Produced In the U.S.,” and is supported by Agriculture and Food Research Initiative Competitive Grant no. 2011-68002-30208 from the USDA National Institute of Food and Agriculture. Project website.

Do Growth Enhancers Affect the Carbon Footprint of Pork Production?

green stylized pig logoIn swine production, maximizing growth rate while minimizing inputs (efficiency) is a top aim of most farmers. This helps an operation become more profitable, but it also has positive environmental benefits in that the amount of water, feed, or energy needed to produce each pound of pork is reduced. This results in fewer greenhouse gases emitted per pound of pork. (For more information on the relationship between efficiency and carbon footprint in animal agriculture see this Animal Frontiers article).

One particular growth enhancer used by pig farms is ractopamine. This is not an antibiotic, but it alters animal metabolism so that pigs produce more lean tissue (muscle) and less fat. For more on this feed additive, see this Texas A&M fact sheet).

A Comparison of Environmental Footprint With and Without Ractopamine

The image below shows a comparison of the same farm system with and without ractopamine. The results are estimated carbon, water, and land footprints as well as economic costs. The numbers were generated by the Pig Production Environmental Footprint Calculator.

The slide shows a smaller carbon footprint; -37,076 lbs of carbon dioxide equivalents per year when using ractopamine. This farm used 953,754 less gallons of water/year with the growth enhancer and required 14 less acres of land to support the farm. The economic implications (using prices from 2015) were a $11,477 advantage with ractopamine.

slide showing a comparison in carbon, water, land, and economic footprint for a farm with and without ractopamine as a growth enhancer

Slide credit: Dr. Rick Ulrich, University of Arkansas.

Are There Other Ways To Improve Growth Besides Ractopamine?

While growth enhances are a proven way to improve efficiency, there are other research-proven recommendations when making management choices to improve growth rate:

  • Phase feeding – diets change due to changing energy, protein, and other nutritional requirements are different as the animal grows
  • Balancing for specific amino acids (and not just crude protein) for each phase
  • Maintaining a clean environment
  • If in a building, keeping temperature in the optimum range

Management choices also impact health status and biosecurity protocols are used to prevent the presence of specific diseases.  In the past, antibiotics could be added to feed or water at low levels to enhance growth rate, but the concern over the proliferation of antibiotic-resistant bacteria resulted in the new policies to only utilize antibiotics to treat (rather than prevent) disease in food animals. The inclusion of antibiotics deemed medically important is being eliminated (federal rules took effect October, 2015 and the policy is in full effect at the end of 2016) for growth-promoting purposes. (For more, see this newsletter from the National Pork Producers explaining the rules to their members).

For More Information

Acknowledgements

Author: Amy Carroll, University of Arkansas

This information is part of the program “Integrated Resource Management Tool to Mitigate the Carbon Footprint of Swine Produced In the U.S.,” and is supported by Agriculture and Food Research Initiative Competitive Grant no. 2011-68002-30208 from the USDA National Institute of Food and Agriculture. Project website.

Carbon Footprint, Life Cycle Assessment and the Pork Industry

green stylized pig logoAnimal agriculture in the U.S. contributes approximately 3.5% of all man-made greenhouse gases (GHGs). If you look at pork production, it accounts for just 0.34% of all emissions. (Source: U.S. EPA Greenhouse Gas Inventory released April, 2015).

When you total up all the GHG emissions from a particular activity or process, it is called a carbon footprint. The procedure used to decide which GHG emissions are included in this total is a life-cycle assessment (LCA).

What Is a Carbon Footprint and How Is It Used?

A carbon footprint gives you a snapshot in time of the GHGs produced by the activity or process being evaluated. The number generated is especially useful for comparing different processes or different times.

Some reasons a farm, company, or industry would calculate a carbon footprint include:

  • Identifying “hot spots” in the system to prioritize areas where reductions can be made
  • Creating a baseline measure for comparing over time
  • Looking at “what-if” scenarios and comparing different options to see how each affects GHG emissions

What Goes Into a Life Cycle Analysis?

In order to be able to compare carbon footprints of different farms or different industries, the life-cycle analysis (LCA) needs to use the same parameters. To do this, many people rely upon standardized procedures such as those created by the International Organization for Standardization.

For the pork industry, the pork supply chain is broadly divided into eight stages:

  • feed production;
  • live animal production;
  • delivery to processor;
  • processing;
  • packaging;
  • distribution;
  • retail;
  • consumption/disposal.

The most important thing to remember is that if you compare two or more carbon footprints to each other, the LCA used needs to be the same. If you try to compare footprints generated using different LCAs, you will not get a true comparison.

For more information

Authors: Jill Heemstra, Nebraska Extension and Rick Fields, University of Arkansas

Acknowledgements

This information is part of the program “Integrated Resource Management Tool to Mitigate the Carbon Footprint of Swine Produced In the U.S.,” and is supported by Agriculture and Food Research Initiative Competitive Grant no. 2011-68002-30208 from the USDA National Institute of Food and Agriculture. Project website.

Do We Know the Carbon Footprint of the Pork Industry?

green stylized pig logoA carbon footprint is a total of all the greenhouse gas emissions (GHG) from a process or industry. A life cycle assessment (LCA) is the process used to figure out what GHG emissions will be included in the footprint. More technically, it is systematic way of looking at a product’s complete life cycle and calculating a “footprint”.  In addition to carbon footprints, there are efforts to calculate land, water, and other environmental footprints.

Below are highlights from several different reports that looked at the carbon footprint of the pork industry on a national and international scale. A comparison between different ways to raise pigs was also highlighted.

Snapshot of the Present Time

On a national scale, a report on the National Life Cycle Carbon Footprint Study for Production of Swine in the U.S. was conducted and published in 2011.

The report concluded that the carbon footprint to prepare and consume a 4 oz serving of pork was ~2.5 lbs of carbon dioxide equivalents. Figure 1 (below) from that report shows the relative breakdown of the industry’s estimated greenhouse gas emissions:

  • Live animal production made up 62.1% of the emissions. That is further broken down and presented in second column (right).
  • Processing – 5.6%
  • Retail – 7.54%
  • Consumption – 23.5% including refrigeration, cooking, and methane from food waste in landfill
  • Packaging (1.3%);

Life cycle assessment of pork production in the U.S.

Comparison Over 50 Years of Production

Another example of an industry-wide analysis, this one comparing over time, is a “50-year comparison of the carbon footprint of the U.S. swine herd 1959 – 2009” (29 pp; PDF). The pork industry overall emits more total greenhouse gases than 50 years ago, but actually emits much less per pound of pork produced because of improvements in efficiency.

From that publication:

The U.S. swine industry produces pigs far more efficiently today (2009) than in 1959. The number of hogs marketed has increased 29% (87.6 million in 1959 to 112.6 million in 2009 after removing market hogs imported directly to harvest) from a breeding herd that is 39% smaller. The efficiency gain is even more impressive when measured against the total dressed carcass weight harvested. Dressed carcass yield leaving the farm has nearly doubled in 50 years from 12.1 billion pounds to 22.8 billion pounds. This increase in productivity has resulted in an increase of 2,231 pounds (2.5x) of carcass harvested annually per sow – year. Today, it takes only five hogs (breeding and market) to produce the same amount of pork that  required eight hogs in 1959.

Comparing Different Ways of Raising Pigs

An example of an LCA that looks at different types of systems is “Life-cycle assessment of commodity and niche swine operations“. (informal Q&A and journal article both available). From the journal article (bottom of page 5):

High-profitability operations have consistently lower impacts compared to low-profitability operations for both commodity and deep-bedded niche piglet production.

Global Assessment from Backyard to Industrial Systems

On an international scale, the report “Greenhouse gas emissions from pig and chicken supply chains” was published in 2013. This study looked at all scales of farms from backyard pigs to industrial production (large confinement operations). Over the entire scale, they estimated that the carbon footprint of pork for every kg (~2.2 lbs) of pig carcass weight has an emissions intensity of 6.1 kg of carbon dioxide equivalent.

This report found that backyard systems, especially in some parts of the world, have low emissions, largely due to by-product or “second-grade” feeds. Industrial pig systems tended to have more emissions intensity than backyard systems, with the emissions from liquid/slurry manure management systems being a big reason. From the conclusion of the report:

When drawing any conclusions about scope for improvement, the following points should be borne in mind: (a)differences in emission intensity may reflect differences in production systems that have arisen over time to enable the system to perform better within a given context, e.g. to make them more profitable, or resilient; (b) focusing on a single measure of efficiency (in this case GHG emissions per kg of output) can lead to positive and negative side effects on, for instance, biodiversity, water quality and animal welfare; (c) reducing GHG emissions is not the only objective producers need to satisfy, as they also need to respond to changing economic and physical conditions.

How Do Carbon Footprints Compare?

It is very important to note that when looking at data and numbers generated from different reports like these, the carbon footprints are difficult to compare unless they use the same LCA. Presenting carbon footprints from different LCA’s is an “apples to oranges” comparison. Only when the same LCA is used, can they be an “apples to apples” comparison.

Additional Information

Acknowledgements

Authors: Amy Carroll, University of Arkansas and Jill Heemstra, University of Nebraska jheemstra@unl.edu

This information is part of the program “Integrated Resource Management Tool to Mitigate the Carbon Footprint of Swine Produced In the U.S.,” and is supported by Agriculture and Food Research Initiative Competitive Grant no. 2011-68002-30208 from the USDA National Institute of Food and Agriculture. Project website.

What Greenhouse Gases Are Emitted by Pig Farms?

green stylized pig logoIn 2014, all man-made sources of greenhouse gas (GHG) emissions in the U.S. were estimated to be 6,870.5 MMT CO2e (millions of metric tons carbon dioxide equivalent). Agriculture was estimated to be responsible 8.3% of those emissions (573.6 MMT CO2e per year). When looking specifically at animal agriculture, all different species together emit an estimated 243.4 MMT CO2e/year, which is 3.5% of all U.S. emissions. The pork industry is estimated to have emitted 26.6 MMT CO2e or 0.34%. (Source: US EPA Greenhouse Gas Inventory 2015)

The two areas where the swine industry produced measurable contributions to agricultural emissions include:

  • Enteric fermentation – the release of gases during normal digestion by animals. Pigs release approximately 2.4 MMT CO2e of the of the 164.3 MMT CO2e produced by all livestock and poultry in the U.S.
  • Manure management – pig farms are estimated to  release 24.2 MMT CO2e of the 78.7 MMT CO2e produced by all animal manure systems in 2014.

Manure management is planned using a total system approach. Animal manure management systems involve six basic functions: production, collection, transfer, storage, treatment and utilization.  The first five out of those six make up the manure management number above. Utilization (usually by land application to crop fields) is instead categorized within “Agricultural soil management”. The greenhouse gases emitted from manure systems include methane and nitrous oxide which form as manure decomposes. 

When all of the GHGs emitted during a particular activity or process are added together, it is the carbon footprint.  The standardized procedure to calculate carbon footprints is a life cycle analysis or LCA.  

Related: Carbon Footprint, Life Cycle Analysis and the Pork Industry

For more information:

Authors: Jill Heemstra, University of Nebraska-Lincoln and Rick Fields, University of Arkansas

Acknowledgements

This information is part of the program “Integrated Resource Management Tool to Mitigate the Carbon Footprint of Swine Produced In the U.S.,” and is supported by Agriculture and Food Research Initiative Competitive Grant no. 2011-68002-30208 from the USDA National Institute of Food and Agriculture. Project website.

Environmental Footprints of Beef Production in the Kansas, Oklahoma and Texas Region

Why Look at the Environmental Footprint of Livestock?

Both producers and consumers of animal products have concern for the environmental sustainability of production systems. Added to these concerns is the need to increase production to meet the demand of a growing population worldwide with an increasing desire for high quality protein. A procedure has been developed (Rotz et al., 2013) that is now being implemented by the U.S. beef industry in a comprehensive national assessment of the sustainability of beef. The first of seven regions to be analyzed consisted of Kansas, Oklahoma and Texas.

What did we do? 

A survey and visits of ranch and feedyard operations throughout the three state region provided data on common production practices. From these data, representative ranch and feedyard operations were defined and simulated for the climate and soil conditions throughout the region using the Integrated Farm System Model (USDA-ARS, 2014). These simulations predicted environmental impacts of each operation including farm-gate carbon, energy, water and reactive nitrogen footprints. Individual ranch and feedyard operations were linked to form 28 representative cattle production systems. A weighted average of the production systems was used to determine the environmental footprints for the region where weighting factors were determined based upon animal numbers obtained from national agricultural statistics and survey data. Along with the traditional beef production systems, Holstein steers and cull animals from the dairy industry in the region were a lso included.

What have we learned?             

The carbon footprint of beef produced was 18.4 ± 1.7 kg CO2e/kg carcass weight (CW) with the range in individual production systems being 13.0 to 25.4 kg CO2e/kg CW. Footprints for fossil energy use, non precipitation water use, and reactive nitrogen loss were 51 ± 4.8 MJ/kg CW, 2450 ± 450 liters/kg CW and 138 ± 12 g N/kg CW, respectively. The major portion of the carbon, energy and reactive nitrogen footprints was associated with the cow-calf phase of production (Figure 1).

Beef footprints

Beef footprints

Future Plans   

Further analyses are planned for the remaining six regions of the U.S. which will be combined to provide a national assessment. Cattle production data will be combined with processing, marketing and consumer data to complete a comprehensive life cycle assessment of beef production and use.

Authors       

C. Alan Rotz, Agricultural Engineer, USDA-ARS al.rotz@ars.usda.gov

Senorpe Asem-Hiablie and Kim Stackhouse-Lawson

Additional information                

Rotz, C. A., B. J. Isenberg, K. R. Stackhouse-Lawson, and J. Pollak. 2013. A simulation-based approach for evaluating and comparing the environmental footprints of beef production systems. J. Anim. Sci. 91:5427-5437.

USDA-ARS. 2014. Integrated Farm System Model. Pasture Systems and Watershed Mgt. Res. Unit, University Park, PA. Available at: http://www.ars.usda.gov/Main/docs.htm?docid=8519. Accessed 5 January, 2015.

Acknowledgements    

This work was partially supported by the Beef Checkoff.

The authors are solely responsible for the content of these proceedings. The technical information does not necessarily reflect the official position of the sponsoring agencies or institutions represented by planning committee members, and inclusion and distribution herein does not constitute an endorsement of views expressed by the same. Printed materials included herein are not refereed publications. Citations should appear as follows. EXAMPLE: Authors. 2015. Title of presentation. Waste to Worth: Spreading Science and Solutions. Seattle, WA. March 31-April 3, 2015. URL of this page. Accessed on: today’s date.


Practical Use and Application of the Poultry Carbon Footprint Calculation Tool


Why Study Carbon Footprint on Poultry Farms?*          

The poultry industry is a major part of the agricultural industry in the United States, and an awareness of the carbon footprint of the industry is important for future growth and development. With carbon footprint estimated to be as high as 18% of total Green House Gas (GHG) emissions, changes in U.S. animal production systems will be a component in mitigating the impacts of the industry on climate change. Changes in GHG emissions from the poultry industry can be achieved only if the industry knows the levels of greenhouse gas emissions contributed as a result of poultry production.

What did we do? 

The Poultry Carbon Footprint Calculation Tool (PCFCT) was developed and designed specifically for poultry production farms. The tool can be used to estimate the greenhouse gas (GHG) emissions from pullet, breeder and broiler grow-out farms. While several life-cycle assessments have been completed for the production of poultry meat, there is no industry specific carbon footprint calculation tool available for the production phase of the poultry industry and since the poultry farmer only has control over the activities that take place on his farm, he can only make reductions of emissions at the farm-gate level. It is therefore important that a tool such as the PCFCT is available to deal with the farm level emissions.

The GHGs that are assessed are carbon dioxide, nitrous oxide and methane which are the gases of major concern in agriculture. The specific objectives of this study was to develop a computer-based, user-friendly calculation tool to assess greenhouse gas emissions from poultry farms and also to identify abatement strategies in on-farm management practices to reduce the footprint on farms. The user friendly PCFCT is an Excel spreadsheet into which the user will enter farm data to calculate the annual carbon footprint (Figure 1). The research included an assessment of the carbon footprint of test farms under industry management standards with focus placed on management practices and farm-expense data, particularly with regard to expenditures for energy-intensive inputs such as electricity and fuel which are the largest contributors to GHG emissions for poultry farms. This was used to identify potential areas of change.

The calculation tool was developed and then used to estimate the emissions from 30 test farms from three poultry companies in three different regions in Georgia.

What have we learned? 

We observed that the major sources of greenhouse gas that are emitted on poultry production farms were from gas use and manure management. Based on these observations, the tool was then equipped to recommend improvements to the farm, which would in turn show the user potential reductions in GHG emissions and cost savings if the recommended improvements were implemented. The results from the study showed that there were significant differences in emissions from mechanical sources and electricity use between the southern region and the northern and central regions of the state (Table 1). The differences observed could be a result of; climatic differences, the dead bird disposal methods and also the duration of time the flock is kept on the farm.

Table 1. Average Farm Emissions from three Broiler Complexes located in three different regions.

The tool is also very useful for record keeping as it is designed with a printable inventory which will allow users to track and compare their emissions from year to year. It is also equipped with bar charts to show the user their current emissions compared to projected emissions if they apply the recommended changes. A second graph shows the percentage of emission from each source.

Future Plans    

The tool will be made available on the departmental website (uga.poultry.edu) for poultry producers, poultry company environmental personnel and extension personnel to utilize. Articles relevant to the subject will also be made available to users of the tool. Other future plans include incorporation of other segments of the industry (layer and turkey) into the tool.

Authors       

Claudia Dunkley, Ext. Poultry Scientist cdunkley@uga.edu

Brian Fairchild, Ext. Poultry Scientist, Casey Ritz, Ext. Poultry Scientist, Brian Kiepper, Ext. Poultry Scientist, John Worley, Ext. Engineer

Additional information                

www.poultry.uga.edu

C. S. Dunkley, University of Georgia, 2360 Rainwater Rd., Tifton, GA 31793-0478

Acknowledgements      

Funded by US Poultry & Egg Association

Figure 1. The PCFCT Interface page showing areas where farm data will be inputted, recommendations can be tried and an inventory showing the emissions and projections based on recommendations can be seen.

The authors are solely responsible for the content of these proceedings. The technical information does not necessarily reflect the official position of the sponsoring agencies or institutions represented by planning committee members, and inclusion and distribution herein does not constitute an endorsement of views expressed by the same. Printed materials included herein are not refereed publications. Citations should appear as follows. EXAMPLE: Authors. 2015. Title of presentation. Waste to Worth: Spreading Science and Solutions. Seattle, WA. March 31-April 3, 2015. URL of this page. Accessed on: today’s date.

Reducing or Mitigating Greenhouse Gas Emissions In Animal Agriculture

Animal agriculture has dramatically increased its production efficiency over time, as it continues to produce more products with fewer resources. Although its overall carbon footprint is relatively small compared to other sectors of the economy such as energy and transportation, it is often called upon to defend its impact on the environment. Recent commitments made by livestock and poultry industry groups to reduce greenhouse gas emissions shows that animal agriculture is willing to do its part as good stewards of shared natural resources and to protect the environment.

Factsheet: Mitigation of Greenhouse Gas Emissions in Animal Agriculture (look below the fact sheet and title for a “download” link)

Measures to mitigate or reduce greenhouse gas emissions must be weighed on a farm by farm basis, as types of animal production among species and geographic locations are extremely diverse. There is no magic bullet or one size fits all solution to reduce greenhouse gas emissions among animal agriculture.

There are four main approaches to mitigation greenhouse gas emissions in livestock and poultry systems.

(1) Production efficiency – producing more output of meat, milk and eggs per unit input (water, feed, fertilizer, etc.)

(2) Manure management – applying manure collection, storage, and disposal practices that not only reduce greenhouse gas emissions, but at the same time address water and air quality concerns.

(3) Energy efficiency – as we continue the trend toward more controlled environments within animal production, there is a growing need to be more energy efficient in our lighting, heating and cooling systems.

(4) Carbon capture (also called carbon sequestration) – capturing and storing carbon in the soil by maintaining cover crops, or by planting trees or other perennial vegetation increases organic matter content and also retains carbon that would have otherwise been released as carbon dioxide into the atmosphere.

All Species

  • Increase conception and pregnancy rate
  • Improve animal health
  • Reduce animal stress
  • Lower mortality (death) rates
  • Use feed analysis/precision feeding – match dietary requirements and nutritional needs
  • Practice genetic selection for increased production efficiency and/or reduced maintenance energy requirements

Beef Cattle

  • Increase weight gain through concentrates, improved pastures and dietary supplements
  • Increase digestibility of feed/forage
  • Encourage earlier weaning
  • Use proper stocking rates & rotational grazing
  • Move to low input production
  • Breed for better heat tolerance and pest resistance

Dairy Cattle

  • Increase milk production per head
  • Encourage earlier weaning
  • Improve energy efficiency of exhaust fans, lighting, generators, and incinerators
  • Improve cow comfort through improved cooling systems and bedding material

Swine

Also see a related project on pork production and environmental footprint.

  • Reduce crude protein content in diet and supplement with amino acids
  • Switch from dry feed to wet/dry feeders
  • Improve bedding materials
  • Improve energy efficiency of exhaust fans, lighting, and generators

Poultry

  • Use insulated curtains in houses without walls
  • Insulate walls in houses with walls
  • Install circulatory fans to prevent temperature stratification inside barns
  • Improve energy efficiency of exhaust fans, lighting, generators, and incinerators

Manure Management Strategies

  •  Anaerobic digestion captures methane (a greenhouse gas) and destroys it or utilizes it for energy generation.
  • Composting manure – can reduce greenhouse gases by avoiding methane production that would be seen if the feedstock was landfilled or stored in an open air anaerobic system (such as a lagoon)  [1]
  • Covered manure storage – can capture methane and either destroy it (flare) or utilize it for energy generation
  • Frequent removal of manure from confined facilities
  • Separating manure liquids from solid

Educator Materials

If you would like to use the video, slides, or factsheet for educational programs, please visit the curriculum page for download links for this and other climate change topics.

Recommended Reading on Reducing Emissions from Animal Production

All Livestock Species

Greenhouse Gas Mitigation Opportunities for Livestock Management in the United States (Duke University Nicholas Institute, 2012)
Mitigation of Greenhouse Gas Emissions in Livestock Production (FAO, 2013)
Livestock’s Long Shadow, FAO report

Beef Cattle

Dietary Mitigation of Enteric Methane from Cattle (Beauchemin, K. A. et al., 2009)

Dairy Cattle

DMI Sustainability Website
Sustainability in Practice-A Collection of Success Stories from the Dairy Industry
Greenhouse Gas Emissions from the Dairy Sector, FAO report

Swine

Swine Carbon Footprint Facts
Evaluating the Environmental Footprint of Pork Production

Poultry

Carbon Footprint of Poultry Production Farms (C. Dunkley Webcast)
Global Warming: How Does it Relate to Poultry (C. Dunkley 2011, Factsheet)

Acknowledgements

Author: David Schmidt, University of Minnesota schmi071@umn.edu

This page was developed as part of a project “Animal Agriculture and Climate Change” an extension facilitation project to increase capacity for ag professionals. It was funded by USDA-NIFA under award # 2011-67003-30206.

References

[1] http://faculty.washington.edu/slb/docs/slb_JEQ_08.pdf

Sources of Agricultural Greenhouse Gases

The conversation about climate change largely revolves around greenhouse gases. Agriculture is both a source and sink for greenhouse gases (GHG). A source is a net contribution to the atmosphere, while a sink is a net withdrawal of greenhouse gases.  In the United States, agriculture is a relatively small contributor, with approximately 8% of the total greenhouse gas emissions, as seen in Figure 1.

Most agricultural emissions originate from soil management, enteric fermentation (microbial action in the digestive system), energy use, and manure management (Figure 2).  The primary greenhouse gases related to agriculture are (in descending order of magnitude) methane, nitrous oxide, and carbon dioxide.

Fact sheet: Contribution of Greenhouse Gases: Animal Agriculture in Perspective (look below the preview box and title for a download link)

U.S. GHG Inventory Figure 1: U.S. greenhouse gas inventory with electricity distributed to economic sectors (EPA, 2013) 

Ag Sources of GHGs

Figure 2: U.S. agricultural greenhouse gas sources (Adapted from Archibeque, S. et al., 2012)

Animal Agriculture’s Contribution to Greenhouse Gas Emissions

Within animal production, the largest emissions are from beef followed by dairy, and largely dominated by the methane produced in during cattle digestion (Figure 3).

Greenhouse gas emissions from livestock in 2008

Figure 3: Greenhouse gas emissions from livestock in 2008 (USDA, 2011)

Excess nitrogen in agriculture systems can be converted to nitrous oxide through the nitrification-denitrification process. Nitrous oxide is a very potent greenhouse gas, with 310 times greater global warming potential than carbon dioxide.  Nitrous oxide can be produced in soils following fertilizer application. This includes both commercial, inorganic fertilizer as well as organic fertilizers like manure or compost.

As crops grow, photosynthesis removes carbon dioxide from the atmosphere and stores it in the plants and soil life. Soil and plant respiration adds carbon dioxide back to the atmosphere when microbes or plants breakdown molecules to produce energy.  Respiration is an essential part of growth and maintenance for most life on earth. This repeats with each growth, harvest, and decay cycle, therefore, feedstuffs and foods are generally considered to be carbon “neutral.”

Some carbon dioxide is stored in soils for long periods of time.  The processes that result in carbon accumulation are called carbon sinks or carbon sequestration.  Crop production and grazing management practices influence the soil’s ability to be a net source or sink for greenhouse gases.  Managing soils in ways that increase organic matter levels can increase the accumulation (sink) of soil carbon for many years.

Enteric Fermentation

The next largest portion of livestock greenhouse gas emissions is from methane produced during enteric fermentation in ruminants – a natural part of ruminant digestion where microbes in the first chamber of the stomach, the rumen, breaks down feed and produces methane as a by-product. The methane is released  primarily through belching.

As with plants, animals respire carbon dioxide, but also store some in their bodies, so they too are considered a neutral source of atmospheric carbon dioxide.

Manure Management

A similar microbial process to enteric fermentation leads to methane production from stored manure.  Anytime the manure sits for more than a couple days in an anaerobic (without oxygen) environment, methane will likely be produced.  Methane can be generated in the animal housing, manure storage, and during manure application. Additionally, small amounts of methane is produced from manure deposited on grazing lands.

Nitrous oxide is also produced from manure storage surfaces, during land application, and from manure in bedded packs & lots. Related: Archived webinar on GHG Emissions Research in Animal Ag

Other sources

There are many smaller sources of greenhouse gases on farms. Combustion engines exhaust carbon dioxide from fossil fuel (previously stored carbon) powered vehicles and equipment.  Manufacturing of farm inputs, including fuel, electricity, machinery, fertilizer, pesticides, seeds, plastics, and building materials, also results in emissions.

To learn more about how farm emissions are determined and see species specific examples, see the Carbon Footprint resources.

To learn about how to reduce on-farm emissions through mitigation technology and management options, see the Reducing Emissions resources.

Carbon Footprint

Definition: carbon footprint is the total greenhouse gas emissions for a given person, place, event or product.

Carbon footprints are created using a process called life cycle assessment. Life cycle assessment or LCA is a method of resource accounting where quantitative measures of inputs, outputs and impacts of a product are determined.

Life cycle assessment is commonly used to:

  • find process or production improvements
  • compare different systems or products
  • find the ‘hot spots’ in a product’s life cycle where the most environmental impacts are made
  • help businesses or consumers make informed sourcing decisions

diagram

Key Assumptions

boundaries of the system: each higher tier provides a more complete picture of the product’s impacts, however requires more time and resources to complete.

  1. Gate to Gate (LCA Tier I) – inventories the direct emissions for a single product of process
  2. Cradle to Gate (Tier II) – inputs are taken back to the initial extraction as natural resources up to a certain point in the product’s life such as its sale from the farm, i.e. farm gate.  This will include both direct  and indirect emissions from the product.
  3. Cradle To Grave (Tier III) – the product is followed through the consumer to its eventual recycling or disposal.

Sources of variation

Different researchers may get different results when performing a LCA on the same product. This can happen for many reasons:

  • System boundary definition
  • Inclusion/exclusion of secondary/ indirect sources
  • Inclusion/exclusion of biogenic carbon (stored in organisms)
  • Inclusion/exclusion of carbon dioxide from fuel combustion
  • Functional relationships used
  • Global warming potential indexes
  • Inclusion/exclusion of carbon sequestration

Related: Six archived webinars on the sources of animal ag ghg’s (some are general and some are species-specific)

Educator Materials

If you would like to use the video, slides, or factsheet for educational programs, please visit the curriculum page for download links for this and other climate change topics.

Recommended Reading – How Many Greenhouse Gases Does Agriculture Emit?

U.S. Agriculture Emissions

International Agriculture Emissions

Carbon Footprints and Life Cycle Analysis

Greenhouse Gas Regulations for Animal Agriculture

Visit Climate Change Regulation, Policy, and Market Opportunities

Acknowledgements

Author: Crystal A. Powers – University of Nebraska-Lincoln cpowers2@unl.edu

This material was developed through support from the USDA National Institute for Food and Agriculture (NIFA) under award #2011-67003-30206.