Organic farming systems rely on internal, biologically mediated processes that can provide plants essential nutrients and suppress pests and disease. While reliance on soil biology to produce healthy plants is at the heart of the soil health concept, little research has been conducted in certified organic systems. Organic growers in Idaho and elsewhere need greater access to information on building soil health to enhance long-term productivity and sustainability on their farms. The overall goal of this project was to provide tools and targets to guide soil management during the transition to organic operation, thereby increasing soil health and internal function of certified organic systems.
Specifically, we assessed how key soil health indicators and soil organisms changed under combinations of three different tillage and nutrient management strategies during the transition to organic farming.
What Did We Do?
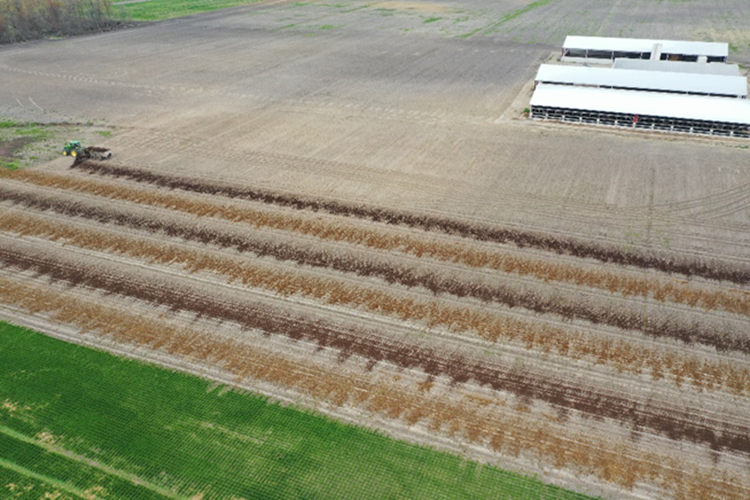
Replicated plots were established at two sites each in two growing regions of Idaho (North and South), to determine the impact of different levels of tillage and organic matter additions on soil health indicators and crop growth during the organic transition phase. Both sites in Northern Idaho, GDF and SSF, were located near Moscow while both sites in Southern Idaho, KF and TF, were in Twin Falls County. All sites can be broadly characterized as having silt loam soils. However, Northern Idaho is rainfed with 27 inches of rainfall per year while Southern Idaho receives an average of 8 inches of precipitation. The sites in Southern Idaho were irrigated while those in Norther Idaho were not.
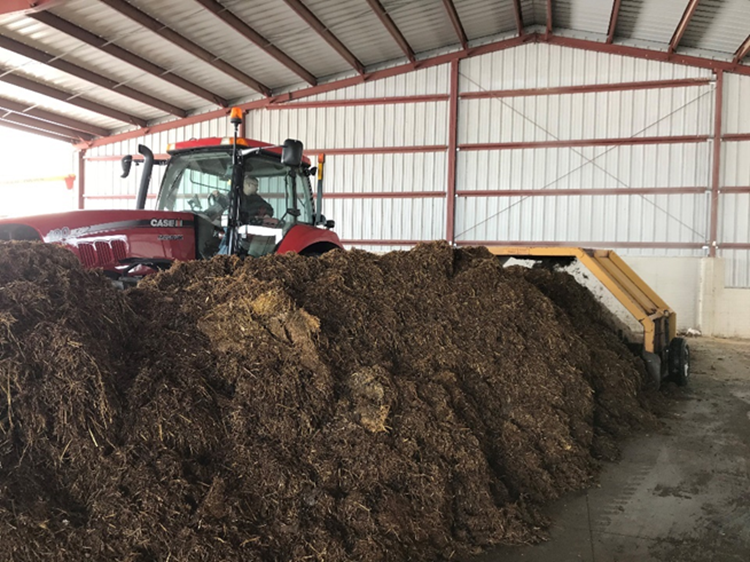
For all sites, alfalfa was established in year one and maintained for three years before it was terminated then feed barley was planted. For the two sites in Northern Idaho, alfalfa did not establish and was replanted in year 2. Each site had three levels of disturbance (tillage): high, medium, and low and three levels of organic additions: high, medium, and low for a total of nine plots per site (Figure 1). Treatment combinations were not replicated within site but instead replicated across sites (4 sites total). High tillage intensity included several passes of a rototiller and/or chisel plow with harrow. Medium intensity included one pass of a rototiller and/or chisel plow; while the low intensity only had harrow. Organic amendments were added every year; the medium rate of organic addition was designed to provide crop uptake of phosphorus for alfalfa and nitrogen for barley while the high rate was doubled. The low rate was bone meal (phosphorus) or blood meal (nitrogen) to meet crop uptake of the alfalfa and barley, respectively.
Yield was measured via hand sampling at all sites in September 2024. A wide range of soil physical, chemical, and biological soil health indicators were assessed in June 2024. Due to space limitations, only active carbon, also known as POxC, will be reported here. POxC is generally considered an indicator that is sensitive to management changes, especially those that increase soil carbon. It provides a quicker response than soil organic matter because POxC only indicates a small fraction of the soil carbon pool.
Figure 1. Example site layout. F= low organic amendment, 1C = medium organic amendment, and 2C = high organic amendment.
What Have We Learned?
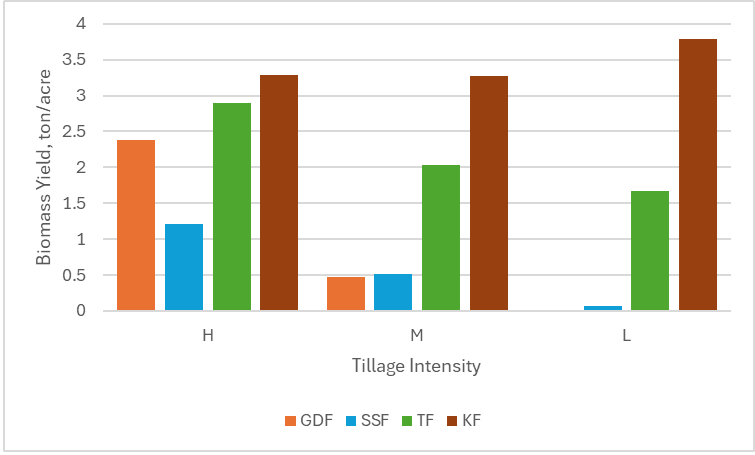
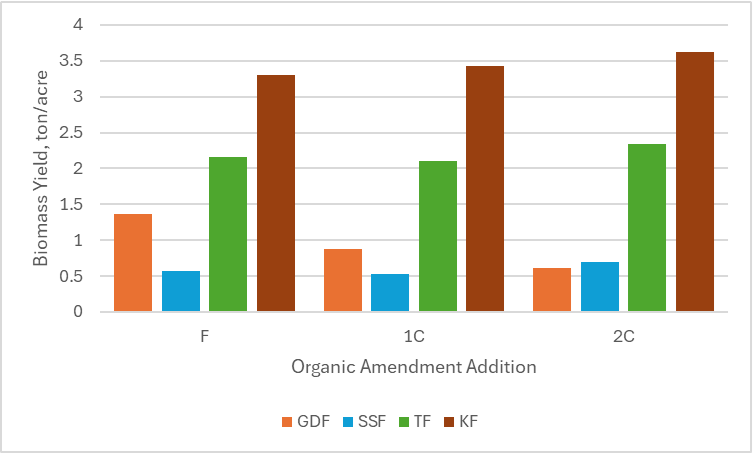
In Northern Idaho, upon harvest, total above ground biomass of spring barley was nearly double at GDF (1.72 tons/acre) compared to SSF (0.91 tons/acre) (Figure 2). Across both Northern Idaho sites, higher barley yield was associated with higher tillage with one of the sites having no harvestable barley in the low tillage treatment due to high weed and volunteer alfalfa pressure. Barley yields in Southern Idaho were higher than in Northern Idaho; KF had average yields of 3.45 tons/acre with TF averaging 2.20 tons/acre. Yields in Southern Idaho were the highest in the high tillage plots and lowest in the medium tillage. Organic amendment addition made little difference compared to tillage intensity for yields (Figure 3).
Figure 2. Spring barley yield (tons/acre) for sites in Northern (GDF and SSF) and Southern (TF and KF) Idaho by tillage intensity where H=high tillage intensity, M= medium tillage intensity, and L = low tillage intensity.Figure 3. Spring barley yield (tons/acre) for sites in Northern (GDF and SSF) and Southern (TF and KF) Idaho by organic amendment addition levels where F= low organic amendment (bone meal), 1C= medium organic amendment addition where dairy compost applied to meet barley nutrient uptake, and 2C= high organic matter amendment addition at double the rate of 1C.
In terms of soil health indicators, POxC averaged higher at GDF plots (833.19 mg/kg soil) when compared to SSF plots (452.95 mg/kg soil). POxC was substantially lower in Southern Idaho than in Northern Idaho; plots at KF averaged 331.46 mg/kg soil while the TF site averaged 404.35 mg/kg soil. POxC decreased with depth across all sites. In Northern Idaho, there were no consistent trends for tillage or fertilizer across both sites. Treatment effects of tillage and fertilizer application depended on location. For example, GDF plots had an inverse relationship of POxC levels and increasing tillage. At SS, higher levels of POxC were associated with higher levels of tillage. Unlike Northern Idaho, POxC increased with decreasing tillage intensity at both sites in Southern Idaho. Across both Southern Idaho sites, POxC averaged 390.17 mg/kg soil in the lowest tillage intensity, 372.68 mg/kg soil for medium tillage intensity, and 340.87 mg/kg soil in the highest tillage intensity. There was no consistent effect of organic matter addition, however.
Future Plans
We are still analyzing data from this four-year study for other soil health indicators, such as the , earthworm species, and soil infiltration rates. This robust data set (over a dozen indicators total) will help guide which indicators of soil health are most suitable for organically managed systems.
Authors
Presenting & corresponding author
Linda Schott, Assistant Professor and Extension Specialist, University of Idaho, Lschott@uidaho.edu
Additional authors
Kendall Kahl, Assistant Professor and Extension Specialist, University of Idaho
Jodi Johnson-Maynard, Department Head and Professor, University of Georgia
Glen Stevens, Research Technician, University of Idaho
The authors are solely responsible for the content of these proceedings. The technical information does not necessarily reflect the official position of the sponsoring agencies or institutions represented by planning committee members, and inclusion and distribution herein does not constitute an endorsement of views expressed by the same. Printed materials included herein are not refereed publications. Citations should appear as follows. EXAMPLE: Authors. 2025. Title of presentation. Waste to Worth. Boise, ID. April 7-11, 2025. URL of this page. Accessed on: today’s date.
Livestock producers and meat processors are facing ever evolving challenges when it comes to waste management. Increasing levels of regulation continue to challenge producers, including Washington State’s recently established Organics Management law which sets Methane reduction goals for landfills. This has led many landfills in the state to begin turning away organic material like offal and animal carcasses. Meanwhile climate change is increasing the frequency and intensity of catastrophic animal mortality events, driving the urgent need for solutions to build resources and infrastructure to manage large animal losses.
The Awful Offal group serves as the primary inter-agency effort for addressing policy barriers and problem-solving acute and ongoing animal waste disposal scenarios. The group and its members also participate in state-wide catastrophic mortality preparedness planning. This presentation aims to engage participants with real-world examples of successes and challenges this group has faced through its inception.
What Did We Do?
The Awful Offal work group meets regularly to update members on specific cases or trends in their respective programs. Over years of collaboration, we have been able to identify gaps, provide training and create resources to address some of the largest challenges the state faces with animal carcass management. This has taken shape in the form of offal focused composting workshops, market studies, and countless hours providing resources and technical assistance to operators in need.
What Have We Learned?
We have learned much since this group’s inception, one thing that routinely comes up is that Washington’s diverse climate is going to require an equally diverse set of solutions for tackling this challenge. Composting is a viable and environmentally responsible option for many but also comes with its own unique needs and challenges. Many small meat processors have described the switch from sending material to landfill to composting onsite as “running a second business.” If you also consider many commercial composting operations do not accept this material, we must recognize that no single solution will solve this issue state-wide.
Future Plans
Through robust technical assistance and economic incentives, Washington State Department of Agriculture (WSDA) plans to lead a State-wide effort to promote adoption of on and off-farm composting as a waste management strategy. WSDA also intends to conduct an in-depth economic and market analysis to identify the specific regional needs and barriers so to further determine how the State can best support additional infrastructure, fund pilot projects and develop resources.
Authors
Presenting author
AJ Mulder, Nutrient Management Specialist, Washington State Department of Agriculture, aj.mulder@agr.wa.gov
Acknowledgements
I would like to acknowledge all the members of the Awful Offal work group, including my colleagues at Washington State Department of Agriculture, Department of Ecology, Washington State University, Department of Health, Department of Fish and Wildlife, USDA and all our industry partners whose input and cooperation this work would be impossible without.
The authors are solely responsible for the content of these proceedings. The technical information does not necessarily reflect the official position of the sponsoring agencies or institutions represented by planning committee members, and inclusion and distribution herein does not constitute an endorsement of views expressed by the same. Printed materials included herein are not refereed publications. Citations should appear as follows. EXAMPLE: Authors. 2025. Title of presentation. Waste to Worth. Boise, ID. April 7–11, 2025. URL of this page. Accessed on: today’s date.
Due to a technical glitch, the beginning of the recorded presentation was not recorded. Please accept our apologies.
Purpose
A common media used for woody ornamental production is a mixture of 8 parts pine bark and 1 part sand on a volume basis combined with various amounts of peat moss, sphagnum moss, or vermiculite to improve the aeration porosity (AP) and water holding capacity (WHC). Lime is also added to raise the pH to the level needed for the plant to be grown, and slow-release pellet fertilizer (14-14-14) is mixed in the range of 3 to 8 lb per cubic yard of media to provide a base level of fertility.
While materials such as peat moss and vermiculite hare valuable ingredients to improve the physical characteristics of potting media, there are some significant concerns. Peat moss is obtained from wetlands (peat bogs) and is a non-renewable resource that has increased in price. Vermiculite is a product of heat-treating ore mined from the earth to make the product used in horticulture. The rising energy costs associated with mining and heat processing have caused the costs of vermiculite to increase.
The purpose of this study was to determine if blending 20%, 40%, and 60% (volume basis) of composted poultry litter (CPL) with a bark-sand base mix could replace or reduce the need to mix in non-renewable ingredients to improve the physical properties (AP, WHC, bulk density, pH), and reduce the amount of pellet fertilizer (14-14-14) needed to provide typical levels of fertility for potting media used in ornamental plant production. The anticipated benefits would be reduced production costs for the horticulturalist and development of a consistent market for producers of compost products made from poultry litter mixed with locally sourced plant waste.
What Did We Do?
The first step in the study was to obtain large amounts of composted poultry litter (broiler or breeder litter mixed with wood and other plant waste) and screened pine bark from two separate manufacturers in South Carolina. The other material that was included in the media blends was builder’s sand. Three well-mixed pine bark and compost samples were sent to the Clemson University Agricultural Services Laboratory to determine the concentrations of major and minor plant nutrients, organic matter, carbon, pH, electrical conductivity (EC5), moisture content, and the dry matter bulk density. The only measurements obtained for the sand were the moisture content (3.7%) and density (1.143 g DM/cm3). The pH was assumed to be 7.0 based on published information. The average chemical and physical characteristics of the pine bark and compost are provided in Table 1. The complete details are given by Chastain et al. (2023).
The next step was to make the four different potting mixes using the three ingredients. The base mix was made by blending 8 parts pine bark with 1 part sand. The other three mixes were blends of the base mix and the compost product (CPL) on a volume basis. The 20% CPL mix was 1 part CPL blended with 4 parts of the base mix. The 40% CPL mix was 2 parts CPL blended with 4 parts of the base mix, and the 60% CPL mix was 3 parts CPL blended with 2 parts of the base mix.
The third step was to measure the dry matter bulk density, aeration porosity (AP), water holding capacity (WHC), and pot water capacity. The density of the four mixes was determined as the dry mass of material in a container with a calibrated volume. The AP and WHC were measured in the laboratory using a test chamber and procedure designed for this purpose (Chastain et al., 2023). The pot water capacity (g water/pot) was measured by filling 6, 6-inch pots with the same volume of each of the 4 mixes (24 pots total). The pots were brought to saturation and the water contained in the pots was measured. The pots were allowed to dry in the laboratory for 4 days and the mass of water in each pot was measured again. The complete details are provided by Chastain et al. (2023).
Table 1. Chemical and physical characteristics of the bark and composted poultry litter used to make the four potting mixes (mean of 3 reps). The moisture content of the sand used was 3.7%, the pH was 7.0, and the bulk density was 1.143 g DM/cm3.
Screened Pine Bark
(% d.b.)
Composted Poultry Litter
(% d.b.)
TAN (NH4-N + NH3-N)
0.00
0.00
Organic-N
0.33
0.96
Nitrate-N
0.00
0.12
Total-N
0.33
1.08
P2O5
0.12
2.45
K2O
0.22
0.82
Calcium
0.33
4.35
Magnesium
0.11
0.36
Sulfur
0.05
0.20
Zinc
0.004
0.02
Copper
0.001
0.02
Manganese
0.014
0.02
Sodium
0.023
0.15
Organic Matter
92.6
13.7
Carbon
52.4
9.94
C:N
161:1
9.2:1
EC5 (mmhos/cm)
2.56
0.71
pH
5.10
7.33
Moisture (%)
59.4
25.6
Density (g DM/cm3)
0.164
0.607
The final step involved calculating the concentrations of plant nutrients and other characteristics from the data shown in Table 1 as a weighted mean based on mass. These nutrient concentrations were converted to a volume basis (lb/yd3) using the mix bulk densities. The volumetric nutrient concentrations of the three CPL and base mix blends were compared with the range of nutrient concentrations that would result from mixing a 14-14-14 pellet fertilizer with the base mix at the rate of 3 to 8 lb per cubic yard.
What Have We Learned?
The results of mixing 20%, 40% and 60% CPL with the base mix on important properties of potting media are given in Table 2 along with target values from the literature. As the amount of composted litter (CPL) was increased the aeration porosity decreased from an unacceptable value of 30% for the base mix to 18% for the 20% CPL mix and 12% for the 60% CPL mix. The target range for water holding capacity is 45% to 65%. The highest WHC of 50% was for the 40% CPL mix followed by a WHC of 48% for the 20% CPL mix. The most limiting media characteristic appeared to be pH. The desirable range for media pH ranges from 5.5 to 6.4 depending on the plant to be grown. Based on the upper limit of this range, the highest amount of this compost product that would be recommended based on this study was 40%. Therefore, these results indicate that the amount of CPL that should be considered for most potting media would be in the range of 20% to 40% of the mix. The actual percentage of CPL that should be used will depend on the pH requirements of the plants to be grown. The pot water capacity results also showed that increasing the percentage of CPL in the mix increased the amount of water that would be held in a container at saturation and after 4 days of evaporation. If a media pH of 6.1 is suitable for the plant to be grown then these results suggest that the 40% CPL mix would be the best since it would provide an AP of 15%, a WHC of 50%, and an increase in pot water capacity of 20% at saturation and 29% following 4 days of evaporation with no irrigation. Using 40% CPL in a potting mix would also provide a 35% increase in dry bulk density which should reduce pot tipping in a production or retail nursery.
Table 2. Impact of adding composted poultry litter (CPL) to a bark-sand base mix on key potting media characteristics. The amount of CPL in the mix was 0%, (100% Base Mix), 20% (20% CPL), 40% (40% CPL), and 60% (60% CPL). AP is the aeration porosity, and WHC is the water holding capacity.
Media Property
100% Base Mix
20% CPL
40% CPL
60% CPL
AP (%) – Target: 10% to 20%
30
18
15
12
WHC (%) – Target: 45% to 65%
46
48
50
46
pH – Target: 5.5 to 6.4
5.3
5.7
6.1
6.5
Density (g DM/cm3)
0.31
0.37
0.42
0.47
Pot Water Capacity – at saturation (g/pot) A
390
420 (+8%)
468 (+20%)
523 (+34%)
Pot Water Capacity – after 4 days (g/pot) B
316
355 (+12%)
407 (+29%)
413 (+31%)
A The average mass of water contained in a 6-inch pot after adding enough water to bring the contents to saturation.
B The average mass of water contained in a 6-inch pot after allowing water to evaporate from the pots for 4 days.
The volumetric nutrient contents of the base mix, the fertilized base mix, and the 20% and 40% CPL mixes are compared in Table 3. The results for the 60% CPL mix were not included since the pH of 6.5 (Table 2) exceeded the upper value of the target range (pH = 6.4). Addition of the pellet fertilizer to the base mix and the 20% and 40% CPL mixes were able to reduce the C:N of the mix and change the plant available-N estimate from – 0.36 lb /yd3 to a positive value. That is, one of the goals of fertilizing a potting mix is to overcome the impact of nitrogen immobilization from the large amount of carbon in the pine bark. The actual target for plant available-N will vary with the plant to be grown. A similar result can be seen for the plant available P2O5. The base mix was not estimated to contain any useful P2O5. The addition of pellet fertilizer or using a CPL blend provided similar amounts of P-fertility. The two CPL mixes provided more K2O than the typical range of pellet fertilized mixes included in this study. The use of CPL instead of pellet fertilizer also added calcium, magnesium, sulfur, and other minor plant nutrients. The only elevated element that was undesirable was sodium. These results point out that potential minor nutrient toxicities (e.g. Mn, Zn) should also be considered when selecting the precise percentage of compost product to use in a potting mix.
Table 3. Comparison of the plant nutrients contained in the bark-sand base mix, fertilized base mix (3 to 8 lb slow-release fertilizer / cubic yard), and the 20% and 40% CPL mixes. The units are pounds of nutrient per cubic yard (lb/yd3)
Plant Nutrients
Base Mix
Fertilized
Base Mix
20% CPL
40% CPL
TAN (NH4-N + NH3-N)
0
0.28 to 0.69
0
0
Organic-N
0.81
0.80 to 0.81
2.61
4.41
Nitrate-N
0
0.20 to 0.49
0.24
0.48
Total-N
0.81
1.28 to 1.98
2.85
4.89
C:N
159:1
65:1 to 101:1
43:1
24:1
Plant Available-N A
– 0.36
0.29 to 1.09
0.19
0.70
P2O5
0.29
0.77 to 1.47
5.25
10.20
Plant Available P2O5B
0
0.47 to 1.17
0.42
1.63
Potash (K2O)
0.54
1.01 to 1.71
2.11
3.68
Calcium
0.82
0.82
9.56
18.3
Magnesium
0.27
0.27
0.95
1.62
Sulfur
0.11
0.11
0.50
0.89
Zinc
0.008
0.008
0.054
0.099
Copper
0.003
0.003
0.039
0.074
Manganese
0.034
0.034
0.072
0.111
Sodium
0.057
0.057
0.359
0.661
A Plant Available-N = m f CS [Org-N] + TAN + NO3-N, where m f CS = 0.139 – 0.0036 C:N, R2 = 0.84 (regression by Franklin et al., 2015, method given by Chastain et al., 2023).
P Plant Available P2O5 = PRf [P2O5] Potting MIX + [P2O5] Fertilizer, PRf = 0 for the base mix and blends with fertilizer and 0.40 for CPL. (data from Franklin et al., 2015, method given by Chastain et al., 2023).
The results of this study indicated that composted poultry litter can replace a significant portion or all the expensive, non-renewable ingredients that are currently used to improve the AP, and WHC of a potting mix. The additional water capacity per pot may also reduce irrigation frequency, but additional work is needed. Also, use of CPL in the range of 20% to 40% of the mix can eliminate or reduce the need for lime for pH adjustment and pellet fertilizer to provide common levels of potting mix fertilization. These results only apply directly to the compost product used in this study. A similar study using composted cow manure (Owino et al., 2024) showed similar positive results. However, that product could not be used to adjust AP and WHC and media fertility in the same way as the product used in this study. These studies (Chastain et al., 2023; Owino et al., 2024) are intended to be used as a guide to determine the best compost and base mix proportions based on analysis of the initial ingredients. The final choice concerning the amount of compost to use should be made after growing trial pots of the plant to be produced in a the most beneficial mix.
Future Plans
This information has been used to develop extension programs for poultry and livestock producers that manufacture compost or who are considering composting litter as a treatment option. The other target audience for this information is producers of container ornamentals. Additionally, plant specific trials would be helpful to communicate information concerning the use of compost products in container production. An easy-to-use program or spreadsheet that would allow comparison of potting mix characteristics based on laboratory analysis would allow producers to design one or two mixes that may meet the specific needs of their plants. This would greatly reduce the amount of time needed to test the most beneficial blends.
Authors
Presenting & corresponding author
John P. Chastain, Professor and Extension Agricultural Engineer, Clemson University, jchstn@clemson.edu
Additional authors
Hunter F. Massey, Principle Lecturer, Department of Agricultural Sciences; Tom O. Owino, Associate Professor, Department of Environmental Engineering and Earth Sciences, Clemson University
Additional Information
Chastain, J.P., Massey, H.F., Owino, T.O. 2023. Benefits of Adding Composted Poultry Litter to Soilless Potting Media for the Production of Woody Ornamentals. In: Barbosa, J.C., Silva, L.L., Rico, J.C., Coelho, D., Sousa, A., Silva, J.R.M., Baptista, F., Cruz, V.F., (Eds.) Proceedings of the XL CIOSTA and CIGR Section V International Conference: Sustainable Socio-Technical Transition of Farming Systems. Évora, Universidade de Évora, pp. 10-21, https://rdpc.uevora.pt/rdpc/handle/10174/35910.
Franklin, D., D. Bender-Ӧzenҫ, N. Ӧzenҫ, and M. Cabrera. 2015. Nitrogen mineralization and phosphorus release from composts and soil conditioners found in the southeastern United States. Soil Science Society of America Journal 79:1386-1395. doi:10.2136/sssaj2015.02.0077.
Owino. T.O., Chastain, J.P., Massey, H.F. 2024. Using Composted Cow Manure to Improve Nutrient Content, Aeration Porosity, and Water Retention of Pine Bark-Based Potting Media. In: Cavallo, E., Cheein, F.A., Marinello, F., Saҫilil, K., Muthukumarappan, K., Abhilash, P.C., (Eds.) 15th International Congress on Agricultural Mechanization and Energy in Agriculture ANKAgEng’2023, Lecture Notes in Civil Engineering, Springer Nature Switzerland, 458, pp. 240–261, https://doi.org/10.1007/978-3-031-51579-8_23.
Acknowledgements
This work was supported by the Confined Animal Manure Managers (CAMM) Program of Clemson University Extension. Composted poultry litter was supplied by Mr. Tim McCormick, and the pine bark was supplied by a manufacturer of soil amendments located in, Anderson, SC. Dr. R.F. Polomski, Associate Extension Specialist–Horticulture/Arboriculture at Clemson University, provided valuable assistance in selecting the ingredients for the base mix and provided valuable insight concerning woody ornamental production. Dr. K. Moore, retired director of the Agricultural Service Laboratory, directed the chemical analyses.
The authors are solely responsible for the content of these proceedings. The technical information does not necessarily reflect the official position of the sponsoring agencies or institutions represented by planning committee members, and inclusion and distribution herein does not constitute an endorsement of views expressed by the same. Printed materials included herein are not refereed publications. Citations should appear as follows. EXAMPLE: Authors. 2025. Title of presentation. Waste to Worth. Boise, ID. April 7-11, 2025. URL of this page. Accessed on: today’s date.
The safe and biosecure disposal of livestock mortalities is a vital concern for livestock producers and the environment. Traditional on-farm livestock disposal methods include composting and land burial, with burial posing environmental risks if leachate generated during carcass decomposition moves through the soil profile to reach groundwater. A 1995 study on the groundwater quality around six poultry mortality piles found elevated concentrations of ammonia and nitrate in the surrounding wells, demonstrating the risk of water contamination from carcass disposal (1). Moreover, the risk of disease transmission to nearby animal facilities associated with an outbreak and large mortality event, particularly due to a foreign animal disease outbreak, dictates that on-farm mortality disposal be conducted in a way that contains and eliminates pathogenic organisms. In the case of a large mortality event, landfills or rendering facilities may not have capacity to receive mortalities or they might refuse to accept them.
On-farm methods accepted in most states include land burial, composting, and incineration. While burial of mortalities often requires less labor and capital cost than composting or incineration, it comes with unique challenges, namely having sufficient space to bury large quantities of animals, adequate soil structure to contain leachate produced during decomposition, and sufficient depth to groundwater to avoid groundwater contamination. Composting is a valuable method as it can destroy many pathogens because of the heat produced in the process, and the by-product is useful. Some of its downsides include the nuisance odor produced and insects such as flies that often accompany the piles. Incineration, while highly effective at reducing volume of carcasses and disease-causing organisms, relies on access to a portable incinerator and sufficient fuel to operate it (2).
Shallow burial with carbon (SBC) is an emerging method for carcass disposal that combines the more common methods of composting and burial. With this method, a shallow pit is excavated in soil and 24 in of carbon material is placed in the trench prior to placing carcasses. The carcasses are then covered using the excavated soil. A field study comparing performance characteristics of SBC and composting for swine carcass disposal (3) found that SBC maintained thermophilic temperatures that met EPA 503(b) time-temperature standards (4), produced less leachate per unit mass of carcasses, and yielded lower contaminant loads (e.g. E. coli) than compost units, suggesting it may also be a suitable mortality disposal method during a foreign animal disease (FAD) outbreak. Further, SBC is a desirable mortality disposal option because it requires less carbon material than composting and does not require management beyond the establishment of the disposal site.
While the previous field study demonstrated lower leachate production from SBC than composting units, the potential may exist to further limit leachate production by identifying carbon materials with greater capacity to absorb liquid produced during carcass decomposition. The primary purpose of establishing a base of carbon material in SBC or composting disposal units is to absorb leachate released during decomposition, reducing the transport of contaminants to water sources. Therefore, this study explored absorbency of several organic materials for inclusion in SBC or mortality compost piles to reduce leachate losses.
What Did We Do?
Our team identified several alternative organic materials for pile construction including wood chips, silty clay loam soil, corn stover, recycled paper pulp (SpillTech(R) Loose Absorbent), and cellulose fiber (Pro Guard Cellulose Fiber). These were tested alone and in combination with 1% by mass (of base material) of sodium and potassium polyacrylate crystals, and 2-mm water gel beads (ZTML MS brand). Hydrogels (HG), sodium polyacrylate (SP), and potassium polyacrylate (PP) were demonstrated in previous studies to retain water in experimental greenhouses (5).
Five replicates of each treatment were enclosed in 4×6 inch cotton mesh bags (TamBee Disposable Tea Filter Bags, Amazon.com) and weighed prior to being submerged in deionized (DI) water at pH 7 for two hours (Figure 1). Bags were removed from the water and allowed to drain for 5 minutes before being weighed again. The bags were resubmerged for an additional 22 hours after which they were removed, allowed to drain for 5 minutes, and weighed again.
Figure 1. Methodology to evaluate absorptivity of treatments
Five replicates of each combination of base material and absorbent additive were also evaluated using DI water adjusted to pH 3, 5, 7, 8, 10 and using 0.01M NaCl to evaluate the effect of pH on absorbency.
The swelling ratio (SR) of each treatment was calculated using the following formula:
SR = Ww – Wd
where Ww is the wet weight and Wd is the dry weight.
The expected water holding capacity (C) was calculated for each combination.
C = SR ⋅ D
Where C is measured in gallons of water per lb of treatment material and D is the density of base material.
The average of the SR value for the five replications of each combination was further used to determine economic feasibility for retaining leachate from a large-scale mortality compost or burial pile. This was done by first determining the average amount of leachate produced from the mortality piles during the preceding year-long field study in eastern Nebraska (6,030 gallons). This was considered the target volume of material held by an alternative material or combination of materials in the economic assessment.
The volume of leachate was converted to mass, and the swelling ratio average values were used to calculate the mass of base material needed to hold the target quantity of water. These values were then used to calculate the total cost (based on pricing from various sellers) to build a pile of each of these materials that would hold the target volume of leachate. Table 1 shows the price per pound of each material tested; the price of the wood chips, corn stover, and soil were estimated based on these sources, though true price will vary based on region and supplier.
Results from an analysis of variance (ANOVA) of the SR data showed that SR was not significantly impacted by the soaking time or by pH of the soaking solution. The results also showed that only the addition of 1% SP had a significant effect among the three superabsorbent additives when compared to no additive in the same base material. This effect was relatively equal between all base materials. The other super absorbents (1% HG and 1% PP) did not have a significant effect due to the high variability in the results. The most meaningful differences in absorptive capacity were attributed to base material (Figure 2). On average, the swelling ratio of cellulose fiber (no additives, 24-hour soak, pH 7) is 0.577 gallons water/lb base material. For corn stover, this value is only slightly lower, at 0.447 gallons water/lb base material. Wood chips, the material used in compost piles in the preceding study, had much worse results at only 0.188 gallons water/lb base material.
Figure 2. Mean swelling ratios for organic base materials tested (without additives) after 24-hours soaking in water, pH 7. Letters denote significant differences in water holding capacity, error bars show standard error.
The results of the economic analysis are included in Table 2. The corn stover (without super absorbents) emerged as the most cost-effective material, with an estimated $258 total cost of material required to absorb the average amount of leachate observed in a previous yearlong field study that evaluated leachate volume produced from six disposal piles, each containing 20 pigs with a mean weight of 5,826 lb (±90.8 lb). The next most economical option was soil alone ($392) and then corn stover with sodium polyacrylate added ($782).
Table 2. Material cost to retain a leachate volume of 6,030 gallons
Material
Mass Required of Base Material (lb)
Cost
Woodchips
36,425
$ 1,655
Woodchips + SP
36,126
$ 2,993
Corn Stover
14,202
$ 258
Corn Stover + SP
14,060
$ 782
Cellulose Fiber
10,442
$73,085
Cellulose Fiber + SP
10,338
$72,742
Soil
86,462
$ 392
Soil + SP
85,597
$ 3,596
Recycled Paper
27,289
$50,256
Recycled Paper + SP
27,016
$50,766
SP: sodium polyacrylate
Future Plans
To confirm the swelling ratios calculated in the lab are realistic, further testing of the effectiveness of the recommended base construction will be needed at field-scale. Additionally, analysis of evapotranspiration, rainfall, and temperature in the piles should be collected to build a working relationship of the leachate rates to important environmental conditions and provide insight into the variable water quantities that change with geographical location. Combining these measurements with climate information will form a better predictive model for broader applicability.
Authors
Presenting author
Alexis Samson, Undergraduate Researcher, Department of Biological Systems Engineering, University of Nebraska-Lincoln
Corresponding author
Amy Schmidt, Professor, Department of Biological Systems Engineering and Department of Animal Science, University of Nebraska-Lincoln, aschmidt@unl.edu
Additional authors
Mara Zelt, Research Technologist, University of Nebraska-Lincoln
Gustavo Castro Garcia, Graduate Research Assistant, University of Nebraska-Lincoln
Castro, G., Schmidt, A. (2023). Evaluation of Swine Cadaver Disposal through Composting and Shallow Burial with Carbon (poster presentation). ASABE AIM. Omaha, NE.
This project was partially supported by the National Pork Board Award #22-073. The technical assistance of Maddie Kopplin and Josh Mansfield was critical to the completion of this study.
The authors are solely responsible for the content of these proceedings. The technical information does not necessarily reflect the official position of the sponsoring agencies or institutions represented by planning committee members, and inclusion and distribution herein does not constitute an endorsement of views expressed by the same. Printed materials included herein are not refereed publications. Citations should appear as follows. EXAMPLE: Authors. 2025. Title of presentation. Waste to Worth. Boise, ID. April 7–11, 2025. URL of this page. Accessed on: today’s date.
Livestock producers dealing with animal mortalities may opt for composting as a biosecure on-farm carcass disposal method. The composting process accelerates the decomposition of animal remains, stabilizes nutrients, and, when executed correctly, subjects the carcasses to elevated temperatures capable of eliminating pathogens. Nevertheless, the use of compost derived from animal mortalities may introduce potentially harmful nutrients, heavy metals, pharmaceuticals, or pathogens to cropland when applied as a soil amendment (Sims and Kleinman, 2005).
At the same time, mortality compost represents a potential soil health amendment due to its high carbon content. With carbon being an important building block for organic matter in the soil, the soil will have improved structure and water-holding capacity if carbon content is elevated. There will also be increased microbial activity adding to the soil’s microbial diversity and nutrients present.
This study aimed to confirm these findings and to determine the balance of positive and negative impacts of mortality compost application in Eastern Nebraska by exploring key biological and chemical risk factors in soil receiving swine mortality compost over the course of one growing season.
What Did We Do?
This experiment was conducted at the University of Nebraska Rogers Memorial Farm, located 11 miles east of Lincoln, Nebraska. The study site was comprised of silty clay loam soil that had been cropped using a long-term no-till management system with controlled wheel traffic. Background soil and compost chemical results are portrayed in Table 1. Corn was grown during the previous season, and soybeans were grown during the period of this study. Eight plots (15’ x 15’) were established and randomly assigned to either a 20-ton/ac application of swine mortality compost or no application (control). The compost, made with swine mortalies and a bulking agent of wood chips, was applied to the surface one week after planting.
In-season sampling. Two weeks following treatment application, and every two weeks during the growing season thereafter, soil from each plot was collected from the top 0-4” of the soil profile by random core sampling using a 2 in diameter hand probe. A roughly 200 g composite sample of soil from each plot was used for subsequent analysis. Soil temperature was also recorded for each plot on sampling days at two random locations to depths of 2” and 4” at each location using a hand temperature probe.
Soil samples were assessed in the UNL Schmidt Laboratory in the Department of Biological Systems Engineering for moisture content by drying soil for 48 hours at 221°F, and for the mean weight diameter of wet-stable aggregates by wet-sieving for 10 min at a rate of 30 vertical oscillations per minute. Several biological properties of the soil were also examined, including E.coli prevalence, determined by the proportion of positive samples following enrichment of eight 1-g subsamples of soil in LB broth (Miller) for 8 h at 98.6°F followed by culturing on ChromAgar E.coli selective media for 24 h at 98.6°F. Microbial respiration was measured for two 20-g samples of air-dried soil per plot placed into a 33.8 fl oz glass jar containing a 0.5 fl oz vial of 0.5 M potassium hydroxide (KOH). The soil was re-wet with 0.24 fl oz of deionized water before jars were sealed and incubated at 77°F for 4 days, and the mass of CO2 released during the incubation was determined using the difference in electrical conductivity in the trap material. Finally, metabolic functional diversity was observed for the soil microbial populations by determining the oxidation rates of 31 different carbon substrates using Biolog® EcoPlates following a 48-hour incubation at 77°F of a 10-4 dilution of a 3 g soil sample. Soil microbes in the EcoPlate wells cause oxidation of the carbon species in the plates and results in a color change, which is measured by a microplate reader at 590 and 750 optical density (OD) units. The overall average color intensity, a measure of general population size and activity, as well as the proportional activity by metabolic type (amino acids, carbohydrates, carboxylic acids, polymers, and amines/amines), were considered as ecological soil health indicators in this study.
Harvest and post-harvest sampling. Grain yields were determined by hand harvesting a row length equal to 1/1000 ac from each plot. Soybeans were dried and weighed, and yield values were then converted to bu/ac using a standard 15% moisture content for the soybeans.
Following harvest, soil from each plot was retrieved according to the previously detailed methodology and sent to a commercial laboratory to determine end-of-season values for pH, sum of cations, soluble salts, calcium, organic matter (%), nitrate-N, phosphate (P2O5), potassium (K2O), sulfate, sodium, magnesium, zinc, iron, copper, manganese and heavy metals (arsenic, lead, and chromium) in the top 0-4” of the soil profile. Bulk density was also determined for two locations per plot at depths of 0-2″ and 2-4″.
Table 1. Initial chemical characteristics of compost and soil
Chemical
Compost
Soil
pH
7.1
6.6
Soluble salts (mmho/cm)
11.4
0.13
Zinc, ppm
57.6
1.12
Iron, ppm
1477
44.8
Copper, ppm
13.4
0.73
Manganese, ppm
100.6
9.2
Arsenic, ppm
1.807
5.971
Lead, ppm
2.09
14.46
Chromium, ppm
7.48
35.85
What Have We Learned?
The application of the compost treatment significantly increased the prevalence of E. coli in the soil samples, but only early (4 weeks) in the growing season (Figure 1). This is likely influenced by the compost’s organic matter and microbial diversity, which serve as a carbon source and support microbial population growth. However, as the season progressed, the difference in the prevalence of E.coli in soil that had or had not received compost application narrowed, potentially due to other factors impacting microbial survivability (such as temperature or moisture content) becoming dominant factors. Regression analysis comparing E.coli prevalence to soil moisture and temperature did not show a strong relationship (R-squared values of 0.48 and 0.18, respectively), which indicates that the microbial population is being impacted by other, more complex factors not included in this analysis.
No other soil biology, chemistry, or physical properties that we tested proved to be significantly impacted (a ≥ 0.05) by the application of mortality compost to the soil, nor was the soybean grain yield. This indicates that while the soil health impacts of this single-season compost application were negligible, there is also little risk to water quality associated with the application of 20 ton/ac swine mortality compost in crop production areas that are well-managed with soil conservation best practices.
Figure 1. Prevalence of E.coli in soil over time following compost application. Symbols next to values in week 4 denote a significant difference in the proportion of E.coli-positive samples. Error bars represent SEM (n=4).
Future Plans
The results suggest that there is little risk of prolonged elevated E. coli prevalence in soil when using swine mortality compost in row crop production areas. However, precipitation producing runoff may pose a risk to nearby surface water bodies if experienced within six weeks of compost application. Future research would be required to fully understand the risk of this occurring, but previous research conducted at the same farm determined that a 12.2 m (40 ft) setback of bare soil was sufficient to prevent most chemical and biological pollutants from leaving a field via runoff after receiving surface application of manure (Gilley et al., 2017). This is an encouraging and valuable guideline for producers who are generating compost as part of their operation and must find suitable sites for application.
The negligible soil health improvements from mortality compost application during this single-season study could dissuade crop producers from seeking out this material if it were available in their vicinity. However, where organic matter is needed to improve soil health over time, this product should not be discounted as a valuable soil carbon amendment. While we did not observe any positive soil health impacts from a single 20 ton/ac application of compost in this study, other studies have seen single season effects. Several other studies found significant impacts of applying a single season of organic amendment on soil microbial biomass (Lazcano, et al., 2012; Leytem, et al., 2024; Crecchio, et al., 2001) and on C:N ratio, which were not tested in this study. Thus, future research could explore alternative rates of application, frequency of sampling, or testing methodologies.
Another possible explanation for the lack of significant soil health impacts was that the field used in this study has been under long-term conservation (20+ years of no-till) practices. As a result, we suspect that the soil health improvement gap (e.g., the difference between soil health status and potential soil health status under ideal management) may be quite minimal. Soil sampled from our plots prior to treatment application revealed an average organic matter (OM) concentration of 3.8%, which exceeds the average 2 to 3% OM concentration for this soil type (Magdoff et al, 2021). However, other soil health factors such as bulk density, microbial population richness, and organic nutrient availability were in line with reports for similar soil types (Oregon State University Extension Service., 2019; Chau et al., 2011; University of Florida., 2015). This likely indicates that future applications of this sort should avoid fields with elevated soil organic matter, as they will not greatly benefit from the addition of organic amendments where soil carbon is already sufficient to the needs of the soil ecosystem.
Authors
Presenting author
Jillian Bailey; Undergraduate Researcher; Department of Biological Systems Engineering; University of Nebraska-Lincoln
Corresponding author
Amy Schmidt, Professor, Department of Biological Systems Engineering, University of Nebraska-Lincoln, aschmidt@unl.edu
Additional author
Mara Zelt, Research Technologist, Department of Biological Systems Engineering, University of Nebraska-Lincoln
Additional Information
Castro, G., Schmidt, A. (2023). Evaluation of Swine Cadaver Disposal through Composting and Shallow Burial with Carbon (poster presentation). ASABE AIM. Omaha, NE. https://publuu.com/flip-book/818714/1802503
Crecchio, C., Curci, M., Mininni, R., Ricciuti, P., & Ruggiero, P. (2001). Short-term effects of municipal solid waste compost amendments on soil carbon and nitrogen content, some enzyme activities and genetic diversity. Biology and Fertility of Soils, 34(5), 311–318. https://doi.org/10.1007/s003740100413
Gilley, J. E., Bartelt-Hunt, S. L., Eskridge, K. M., Li, X., Schmidt, A. M., & Snow, D. D. (2017). Setback distance requirements for removal of swine slurry constituents in runoff. Transactions of the ASABE, 60(6), 1885–1894. https://doi.org/10.13031/trans.12310
Lazcano, C., Gómez-Brandón, M., Revilla, P., & Domínguez, J. (2012). Short-term effects of organic and inorganic fertilizers on soil microbial community structure and function. Biology and Fertility of Soils, 49(6), 723–733. https://doi.org/10.1007/s00374-012-0761-7
Leytem, A.B., Dungan, R.S., Spiehs, M.J., Miller, D.N. (2024). Safe and sustainable use of bio-based fertilizers in agricultural production systems. In: Amon, B., editor. Developing Circular Agriculture Production Systems. 1st edition. Cambridge, UK: Burleigh Dodds Science Publishing. p. 179-214. https://doi.org/10.19103/AS.2023.0120.16
Sims, J. T., & Kleinman, P. J. A. (2005). Managing Agricultural Phosphorus for Environmental Protection. In J. T. Sims, & A. N. Sharpley (Eds.) Phosphorus: Agriculture and the Environment (Vol. 46, pp. 1021-1068). American Society of Agronomy. https://doi.org/10.2134/agronmonogr46.c31
Funding for this study was provided by the Agricultural Research Division (ARD) of the University of Nebraska-Lincoln through an Undergraduate Student Research Program grant award. Much gratitude is extended to collaborating members of Rogers Memorial Farm, Stuart Hoff and Paul Jasa, and to the members of the Schmidt Lab – Alexis Samson, Logan Hafer, Maddie Kopplin, and Carol Calderon – for their assistance with sample collection and analysis.
The authors are solely responsible for the content of these proceedings. The technical information does not necessarily reflect the official position of the sponsoring agencies or institutions represented by planning committee members, and inclusion and distribution herein does not constitute an endorsement of views expressed by the same. Printed materials included herein are not refereed publications. Citations should appear as follows. EXAMPLE: Authors. 2025. Title of presentation. Waste to Worth. Boise, ID. April 7–11, 2025. URL of this page. Accessed on: today’s date.
While both raw and composted manure benefit soil health and crop production, there are benefits to creating and land-applying composted manure over raw manure. Product uniformity, volume, weed seed, pathogen and parasite reduction and nutrient stability are just a few of the benefits. However, composting manure in Minnesota and North Dakota have yet to gain popularity.
A group of compost producers, who ultimately became our producer cooperators and partnered with us for workshops, were consulted on the reason composting manure is not more common. One said, “It is lack of understanding and time management that holds most other farmers back from composting manure; they do not know how much composting can help their operation.” Another mentioned, “When I started researching composting for my farm, I took a three-day class in Illinois because there wasn’t anything available in North Dakota or Minnesota. Most farmers are not willing to travel that far. There is a need for composting education programs in the two-state area.”
What Did We Do?
NDSU Extension partnered with the University of Minnesota Extension with the original plan of holding four workshops in two years (two each in ND and MN). When implications from the COVID-19 pandemic ensued, we changed our plans to host an online workshop in 2020 and were able to continue with two in-person workshops in 2021.
The online workshop consisted of 13 videos that were sent to registrants 2 weeks before an online, live discussion was held in August 2020 with the presentation team as well as 3 producer cooperators. One of the videos consisted of on-farm interviews with each of our producer cooperators to show the registrants the ability to manage compost differently with similar results. The videos are still available and have been viewed collectively 1,845 times.
The in-person workshops were held in July and August of 2021. Each workshop covered the same material as the online workshop and all three producer cooperators attended each event. The producer cooperators were responsible for helping attendees with the compost diagnostics activity as well as answering questions during a panel discussion.
What Have We Learned?
Online Workshop
180 people registered for the online workshop and 50 joined the live discussion with presenters and producer cooperators
43 responded to the immediate follow-up survey where
76% thought the self-paced format was excellent
64% thought the amount of material was excellent
62% thought the topics covered were excellent
15 months after the online workshop, 21 people participated in a follow-up survey and as a result of the workshop, 58% reported they had altered their manure composting practices.
When asked what manure composting change(s) they made, 58% reported they improved their operations adding,
“I have more confidence in my ability to compost successfully and have a better understanding of the environmental impacts of composting.”
“I no longer have to pay someone to haul away our waste”
“Although not composting on a commercial level, I manage several community gardens where large volumes of biomass are accumulated. After learning additional techniques, my piles were hotter and decomposed more quickly. The key? More moisture!”
Moving the workshop online for the first year allowed us to fully engage our producer cooperators. The online workshop resulted in participant comments such as,
“Well organized and executed. Appreciated that videos were individual by topic area, short, and focused. That allowed me to watch what was relevant and fit it into my day more easily.”
“Really enjoyed the discussion and interaction between the three cooperators. Also appreciated having enough time to flesh out the information, i.e., didn’t try to squeeze it into one hour.”
Though an in-person meeting would have allowed more hands-on experience, the online version reached a broader audience with attendees from 31 states and 3 countries.
In-person Workshops
31 people attended the in-person workshops in ND and MN, of which 10 participated in a 4-month follow-up survey
67% of those who made changes as a result of the workshop stated they started composting manure
100% of those who did not make changes were either agency or university Extension/research personnel who reported the workshops impacted them, their work, and/or their relationship with their clients by:
“Allowing me to be more educated about manure composting so that when producers inquire about composting I am able to give them accurate information.”
“Using workshop information to inform clients of another manure handling method to consider; composting.”
The workshops, both online and in-person, facilitated discussion and mutual learning among experienced and novice composters of livestock manure.
Future Plans
Questions about static composting were asked during both the online and in-person workshops. This practice is not common in North Dakota or Minnesota so there is certainly a future learning and workshop opportunity.
Authors
Mary A. Keena, Extension Specialist, North Dakota State University
Chryseis Modderman, Extension Educator, University of Minnesota; Melissa L. Wilson, Assistant Professor and Extension Specialist, University of Minnesota; William J. Gale, Extension Agent, North Dakota State University
This project was funded by North Central Sustainable Agriculture Research and Education (NC-SARE).
The authors are solely responsible for the content of these proceedings. The technical information does not necessarily reflect the official position of the sponsoring agencies or institutions represented by planning committee members, and inclusion and distribution herein does not constitute an endorsement of views expressed by the same. Printed materials included herein are not refereed publications. Citations should appear as follows. EXAMPLE: Authors. 2022. Title of presentation. Waste to Worth. Oregon, OH. April 18-22, 2022. URL of this page. Accessed on: today’s date.
The objective of this study was to evaluate nutrient dynamics and operational costs within an existing manure Compost Aeration and Heat Recovery system (CAHR) by Agrilab Technologies, Inc. at the Vermont Natural Ag Products (VNAP) compost facility in Middlebury, Vermont in comparison to conventional windrow manure composting where aeration only occurs via turning. Constructed in 2016 and 2017, the CAHR has been fully operational since 2018 and has proven effective at reducing VNAP’s expenditures on #2 heating oil, propane, diesel fuel, and labor (Foster et al., 2018).
The basic design of the CAHR system includes compost windrows placed on a paved pad containing a shallow trench oriented longitudinally with the windrow. The trench contains perforated High Density Poly Ethelene (HDPE) piping bedded in wood chips. These pipes are connected to solid, insulated HDPE piping which runs to a shipping container outfitted with circulation fans and a heat exchanger. While the circulation fans are negatively aerating (i.e., pulling vapor from) the compost, warm vapor entering the system transfers heat energy to water piped through the heat exchanger. Heat recovered from compost windrows has been used to heat the site’s bagging building via radiant floor heating and to dry finished compost prior to the screening and bagging process. Furthermore, due to elevated oxygen levels provided by positive and negative aeration, CAHR-treated compost has been reported to mature more quickly and require less turning, reducing diesel, labor, and equipment maintenance costs (Foster et al., 2018).
What Did We Do?
Two compost windrows of equivalent feedstock contents and ratios were monitored. Our control, denoted as “TRAD”, was a conventionally treated windrow that did not receive aeration aside from periodic windrow turning with a Komptech Topturn x53 compost turner. Our experimental windrow, denoted as “CAHR”, received periodic positive and negative aeration via the CAHR system, as well as aeration through periodic turning. The initial volumes of the TRAD and CAHR windrows were 480.2 CY and 548.8 CY, respectively.
Compost samples were collected between August 24th, 2021 and December 15th, 2021. For the first thirteen weeks of the sampling period, samples were taken thrice weekly from both treatments. At the end of the thirteenth week, on November 19th, VNAP staff deemed the CAHR treatment compost suitable for market and it was pulled for processing. Sampling continued once weekly for the TRAD treatment for another four weeks, terminating on December 15th, when the TRAD windrow was pulled for processing. This resulted in a total of 43 samples of TRAD and 39 samples of CAHR composts.
What Have We Learned?
This study evaluated nutrient status, financial cost, and energy cost for a pair of commercial compost windrows in a normal production setting. From a time and space management standpoint, compost treated with a forced-aeration system was deemed suitable for market in approximately 75% of the time as a conventionally turned windrow; 13 and 17 weeks, respectively. Analysis of nitrogen species status throughout the study suggests that greater nitrogen losses occurred during conventional treatment than during CAHR treatment, presumably due to higher rates of denitrification and ammonia volatilization. Data also suggest a lower risk for phosphorus loss through leaching from CAHR-treated compost, as water extractable phosphorus (WEP) concentrations were consistently higher in the conventional treatment. During the active composting process, it was found that operational costs for CAHR compost were 2.1 times more expensive financially and 5.5 times more energy-intensive than a conventional compost on a per CY basis. However, the energy and infrastructure cost offsets provided by the CAHR system (as operated at VNAP) could provide a net savings of $4.06/CY finished compost. In this study, with paired windrows of approximately 12 feet in width, it was shown that a CAHR system produced a comparable compost product, with higher operational input, in less time.
Furthermore, the data suggest that land application of either compost treatment evaluated in this study may reduce phosphorus loss due to leaching versus direct manure application. For example, WEP concentrations in the finished composts in this study ranged between 0.256 and 0.304 g/kg on a dry weight basis, while WEP concentrations in dairy manures have been found to range between 1.98 and 4.0 g/kg (P. Kleinman et al., 2007; P. J. A. Kleinman et al., 2005). It is probable that either compost treatment, when applied to agricultural land, would release less phosphorus as WEP during rainfall events than direct manure application, providing water quality benefits.
Future Plans
The Newtrient CIG will continue to evaluate 13 more technologies over the next 2 years to determine their effect on water quality.
Authors
Mark Stoermann, Chief Operating Officer, Newtrient LLC
Corresponding author email address
Mstoerm@newtrient.com
Additional authors
Finn Bondeson, Graduate Student, University of Vermont; Joshua Faulkner, Research Assistant Professor and Farming and Climate Change Program Coordinator, University of Vermont; and Eric Roy, Assistant Professor, Interim Director of Environmental Sciences Program, University of Vermont
Additional Information
Newtrient.com
The authors are solely responsible for the content of these proceedings. The technical information does not necessarily reflect the official position of the sponsoring agencies or institutions represented by planning committee members, and inclusion and distribution herein does not constitute an endorsement of views expressed by the same. Printed materials included herein are not refereed publications. Citations should appear as follows. EXAMPLE: Authors. 2022. Title of presentation. Waste to Worth. Oregon, OH. April 18-22, 2022. URL of this page. Accessed on: today’s date.
The overall purpose of this research was to demonstrate the volume, weight and moisture reduction from composting pen pack cattle manure so that organic nutrients can be transported farther from the livestock barn. Simultaneously, through laboratory analysis, the goal was to measure the nutrient density of the compost from the start of the process to the finish. The reduction in volume will allow cattle farmers to store more manure in their dry stack (manure) barns to be land-applied at more ideal times, thus avoiding winter application on frozen and/or snow-covered ground.
Due to the overwhelming weight and volume logistics of unprocessed (raw) manure in general, often the manure is land-applied to fields relatively close to the livestock barn. This phenomenon has historically resulted in some fields or areas within fields that have high or luxury levels of soil test phosphorus and potassium. Manure is a great source of nutrients and organic matter for crop production. Avoiding application of manure on fields that are farther from the livestock barn can result in lower soil health and missed economic opportunity for these fields. Once a drier, more nutrient-dense compost is created, a second purpose of the research is to promote transfer of the compost to fields that are farther from the livestock barn or to fields with lower soil test phosphorus or potassium levels.
A final purpose of the research is to utilize compost in corn production systems to evaluate its benefit when applied at the same nutrient rate as its raw manure or commercial fertilizer counterparts. When manure or compost are added to a crop production system, the health and biology of the soil are improved.
What Did We Do
The study began by working with local cooperators who currently raise cattle and manage manure nutrients. This peer learning group included five (5) cooperators. Each cooperator was asked to build at least one windrow of pen pack (solid, dry bedded) manure removed from their cattle barn. The windrow was not to exceed 6 feet in height by 12 feet in width and could be of any length. All manure was weighed at the start of the composting process and then at the end of the process to measure weight reduction. To measure volume, windrows were measured (height x width x length) at the start and finish; cooperating farmers recorded ‘trucks in’ and ‘trucks out’. The five cooperators built eight (n=8) windrows for the purpose of this study.
For baseline data, all cooperators were asked to dedicate one windrow for weekly mechanical compost turning inside a dry stack barn for eight (8) weeks. Any additional windrows composted were to address research questions raised by cooperators. Two ‘additional’ windrows were turned every 2 weeks and a third ‘additional’ windrow was turned weekly, but in an outdoor setting. Mechanical composting was achieved with an HCL Machine Works pull-type compost turner (Figure 1). The compost turner accomplished two key things: consistently mixing compost ingredients (manure, sawdust, wheat straw), and adding oxygen into the composting system. The compost turner was pulled by a Case IH 190 Magnum tractor equipped with a continuously variable transmission (CVT). The CVT allowed for critical ultra-slow speeds (.05-.15 mph) necessary for early mixing passes with the compost turner and raw ingredients.
Figure 1. A pull-type compost turner (6 foot x 12 foot) used for this study
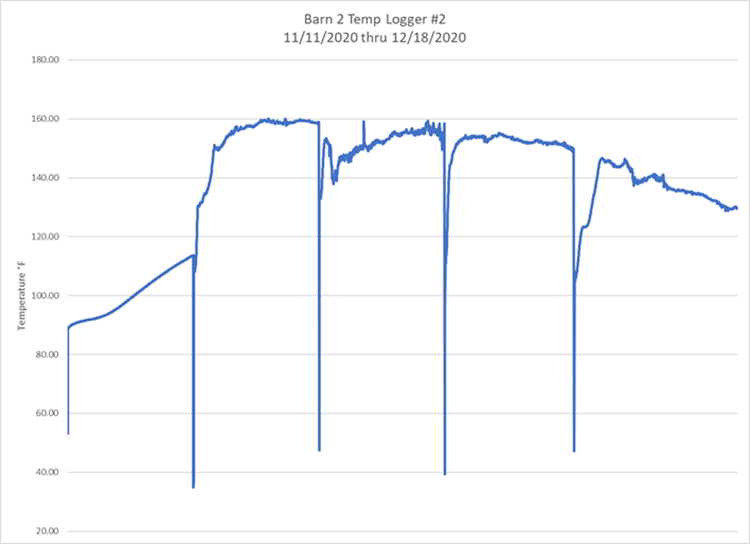
Another significant part of the research was manure nutrient analysis. Every windrow site (n=8) had 3 samples pulled for analysis: once at the start of composting, after every compost turn (6-8 turns on average) and when the compost was land applied or at the last turn. Key nutrients analyzed were nitrogen, phosphorus, potassium, sulfur and calcium. Additionally, temperatures were monitored using a 36” dial compost thermometer (Figure 2) prior to every turn to ensure adequate composting temperatures (120-140 deg F ideally) were maintained. Each windrow also had a HOBO temperature logger inserted in the center of the pile for temperature logging every 15 minutes for the duration of the process.
Figure 2. Compost thermometers (36”) were used to double-check pre-turn temperatures each week
Finally, cooperators were asked to work with the researcher to develop a replicated field trial in field corn utilizing the finished compost product from their farm. Generally, the goal of the field trials were to compare a ‘normal’ rate of manure against a half rate of compost (Figure 3). Yield and moisture data from field trials were collected and analyzed.
Figure 3. Land application of manure (light in color) and compost (dark in color) for replicated strip trials in corn.
What Have We Learned
This research began with an aggregated 258 tons of unprocessed (raw) pen pack cattle manure among 8 sites (windrows) and yielded 121 tons of finished compost, a 53% reduction in weight. However, the volume reduction was less significant than the reduced weight. The number of ‘trucks in’ versus ‘trucks out’ resulted in 28% reduction in volume. The average initial moisture of raw manure was 66% as compared the average final moisture of 48%.
Cooperators turned compost for a minimum of five weeks with some turning up to eight weeks. The average number of turns was seven weeks for each of the eight windrow sites.
The starting nutrient analysis of the manure on a per ton basis was 8 lbs total nitrogen (TKN), 8 lbs phosphorus (P), 14 lbs potassium (K), 1.5 lbs sulfur (S), and 4.5 lbs Calcium (Ca). The finished compost averaged 7.5 lbs TKN, 20 lbs P, 31 lbs K, 3 lbs S, and 12 lbs Ca per ton. Except for total nitrogen, nutrient density more than doubled for these key nutrients as a result of the composting process (Figure 4). It is assumed that nitrogen was consumed in the composting process resulting in increased organic matter and organic carbon.
Figure 4. Density of key nutrients doubled for phosphorus, potassium, sulfur and calcium from the start of composting to the finished product (n=8 sites)
Temperatures were monitored weekly and temperature data indicated that only one windrow dropped below 100 degrees Fahrenheit during the 8-week process. This windrow was smaller than the others and the compost was happening in below freezing temperatures that occurred in the month of February 2021.
Figure 5. Buried temperature loggers monitored compost temperatures throughout the research. Temperature drops resulted when loggers were removed for compost turning and then replaced
Finally, three replicated field trials were conducted in field corn to compare full rates of manure versus half rates of compost (Tables 1, 2, 3). One more comprehensive trial included a university recommended fertilizer rate as well (Table 4). On average, the compost was hauled 4.5 miles from the livestock barn, thus giving some promise to improved transport of manure/compost to farther field locations. The results below are from one year of data at each respective site and should be interpreted as such.
Table 1: Site 1 – Corn for grain
Treatments
Harvest Moisture (%)
Yield (bu/acre)
10 tons/ac MANURE
17.5
252 a
5 tons/ac COMPOST
17.8
245 a
LSD: 11.5, CV 2.0
Table 2: Site 2 – Corn for grain
Treatments
Harvest Moisture (%)
Yield (bu/acre)
Check (no manure or compost)
18.0
258 a
6 tons/ac MANURE
17.9
259 a
3 tons/ac MANURE
18.1
258 a
LSD: 9.7, CV 2.1
Table 3: Site 3 – Corn for silage
Treatments
Harvest Moisture (%)
Yield (bu/acre)
10 tons/ac MANURE
57.8
23.8 a
5 tons/ac COMPOST
57.8
22.7 a
LSD: 1.7, CV 3.1
Table 4: Site 4 – Corn for grain
Treatments
Harvest Moisture (%)
Yield (bu/acre)
Fertilizer (22-52-120-12s/ac)
17.6
190 b
10 tons/ac MANURE
17.7
213 a
5 tons/ac MANURE
17.5
202 ab
LSD: 14.9, CV 4.3
Future Plans
Future plans include adding 4-5 more windrow sites before this 2023 grant expires. In 2022 and 2023, the hope is to compare static windrows versus those that are turned mechanically. In the first 8 sites, compost turning was based on time (weekly or bi-weekly turn). In the future, oxygen level or temperatures should be evaluated to help determine timing of turning. From a crop yield perspective, measuring soybean yields in the year following corn where the compost, manure or fertilizer was applied would be informative for growers as they make decisions about improving placement (transport) of manure or compost further from the livestock barn or to fields that have low soil test phosphorus or potassium. Finally, a complete economic analysis of the composting plus further transport needs to be conducted via a case study model.
Authors
Eric A. Richer, Assistant Professor and Extension Educator, Ohio State University Extension
richer.5@osu.edu
Additional Authors
-Jordan Beck, Water Quality Extension Associate, Ohio State University Extension
-Glen Arnold, Field Specialist, Manure Nutrient Management, Ohio State University Extension
This work is supported by a Great Lakes Sediment and Nutrient Reduction Program grant. Thanks to the five cooperating farmers who participated in this research study with Ohio State University Extension. Thanks to Stuckey Brothers Farms for use of compost turner and Redline Equipment for rental of Case IH 190 Magnum tractor.
The authors are solely responsible for the content of these proceedings. The technical information does not necessarily reflect the official position of the sponsoring agencies or institutions represented by planning committee members, and inclusion and distribution herein does not constitute an endorsement of views expressed by the same. Printed materials included herein are not refereed publications. Citations should appear as follows. EXAMPLE: Authors. 2022. Title of presentation. Waste to Worth. Oregon, OH. April 18-22, 2022. URL of this page. Accessed on: today’s date.
Concerns are mounting in states that have sensitive waterways about the release of P from manure and compost into ground and surface water. P is the limiting nutrient for many freshwater ecosystems and as such regulate the rate of eutrophication and oxygen depletion. The concerns have led to new regulations that limit the application of manure and in some cases compost products that have high concentrations of P. Also, compost use in stormwater biofiltration swales has been called into question because of the potential leaching of P. There are concerns in the composting industry that the regulations will limit the application of compost and reduce the market for compost products.
Composting can theoretically increase the biological activity of the soil matrix and help the formation of aggregates that absorb nutrients. Compost also contains metals such as iron, magnesium, calcium and aluminum that help bind P to the soil particles. Composting has a substantial impact on N as the high temperatures result in losses of ammonia. Depending on the stage of composting, the bacterial thermophilic phase of composting can release P during the breakdown of plant and animal tissue. In contrast the curing or fungal phase can bind nutrients into the hyphae and to the stabilized organic substrate. Additionally, soils high in organic C have lower bulk densities and prevent runoff because of the increased water holding capacity and infiltration rates*. The concept is that even though the overall P levels in the soils are increasing with compost application, only a small portion of the P is in the liquid phase and there is sufficient soil and plant uptake to limit P losses.
*Spargo, J.T., G.K. Evanylo, and M.M. Alley. 2006. Repeated compost application effects on phosphorus runoff in the Virginia Piedmont. J. Environ. Qual. 35:2342–2351.
What did we do?
In 2014, Green Mountain Technologies (GMT) received an Animal Waste
Figure 1. Site map for Days End Farm
Technology Fund (AWTF) grant from the Maryland Department of Agriculture to install an Earth Flow composting systems at Days End Farm (DEF, Fig. 1) in Howard County and Glamor View Farms in Frederick County. There were two types of manures that were tested, dry pack manure from Glamour View Farms and bedded horse manure from Days End Farm.
Days End Farm Horse Rescue is a non-profit, volunteer-based animal welfare organization established in 1989 to provide care and treatment for horses that have been abused or mistreated. DEF works to rehabilitate horses, find good homes for them and educate the public about humane treatment of horses. DEF cares for between 100-150 horses annually, rehabilitating them and preparing them for adoption.
Figure 2. Locator map for Glamor View Farms
Glamour View Farm (GVF, Fig. 2) is a 146-acre dairy operation which is a part of Lager Farms. Glamour View houses approximately 180 Holstein and Jersey cows. In 2014, Green Mountain Technologies (GMT) and GVF received an AWTF grant from the Maryland Department of Agriculture to install an Earth Flow composting system at GVF in Frederick County, Maryland.
Description of the Earth Flow Composting System
The Earth Flow (Fig. 3 & 4) is an in-vessel composting system that integrates an automated mixing system, aeration system and moisture addition system into the vessel. The Earth Flow system accelerates the composting process by providing optimum conditions for aerobic composting. The combination of these features facilitates a thermophilic composting process for horse manure and bedding in 10-14 days.
The Earth Flow has an integrated mixing system (Fig. 5) that allows the compost to be mixed on a daily basis (2-4 times per day). The traveling auger is the key to the effectiveness of the Earth Flow. It provides seven different functions that facilitate the hot composting process:
Shreds. The auger breaks up manure balls to reduce particle size and expose nutrients to the microbes.
Mixes. The auger mixes material by smearing manure onto bedding.
Aerates. The auger continually fluffs the compost to add oxygen to the compost matrix.
Distributes Moisture. The auger sweeps up wet material from the lower portions of the compost pile and elevates it to the surface.
Homogenizes. The auger homogenizes manure with bedding for an even distribution of nutrients.
Figure 5. Auger mixing system
Transports. The auger slowly increments compost from the load end to the discharge end.
Stacks. As compost reduces in volume, the auger continually stacks the material toward the back to maximize utilization of the space.
The Earth Flow is designed such that feedstocks are loaded on one end of the vessel and finished product is discharged from the opposite end of the vessel.
The Earth Flow at Days End Farm is operated as a continuous-flow system. In a continuous-flow system, feedstocks can be loaded at any time on the load end and the traveling auger slowly migrates compost to the discharge end. Material can be discharged once the vessel is full and/or the user is ready to discharge compost. The standard mixing pattern of the auger is shown below.
The basis of the study was to evaluate whether composting manure would reduce the amount of P, especially the water extractable P compared to raw manure. The theoretical basis for this reduction is that composting would add more carbon and also tie up P in the increased biomass making it less available to run off. While N can be lost to the atmosphere as ammonia or converted to elemental nitrogen gas, P is only transportable in liquid phase and can neither be created or destroyed by the normal biological processes. P is essentially recycled through biomass and decaying plant and animal tissues release P that is the reabsorbed by new living tissue.
Samples of raw manure were collected prior to composting and the same manure was sampled 3-4 weeks later to determine the changes in nutrient levels and water extractable P. Samples were taken every quarter for a one year period to assess any seasonal changes. One of the proposed applications for the compost product was bedding reuse so some of the focus of the study related to product quality as a recycled bedding material.
What we learned
Bedded Horse Manure
The average total Nitrogen (N) of 0.68% comprised 0.03% Ammonia-N of the loaded mixture (over the study period) with 52% moisture and 48% solids, with a total carbon content of about 40%, resulting in a C:N ratio of 29. Total P in the loaded mixture was 0.17% of which 0.40% was P2O5. For the compost produced during this period, the total N averaged 0.6% (5980 mg/kg) of which 0.06% was ammonia (577 mg/kg) and 0.54% was organic N (5436 mg/kg) and 470 mg/kg nitrate-nitrite N. The total carbon was 44.87% (44867 mg/kg), resulting in a C:N ratio of 214, with an average moisture content of 20% (Tables 3 and 4).
The average N:P ratio for the unloaded compost is 1.5 (5980:4140). Minerals analyzed from the manure and unloaded compost showed variability between samples collected on the different dates, but all measured concentrations of calcium, magnesium, sodium, iron, aluminum, manganese, copper, and zinc were within acceptable ranges. The nearly 30% decrease in moisture content over the composting period was measured, this is of interest as the compost process is optimal at 50% moisture content with a workable range from 40-60%. When moisture reaches 35% or less the material is suitable for screening when producing a product for landscape or horticultural uses. In addition, microbial decomposition (metabolic) activity decreases substantially resulting in insufficient metabolically generated heat within the compost mass. The TKN and C:N data indicate a substantial reduction in N during the compost process. We inquired with Waypoint about data reporting errors as the N values seemed surprisingly low. They had already disposed of the samples so they were not able to rerun the test. They did offer to retest and we may have them run the data points again. If the N data is correct, then a substantial amount of N would have been lost to the air as ammonia. In contrast, two of the three P values were higher in the compost than in the raw manure. There may be several explanations for this trend. One point of interest as the bedding reuse continues is the accumulation of P in the compost product.
Dairy Dry Pack Manure
Penn State Labs performed the lab analysis of the raw manure and compost samples on 8/7/17. The lab samples were stored at Michael Calkin’s refrigerator and shipped to Penn State. Two samples were taken at the load and unload ends of the vessel each week and combined into a single grab sample. Ammonia and Organic N were analyzed as well as P, extractable P and carbon. Because Glamor View is operated as a batch system, the initial sample on 5/28/17 represents the raw manure at both the load and unload ends of the vessel. Each subsequent lab analysis shows the weekly change in N or P as the manure turns into compost as shown below (Fig. 6 – 8).
Figure 6. Nitrogen levels of dry pack manure before and after composting.Figure 7. P2O5 levels of dry pack manure before and after composting.Figure 8. Water extractable phosphorus levels before and after composting.
Winter 2017
The nutrient levels showed no clear trend of diminishment during the 3 weeks of monitoring as shown in Table 1. The average N actually increased which seems highly unlikely given ammonia losses typically experienced during composting. The good news is that it has reasonable fertilizer value when compared to typical composts. The average P2O5 levels were unchanged during the 3-week sampling also. The water extractable P showed a slight downward trend but once again the data was scattered. The only conclusion we can make from the data is that more P was liberated during the thermophilic phase of composting than was bound up by bacterial bodies. In retrospect, additional water extractable samples should have been performed on the cured compost to see how much water extractable P is in the product immediately before the compost is applied to fields or gardens.
Table 1. Lab Analysis of Bedded Horse Manure Before and After Three Weeks of Composting
Average results for Compost Feedstock Loaded into the Earth Flow unit at
Days End Farm in
December 2015
Average results for Compost Unloaded from Earth Flow unit at
Days End Farm in
December 2015
TEST
Dec 2015 Summary (%)
Average result-Dec 2015 (mg/Kg)
TESTα
Dec 2015 Summary (%)
Average result-Dec 2015 (mg/Kg)
As Received
Dry basis
Nitrogen, N %
0.39
0.95
Ammonical-N %
0.07
0.16
Total Kjeldahl Nitrogen
1.12
11200.00
Phosphorus, P %
0.10
0.23
Total Phosphorus
0.33
3346.67
Potassium, K %
0.36
0.87
Total Potassium
1.10
11033.33
Sulfur, S %
0.06
0.14
Total Sulfur
0.19
1923.33*
Magnesium, Mg %
0.13
0.32
Total Magnesium
0.38
3760.00*
Calcium, Ca %
1.76
4.53
Total Calcium
2.35
23466.67*
Sodium, Na ppm
602.00
1480.00
Total Sodium
0.18
1773.33*
Iron, Fe ppm
889.00
2173.33
Total Iron
4310.00*
Aluminum, Al ppm
368.33
873.00
Total Aluminum
3500.00*
Manganese, Mn ppm
93.07
230.00
Total Manganese
278.67*
Copper, Cu ppm
8.05
19.77
Total Copper
26.33*
Zinc, Zn ppm
33.60
82.93
Total Zinc
91.33*
Boron, B ppm
2.50
6.12
Total Volatile Solids
78.14
781400.00
Test
Result
Result
Moisture %
59.5
Moisture †
31.46
Moisture †
Solid %
40.5
Total Solids †
68.54
685366.67
Additional Tests
Result
P2O5 (as received) , %
16.41
C/N RATIO †
40.67
K2O (as received) , %
0.428
Carbon (TOC) †
45.43
454333.33
αAll values are on a dry weight basis, except as noted by†; Detection limit on all N series is on a wet basis.
*Within normal range, Analyses by Waypoint Laboratories, Richmond, VA
Figure 9. Nitrogen levels of dry pack manure before and after composting.Figure 10. P2O5 levels of dry pack manure before and after composting.Figure 11. Water extractable phosphorus levels before and after composting.
Spring 2017
Unlike the last sampling event over the winter, the nutrient levels showed a clear trend of diminishment during the 3 weeks of monitoring as shown in Fig. 9-11. The average N reduced by 30% or more during the three weeks of composting. The average P2O5 levels showed a downward trend on the unload and unchanged on the load end which is expected given that P is not lost in the compost process. The water extractable P had a clear downward trend for both the load and unload ends of the vessel with an average 42% reduction over the 3 weeks. Water extractable P is more important than a reduction in the P2O5 levels as it indicates the amount of P available for leaching. In general, the lab data supported the trends that are typical of composting. It is not clear if the change over the winter results were seasonal or if the sampling methods were inconsistent. One possibility is the change in feed type that the heifers receive in the summer vs winter. In retrospect, additional water extractable samples should have been performed on the cured compost to see how much water extractable P is in the product immediately before the compost is applied to fields or gardens. This sampling would have provided a more complete picture of the entire compost process for nutrient management.
Next Steps
There is no doubt that P chemistry and bioavailability are complicated subjects. Based on this work and studies done by Larry Sikora at USDA and John Spargo there needs to be a more comprehensive study performed with greater control of variables to demonstrate what might actually happen in the field with P availability and losses in compost. The other effort GMT is involved in is the development of a compost feedstock recipe calculator that includes values for different feedstock P concentrations and also performs C/P ratio calculations (Fig. 12). The calculator has an interactive dial format that immediately shows the user how the volumes of different feedstocks changes not only C/N but C/P ratios as shown below. The hope is that the software will raise awareness about P and help to make compost products with balanced nutrient ratios.
Figure 12. User interface for Compost Calc recipe calculating software.
The authors are solely responsible for the content of these proceedings. The technical information does not necessarily reflect the official position of the sponsoring agencies or institutions represented by planning committee members, and inclusion and distribution herein does not constitute an endorsement of views expressed by the same. Printed materials included herein are not refereed publications. Citations should appear as follows. EXAMPLE: Authors. 2019. Title of presentation. Waste to Worth. Minneapolis, MN. April 22-26, 2019. URL of this page. Accessed on: today’s date.
The purpose of this project was to demonstrate the effects of adding natural clinoptilolite zeolites to a dairy manure compost mix at the moment of initiating the composting process on ammonia emissions, nitrogen retention, composting performance, and characteristics of the final compost product. A typical dairy cow in the U.S. produces approximately 148 lb of manure daily (feces and urine, not counting bedding; Lorimor et al., 2000). This amounts to millions of tons of monthly manure production. On-farm composting of manure is one of the most-used practices to manage dairy manure in Idaho. Composting reduces manure volume between 35 and 50%, which allows the material to be significantly more affordable to transport than fresh, wet manure. Composting converts the nitrogen (N) present in the raw manure into a more stable form, which is released slowly over a period of years and thereby not totally lost to the environment. Composting contributes to alleviating problems associated with ground and surface water contamination and also reduces odor complaints (Rink et al., 1992; Fabian et al., 1993). During the manure handling and composting process, between 50 and 70% of the nitrogen can be lost as ammonia if additional techniques are not used to increase nitrogen retention. In most cases, manures from dairies and other livestock operations don’t have the proper carbon to nitrogen (C:N) ratio to be composted efficiently without added carbon (usual straw bedding has a C:N of 60 to 90). Dairy cow manure is rich in nitrogen (C:N ratios below 18:1), causing a great proportion of the available nitrogen to be lost as ammonia due to the lack of carbon to balance the composting process. The loss of nitrogen from manures as ammonia reduces the nutrient value of the manure, produces an inefficient composting process, and generates local and regional pollution. Lack of carbon also results in a lower-grade compost that can carry elevated concentrations of salts, potassium and phosphorous. In many arid zones there are not enough sources of carbon to balance the nitrogen present in the manure.
Zeolite is a mineral defined as a crystalline, hydrated aluminosilicate of alkali and alkaline earth cations having an infinite, open, three-dimensional structure. Zeolites are able to further lose or gain water reversibly and to exchange cations with and without crystal structure (Mumpton, 1999). Zeolites are mined in several western U.S. states where dairy production also is concentrated. This paper showcases a project that explored the effects of adding natural zeolites to dairy manure at the time of composting as a tool to reduce ammonia emissions and retain nitrogen in the final composted product.
What did we do?
This on-farm research and demonstration study was conducted at an open-lot dairy in southern Idaho with 100 milking Jersey cows. Manure stockpiled during the winter and piled after the corral’s cleaning was mixed with freshly collected manure from daily operations and straw from bedding and old straw bales, in similar proportions for each windrow. The compost mixture was calculated using a compost spreadsheet calculator (WSU-Puyallup Compost Mixture Calculator, version 1.1.; Puyallup, WA). Moisture was adjusted by adding well water to reach approximately 50% to 60% moisture on the initial mix. Windrows were mixed and mechanically turned using a tractor bucket. Three replications were made on control and treatment. The control consisted of the manure and straw mix as described. The treatment consisted of the same mix as the control, plus the addition of 8% of clinoptilolite zeolite by weight during the initial mix. Windrows were actively composted for four months or more. Ammonia emissions were measured using passive samplers (Ogawa & Co., Kobe, Japan) for the first five to seven days after building each windrow (called turn 1 in Figure 1) and after the two subsequent turns. Ammonia emissions per measurement period and per turn were obtained. Three periods of one to three days at the time of building each windrow and after the first turn were measured. After the second turn, two measurement periods of three to four days were made. Values of mg NH3-N/m3 are time-corrected by minutes of sampling (Figure 1). Complete initial manure (compost feedstock mix) and final screened compost nutrient lab analyses were performed for each windrow. Analyses of variance (ANOVA) on lab data and on ammonia samples were performed using SAS 9.4 (SAS Institute, Cary, NC).
What have we learned?
The addition of 8% w/w natural zeolites to the dairy manure compost mix on a mechanically turned system using a tractor bucket reduced cumulative ammonia emissions by 11% during the first three turns (Figure 2) and showed a significant reduction trend in ammonia emissions. Figure 1 shows the differences and trend line in ammonia emissions per monitoring period and per turn. Treated windrows’ cumulative emissions were significantly lower (P<0.05) at 2.76 mg NH3-N/m3 from control windrows at 3.09 mg NH3-N/m3. Nitrates (NO3) on the composted treatment (702 ppm) were 3 times greater (p=0.05) than the control (223 ppm) (Figure 3). These results demonstrate that the addition of natural zeolites has a positive effect on reducing ammonia emissions during the composting process and increasing the conversion to nitrates, retaining nitrogen in the compost in a form that is more available to crops.
Future Plans
Field days and journal publications about this project are expected to occur within the next year.
Corresponding author, title, and affiliation
M. E. de Haro-Martí. Extension Educator. University of Idaho Extension, Gooding County, Gooding, Idaho.
M. Chahine. Extension Dairy Specialist. University of Idaho Extension, Twin Falls R&E Center, Twin Falls, Idaho. H. Neibling. Extension Irrigation Engineer. University of Idaho Extension, Kimberly R&E Center, Kimberly, Idaho. L. Chen. Extension Waste Management Specialist,
Additional information
References:
Fabian, E. F., T. L. Richard, D. Kay, D. Allee, and J. Regenstein. 1993. Agricultural composting: a feasibility study for New York farms. Available at: http://compost.css.cornell.edu/feas.study.html . Accessed 04/28/2011.
Lorimor, J., W. Powers, A. Sutton. 2000. Manure Characteristics. Manure Management System Series. Midwest Plan Service. MPWS-18 Section 1. Iowa State University.
Mumpton, F.A. 1999. La roca magica: Uses of Natural Zeolites in Agriculture and Industry. Proceedings of the National Academy of Sciences of the United States of America, Vol. 96, No. 7 (Mar. 30, 1999), pp. 3463-3470
Rink, R., M. van de Kamp, G.B. Willson, M.E. Singley, T.L. Richard, J.J. Kolega, F.R. Gouin, L.L. Laliberty Jr., D.K. Dennis. W.M. Harry, A.J. Hoitink, W.F.Brinton. 1992. On-Farm Composting Handbook. NRAES-54. Natural Resource, Agriculture, and Engineering Service. Cooperative Extension. Ithaca, New York.
Acknowledgements
This project was made possible through a USDA- ID NRCS Conservation Innovation Grants (CIG) # 68-0211-11-047. The authors also want to thank the involved dairy farmer and colleagues that helped during this Extension and research project. Thanks to Dr. April Leytem and her technicians at USDA-ARS in Kimberly, ID, for the loan of the Ogawa passive samplers and for sample analysis.
Manage Cookie Consent
To provide the best experiences, we use technologies like cookies to store and/or access device information. Consenting to these technologies will allow us to process data such as browsing behavior or unique IDs on this site. Not consenting or withdrawing consent, may adversely affect certain features and functions.
Functional
Always active
The technical storage or access is strictly necessary for the legitimate purpose of enabling the use of a specific service explicitly requested by the subscriber or user, or for the sole purpose of carrying out the transmission of a communication over an electronic communications network.
Preferences
The technical storage or access is necessary for the legitimate purpose of storing preferences that are not requested by the subscriber or user.
Statistics
The technical storage or access that is used exclusively for statistical purposes.The technical storage or access that is used exclusively for anonymous statistical purposes. Without a subpoena, voluntary compliance on the part of your Internet Service Provider, or additional records from a third party, information stored or retrieved for this purpose alone cannot usually be used to identify you.
Marketing
The technical storage or access is required to create user profiles to send advertising, or to track the user on a website or across several websites for similar marketing purposes.