
Nutrient Cycling in Horse Pastures


Proceedings Home W2W Home w2w17 logo

Purpose 

This presentation will review the existing multi-species literature on nutrient cycling and how it is affected by the horse’s diet and rotational grazing.

Grazed pastures, particularly rotationally grazed pastures, recycle nutrients faster than ungrazed pastures. Nutrients on pasture land enter through animal waste, and waste feed or fertilizer; they leave through removal of forage, leaching/runoff, or animal product/waste removal. Taking away the animal component removes about half of the inputs needed to recycle the nutrients. Dietary nitrogen (N), phosphorus (P) and potassium (K) are required for basic maintenance of horses; however, not all of what is consumed is used by the animal, therefore the dietary concentrations of these nutrients will impact the nutrient cycling. Digestibility of N, P and K in horses is approximately 80, 25 and 75 %, respectively. What does not get digested will end up excreted back into the soil.

What did we do? 

For example, in one study eight Standardbred mares were divided into two groups and received diets of grass hay and grain. The high P (HP) group received 142 g/d of NaH2PO4, formulated to provide 4.5-times the dietary P requirement, or 65 g phosphorus/d. The low P (LP) group received 28 g of phosphorus/d in the basal diet. Data showed that horses receiving the HP diet excreted higher P and water extractable P in the manure than those fed the LP diet (Table 1; Westendorf and Williams, 2015). The same goes for N, where one study used a treatment group that was supplemented with 700 g/d of soybean meal top dressed on 500 g of sweet feed per day (TRT; 1042 g protein/d DM total), while the control group received the sweet feed meals without the soybean meal (CON; 703 g protein/d total). Both groups were also fed 8 kg/d of a grass hay mix (562 g protein /d DM), water and salt ad libitum. Horses fed the TRT diet excreted more N and NH3 than horses fed the CON diet (Figure 1; Williams et al., 2011).
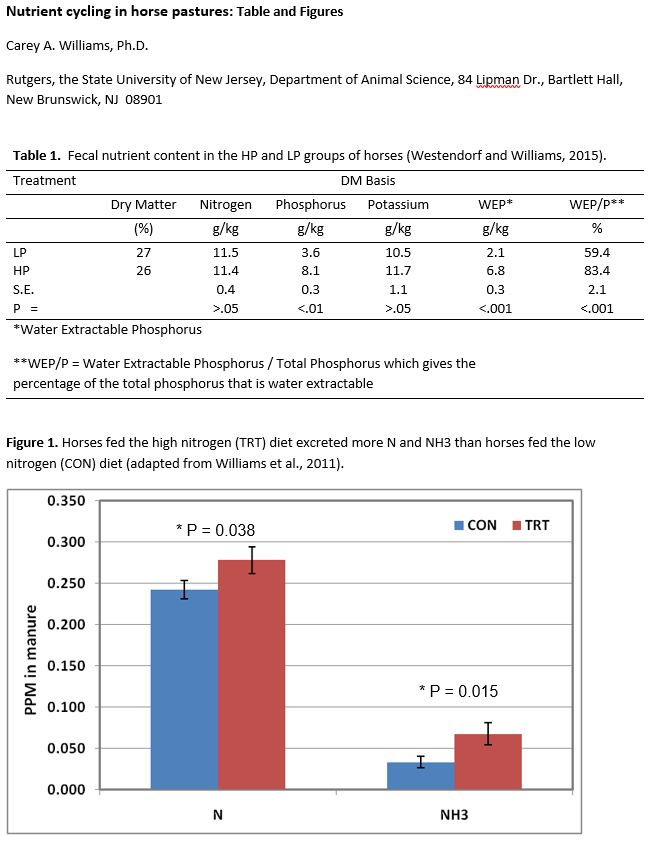
Nutrient Cycling in horse pastures: Tables and Figures

What have we learned? 

More intensive grazing also creates an increased rate of nutrient cycling due to the added animal inputs on the land. Even though no horse related studies have been performed on this topic studies in cattle have found that plant-available N levels doubled when cattle were rotationally grazed with five grazings per season instead of three (Baron et al., 2002). Kenny (2016) looked at horses grazed under either a continuous or rotational grazing system (see Pictures 1 and 2, Left to Right, respectively) and found no differences in system after one year of grazing, however, the author concludes that more time on the system could have generated differences.

Other factors that affect the rate of nutrient cycling include amount of legumes in the pasture, distribution of manure on pastures (i.e. relation to water, shelters and fencing), and use or rates of fertilizer.
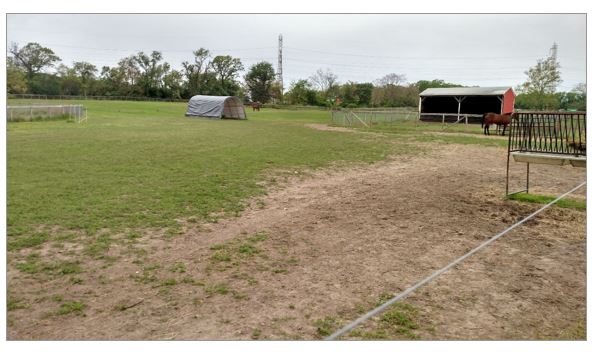
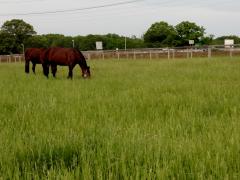
 

Horse in pastureRotational grazing horse

Future Plans    

More equine specific studies need to be performed looking at how grazing systems and equine diets affect nutrient cycling and how horse farm owners can utilize this to best manage their farm for optimal nutrient utilization.

Corresponding author, title, and affiliation        

Carey A. Williams, Equine Extension Specialist, Rutgers, the State University of New Jersey, Department of Animal Science

Corresponding author email    

carey.williams@rutgers.edu

Additional information 

References:

Baron, V. S., E. Mapfumo, A. C. Dick, M. A. Naeth, E. K. Okine, and D. S. Chanasyk. 2002. Grazing intensity impacts on pasture carbon and nitrogen flow. J. Range Manage. 55:525-541.

Kenny, L. B. 2016. The Effects of Rotational and Continuous Grazing on Horses, Pasture Condition, and Soil Properties. Master thesis, Rutgers, the State University of New Jersey, New Brunswick, NJ.

Westendorf, M. L., and C. A. Williams. 2015. Effects of excess dietary phosphorus on fecal phosphorus excretion and water extractable phosphorus in horses. J. Equine Vet. Sci. 35:495-498. doi:10.1016/j.jevs.2015.01.020

Williams, C. A., C. Urban, and M. L. Westendorf. 2011. Dietary protein affects nitrogen and ammonia excretion in horses. J. Equine Vet. Sci. 31:305-306.


The authors are solely responsible for the content of these proceedings. The technical information does not necessarily reflect the official position of the sponsoring agencies or institutions represented by planning committee members, and inclusion and distribution herein does not constitute an endorsement of views expressed by the same. Printed materials included herein are not refereed publications. Citations should appear as follows. EXAMPLE: Authors. 2017. Title of presentation. Waste to Worth: Spreading Science and Solutions. Cary, NC. April 18-21, 2017. URL of this page. Accessed on: today’s date.
Phosphorus Recovery from Anaerobic Swine Lagoon Sludge Using the Quick Wash Process

Proceedings Home W2W Home w2w17 logo

Purpose

Long term and significant accumulation of sludge in anaerobic swine lagoons reduces its storage volume and ability to treat waste. Usually, excess accumulation of lagoon sludge is removed using pump or dredge. The dredged sludge is then land applied at agronomic rates according to its nutrient content.

The accumulation of phosphorus (P) in the sludge requires the largest area of land application based on crop agronomic requirements. Therefore, nutrient management plans may limit application to crop or pastureland near the animal facility to avoid P build up in excess of soil and crop assimilative capacities. Although dewatered sludge can be moved off the farm, transportation becomes less economical with increasing distances. An option is to extract and recover P in a concentrated form for its economical transfer to P-deficient croplands, for use as fertilizer.

What did we do?

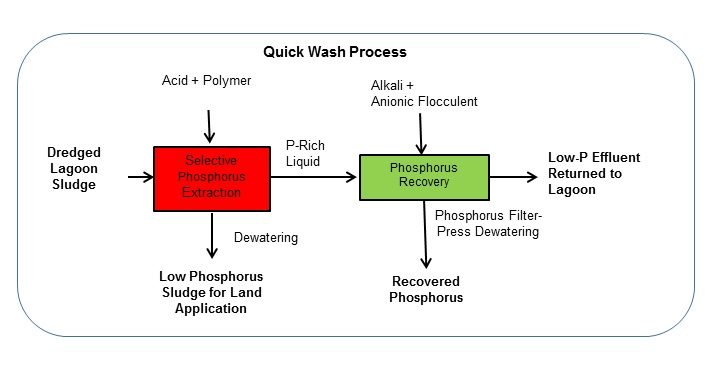
A patented treatment process, called Quick Wash (QW), developed by USDA-ARS for extraction and recovery of P from animal manure solids was tested for recovery of P from anaerobic swine lagoon sludge. With the QW process,Chart of Quick Wash Process P was extracted in solution from dredged sludge by mixing with sulfuric acid prior to dewatering using polymer enhanced mechanical solid-liquid separation. After that, P was recovered by addition of liquid lime and an anionic flocculent to the separated liquid extract to form a calcium-containing P precipitate. The QW process generated two solid products: 1) sludge solids low in P; and 2) a concentrated P material.
What have we learned?

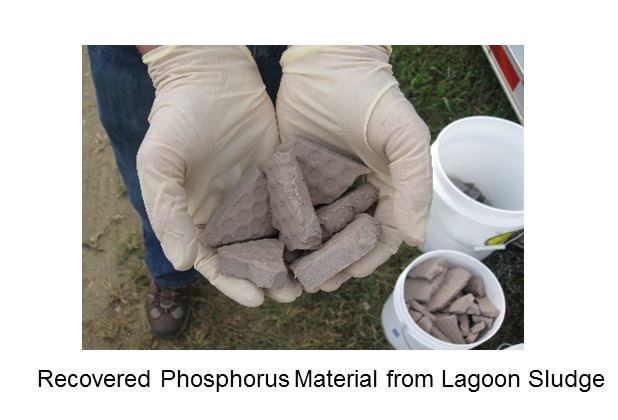
Picture of recovered phophorus material from lagoon sludge

While most of the nitrogen and carbon was left in the washed sludge solids, the QW process extracted and recovered as much as 90 % of the P from sludge. From results of a pilot field test, the P grade of the recovered phosphate was in the range of 24.0% – 30.5 % P2O5. The inclusion of this process in a lagoon sludge management plan offers producers an opportunity to locally land-apply the low-P sludge as a carbon-rich soil amendment and recover P as a valuable product for export from the farm.

Future Plans

USDA granted an exclusive license of the invention to Renewable Nutrients, LLC (Pinehurst, NC) to commercialize in the U.S the process for P recovery from animal and municipal waste streams. Renewable Nutrients is developping commercialization plans for the Quick Wash process that will include the operating and equipment costs of phosphorus recovery from dredged lagoon sludge.

Corresponding author, title, and affiliation

Ariel A. Szogi, Research Leader, USDA-ARS Coastal Plains Soil, Water, and Plant Research Center, Florence, SC.

Corresponding author email

ariel.szogi@ars.usda.gov

Other authors

Matias B. Vanotti; and Paul D. Shumaker – USDA-ARS Coastal Plains Soil, Water, and Plant Research Center, Florence, SC.

Additional information

https://www.renewablenutrients.com/

Acknowledgements

This work is part of USDA-ARS National Program 212; ARS Project 6082-12630-001-00D “Improvement of Soil Management Practices and Manure Treatment/Handling Systems of the Southern Coastal Plain.”

Assessment of Condensed Distillers Solubles (CDS) and Wet Distillers Grains (WDG) as Sources of Phosphorus Fertilizer for Corn and Wheat

Proceedings Home W2W Home w2w17 logo

Purpose

Some farmers in North Dakota are showing growing interest in applying coproducts from ethanol production, as sources of nutrients for crop production, especially corn and wheat. The majority of these coproducts are used as livestock feedstuff, but sometimes, due to a combination of factors, ethanol plants have a surplus of condensed distillers solubles (CDS) and wet distillers grain (WDG). Under those circumstances, the price of CDS and WDG can drop significantly, and due to their nutrient content, it might make financial sense to use them as a source of nutrients for crop production instead of commercial fertilizers. Cognizant of current low market prices of wheat and corn, farmers are seeking effective and less expensive sources of nutrients for their crops. Farmers also like the concept of recycling the nutrients exported in the corn kernels back into the soil in the form of CDS and WDG.

What Did We Do?

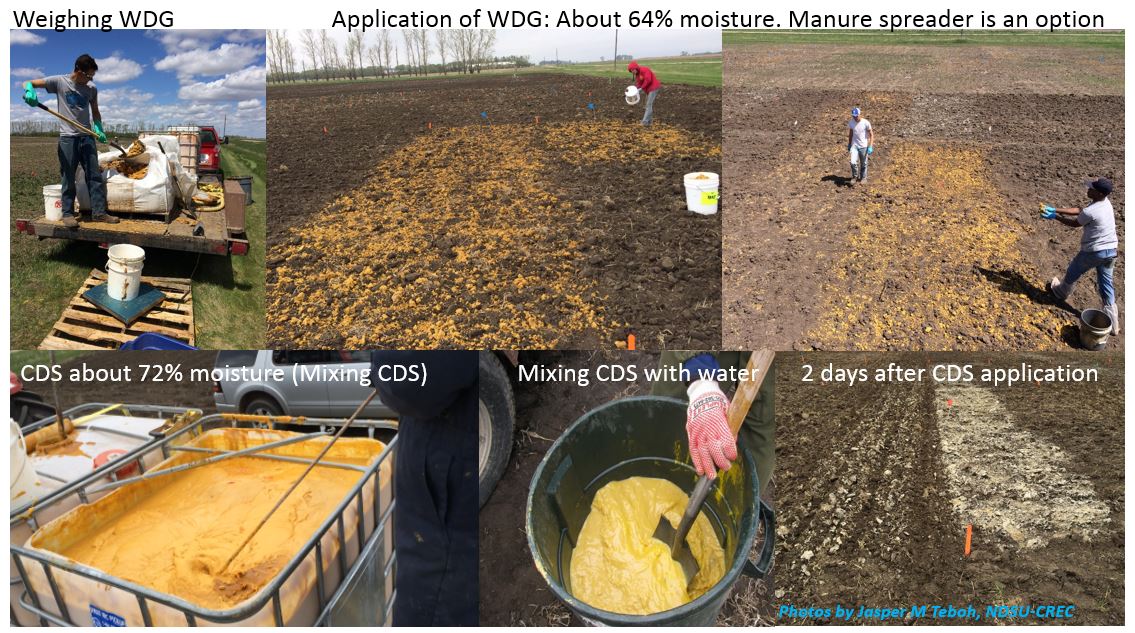
We conducted studies in Carrington (2015 and 2016) and Fairmount (2015), ND. We assessed the impact of CDS and WDG compared to triple super phosphate (TSP) fertilizer as sources of phosphorus (P), on grain yield and quality of corn (2015 and 2016) at rates of 0, 40, 80, 120 lbs P2O5/ac, and wheat (2016) at rates of 0, 40, 80 lbs P2O5/ac. Treatments were surface applied and incorporated. CDS was mixed with water to facilitate application. The check (0 lbs P) and TSP treatments received recommended N as urea.

Slides of weighing, applying, and mixing WDG

What Have We Learned?

In 2015, corn yields from CDS treatments were consistently greater than yields from WDG and TSP at each P level at Carrington. Corn did not respond to P application at Fairmount. In 2016, corn yields were significantly greater for WDG treatments than for CDS and TSP, which produced similar yields. Wheat yields and protein were also significantly higher for WDG compared to TSP. Therefore, CDS and WDG can be valuable sources of P and other nutrients for grain crops in North Dakota.

Future Plans

We will continue assessing the P fertilizer value of CDS and WDG for corn and wheat in 2017. A separate study will assess in-furrow treatments with CDS. Finally, we will assess soil residual effects from CDS and WDG application to soil on subsequent crops, as well as potential economic implications for farmers.

Authors

Jasper M Teboh, Research Soil Scientist, NDSU – Carrington Research Extension Center

Jasper.Teboh@ndsu.edu

Other Authors

Joel Ransom, Extension Agronomist – Cereal Crops, NDSU – Department of Plant Sciences

Szilvia Yuja, Research Soil Specialist, NDSU – Carrington Research Extension Center

J. Paulo Flores, Precision Ag Specialist, NDSU – Carrington Research Extension Center

Additional Information

Please contact me with questions at Jasper.Teboh@ndsu.edu or by phone at 701-652-2951 (Ext 109).

Results from this research were first presented at the ASA/SSSA/CSSA 2016 annual conference in Phoenix and is accessible at:

https://scisoc.confex.com/crops/2016am/webprogram/Paper100533.html

A summary of findings was later presented on the NDSU – Carrington REC blog at

https://www.ag.ndsu.edu/CarringtonREC/center-points/distillers-grains-impacted-yields-of-corn-and-spring-wheat-when-used-as-a-source-of-p

Acknowledgements

The authors are grateful to the North Dakota Corn Council, and North Dakota Agricultural Products Utilization Commission for funding the corn and wheat projects, respectively. Our gratitude also to Tharaldson Ethanol (Casselton, ND) especially Mr. Keith Finney and Mr. Brad Kjar; Mr. Greg LaPlante, Mr. Chad Deplazes (Research Specialist at NDSU), CREC technicians, staff, and students for field support.

The authors are solely responsible for the content of these proceedings. The technical information does not necessarily reflect the official position of the sponsoring agencies or institutions represented by planning committee members, and inclusion and distribution herein does not constitute an endorsement of views expressed by the same. Printed materials included herein are not refereed publications. Citations should appear as follows. EXAMPLE: Authors. 2017. Title of presentation. Waste to Worth: Spreading Science and Solutions. Cary, NC. April 18-21, 2017. URL of this page. Accessed on: today’s date.

Mobile Struvite System for Nutrient Extraction from Dairy Manure


Proceedings Home W2W Home w2w17 logo

Purpose            

Use of dairy manure as the sole source of nitrogen can lead to increased amounts of P in soil. In addition, P reserves around the world are finite and technologies are needed to effectively capture excess P in manure for the purpose of recycling to areas and crops in need of P.

What did we do?          

During the past decade we have adapted a fluidized bed technology to effectively recover P from liquid dairy manure in the form of struvite (magnesium mono-ammonium phosphate). A starter amount of struvite is placed at the bottom of an inverted cone that forms the fluidized bed for producing additional struvite. Manure that has been pre-treated is pumped up through the bottom of the cone to create the swirling action of the fluidized bed. To effectively form struvite, P in manure has to be dissociated from Ca, before subsequently binding with Mg and NH3. The fluidized bed technology was originally demonstrated with swine manure which is relatively lower in Ca compared to dairy manure. Due to the greater content of Ca in dairy manure we determined that it was necessary to lower the pH in dairy manure so that P could be free of Ca and available to form struvite. The pH has been most successfully lowered with use of sulfuric acid. As the low-pH manure is pumped up through the cone, ammonia is injected into the bottom of the cone to raise the pH and promote formation of struvite. The struvite we produced has been used as an effective fertilizer for growth of triticale, oats, corn silage and alfalfa. 

Picture of fluidized bed technology

What have we learned?            

Agriculture and human waste water industries have shown interest in this technology for the capture of P. The technology has been demonstrated as stationary units at three dairies, and has also been adopted by the human waste water plants. Phosphorus removal from dairy manure has been greater than 50%. Greenhouse and field plot studies compared struvite to mon-ammonium phosphate (MAP) and results indicated that struvite was comparable or superior compared to MAP in acidic soils and inferior to MAP in alkaline soils.

Future Plans    

Our current project will involve the demonstration of a mobile system that can be easily transported from dairy to dairy on a 24 foot trailer. Struvite that is captured from each dairy will be used in agronomic studies to promote a nutrient recycling relationship.

Corresponding author, title, and affiliation        

Joe Harrison, Professor, Washington State University

Corresponding author email    

jhharrison@wsu.edu

Other authors   

Keith Bowers and Elizabeth Whitefield

Additional information              

http://www.puyallup.wsu.edu/dairy/nutrient-management/default.asp

Acknowledgements       

This project is funded USDA NRCS CIG #69-3A75-17-51.

Removing Phosphorus from Drainage Water: The Phosphorus Removal Structure

Purpose

To illustrate a case study design and construction of a phosphorus removal structure on a poultry farm, and to present the basics of how to properly design a structure.

What did we do?

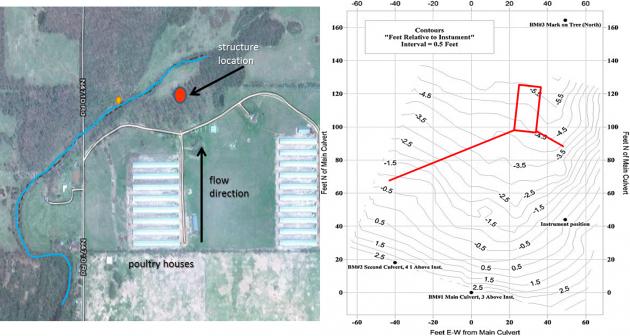
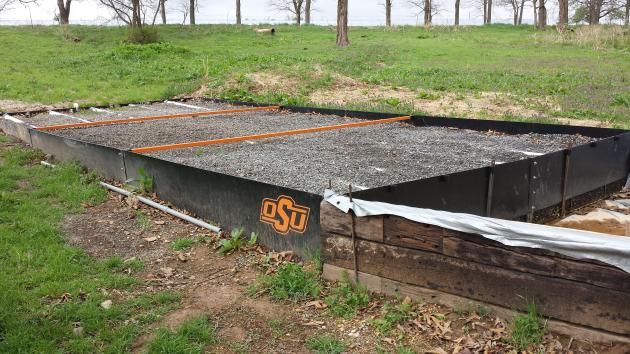
We constructed a phosphorus (P) removal structure on a poultry farm in Eastern OK; this is a BMP that can remove dissolved P loading in the short term until soil legacy P concentrations decrease below levels of environmental concern. A P removal structure contains P sorbing materials (PSMs) and are placed in a location to intercept runoff or subsurface drainage with high dissolved P concentrations. As high P water flows through the PSMs, dissolved P is sorbed onto the materials by several potential mechanisms, allowing low P water to exit the structure. While they vary in form, P removal structures contain three main elements: 1) use of a filter material that has a high affinity for P, 2) containment of the material, and 3) the ability to remove that material and replace it after it becomes saturated with P and is no longer effective.

A site was identified which met all criteria for justification of construction of a P removal structure: 1) elevated dissolved P concentrations in runoff (>0.2 ppm), 2) hydraulic connectivity between the runoff/drainage produced and a surface water body, and 3) flow convergence: the site possessed potential to channel the runoff water to a single point in order to treat the water. This site was located on a poultry farm in Eastern OK.
The site was surveyed in order to obtain the necessary inputs for properly designing the P removal structure. This involved a basic NRCS survey to estimate watershed size, peak flow rates, and average annual runoff volume. In addition, several runoff grab samples were taken and analyzed for dissolved P. This information was used to determine the average annual dissolved P load, which was 45 lbs.

Knowing flow and P load parameters, we additionally chose P removal targets and desired lifetime of the structure. We chose to design a structure that would remove 20 lbs of dissolved P during the first year and be able to handle 700arial site view and map gpm flow rate. Several hypothetical designs were made based on the available P sorbing materials (PSMs), such as drinking water treatment residuals, acid mine residuals, and gypsum. We chose to use a treated steel slag material as the PSM in the structure; this required about 35 tons of material.
After construction, the performance of the structure was monitored by measuring flow rates and dissolved P concentrations at the inlet and outlet. In addition, we developed software to aid in proper design of a site specific P removal structure using any PSM, in order to meet desired P removal goals and lifetime. Alternatively, this software can be used to predict the performance and lifetime of a P removal structure that has been already constructed. Licensing of software is available for private industry.

completed p removal structureWe constructed a P removal structure on a poultry farm in Eastern OK; this is a BMP that can remove dissolved P loading in the short term until soil legacy P concentrations decrease below levels of environmental concern. A P removal structure contains P sorbing materials (PSMs) and are placed in a location to intercept runoff or subsurface drainage with high dissolved P concentrations. As high P water flows through the PSMs, dissolved P is sorbed onto the materials by several potential mechanisms, allowing low P water to exit the structure. While they vary in form, P removal structures contain three main elements: 1) use of a filter material that has a high affinity for P, 2) containment of the material, and 3) the ability to remove that material and replace it after it becomes saturated with P and is no longer effective.
A site was identified which met all criteria for justification of construction of a P removal structure: 1) elevated dissolved P concentrations in runoff (>0.2 ppm), 2) hydraulic connectivity between the runoff/drainage produced and a surface water body, and 3) flow convergence: the site possessed potential to channel the runoff water to a single point in order to treat the water. This site was located on a poultry farm in Eastern OK.

The site was surveyed in order to obtain the necessary inputs for properly designing the P removal structure. This involved a basic NRCS survey to estimate watershed size, peak flow rates, and average annual runoff volume. In addition, several runoff grab samples were taken and analyzed for dissolved P. This information was used to determine the average annual dissolved P load, which was 45 lbs.

Knowing flow and P load parameters, we additionally chose P removal targets and desired lifetime of the structure. We chose to design a structure that would remove 20 lbs of dissolved P during the first year and be able to handle 700 gpm flow rate. Several hypothetical designs were made based on the available P sorbing materials (PSMs), such as drinking water treatment residuals, acid mine residuals, and gypsum. We chose to use a treated steel slag material as the PSM in the structure; this required about 35 tons of material.

After construction, the performance of the structure was monitored by measuring flow rates and dissolved P concentrations at the inlet and outlet. In addition, we developed software to aid in proper design of a site specific P removal structure using any PSM, in order to meet desired P removal goals and lifetime. Alternatively, this software can be used to predict the performance and lifetime of a P removal structure that has been already constructed. Licensing of software is available for private industry.

What have we learned?

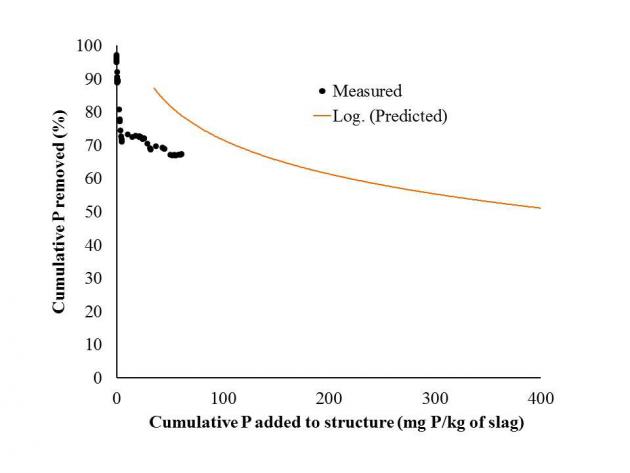
p removal performanceThe P removal structure has removed approximately 67% of all dissolved P that has flowed into it over a 16-month time period. In addition, it has handled all flow volume from every event, including a runoff event that resulted in 600 gpm. That single event delivered 2/3 lb of dissolved P, in which the structure removed 66%. While the structure is removing P as predicted based on P loading, the structure has greatly outlasted the goal of removing 45% of cumulative dissolved P in one year. This is due to the below average rainfall received over the last two years.

We also learned about the potential positives and negatives of using certain PSMs. For example, although we could have used other PSMs, in much smaller quantities (2-10 tons) that would remove equal amounts of P, we would have had to build a structure that was much larger in surface area, due to the fact that the hydraulic conductivity of these PSMs is relatively low. It is also possible to build these structures with other materials for the frame, such as concrete, earth, or wood. Structures can be constructed in ditches or potentially in the subsurface to treat tile drainage.

Last, we have some sense of economics for P removal structures and the general cost of P removal compared to other BMPs.

Future Plans

phrog design softwareWe will continue to monitor the structure. In addition, we are cooperating with several people throughout the US in helping to design P removal structures. We are also releasing design software for licensing in an attempt to promote commercialization of this BMP through private industry. A NRCS standard is currently underway and the goal is for this BMP to become cost-shared. Last, we are continuing to investigate the economics of P removal structure over a large scale area.

Authors

Chad Penn, Associate professor of agricultural and environmental chemistry, Oklahoma State University chad.penn@okstate.edu

Josh Payne, Animal waste specialist, Oklahoma State University; James Bowen, graduate assistant; Stuart Wilson, senior research specialist, Oklahoma State University; Josh McGrath, associate professor of nutrient management, University of Kentucky

Additional information

Chad Penn; chad.penn@okstate.edu; 405 744 2746

www.p-structure.blogspot.com

http://www.jswconline.org/content/69/2/51A.full.pdf

http://pods.dasnr.okstate.edu/docushare/dsweb/Get/Document-9345/L-447%20Phosphorus%20Removal.pdf

Acknowledgements

NRCS for funding of this demonstration

The authors are solely responsible for the content of these proceedings. The technical information does not necessarily reflect the official position of the sponsoring agencies or institutions represented by planning committee members, and inclusion and distribution herein does not constitute an endorsement of views expressed by the same. Printed materials included herein are not refereed publications. Citations should appear as follows. EXAMPLE: Authors. 2015. Title of presentation. Waste to Worth: Spreading Science and Solutions. Seattle, WA. March 31-April 3, 2015. URL of this page. Accessed on: today’s date.

The North American Partnership for Phosphorus Sustainability: Creating a Circular P Economy as Part of a Sustainable Food System


Purpose           

To promote and foster the implementation of sustainable P solutions in both the private and public sectors

People standing in the formation of a 'P'What did we do? 

Recently, a team of Phosphorus researchers initiated the North American Partnership for Phosphorus Sustainability (NAPPS) with seed funding from Arizona State University. The goal of North American Partnership for Phosphorus Sustainability (NAPPS) is to actively engage stakeholders (e.g. corporations, national and local policy makers, planners and officials, representatives of agriculture, industry) to promote and foster the implementation of sustainable P solutions in both the private and public sectors. NAPPS seeks to engage partners in identifying key bottlenecks and strategies for decision-making, policy, and implementation of P efficiency and recycling technologies.

What have we learned? 

Phosphorus is necessary for life, and is essential for agricultural production, and so for food security. The growing world population, changing diets of humans to more meat and dairy and growing use of phosphate additives, and biomass production for energy or industrial uses result in an increasing need for phosphorus input, and the world is today heavily dependent on non-renewable, finite phosphate rock reserves that which are concentrated in a small number of countries, posing geopolitical vulnerability. These trends lead to the depletion of phosphate rock resources, pressure on and instability in phosphate prices, decreasing quality and increasing contaminant loads of remaining reserves, and unstable, insecure P supply for regions without local rock resources, especially in the developing world. At the same time, excess P is lost from the food system at multiple points. The result is eutrophication of freshwater and coastal ecosystems – lo ss of the amenity value of lakes and rivers as well as toxic algal blooms and impacts on fisheries.

Phosphorus stewardship is therefore essential, and we must use P more efficiently in the agri-food system, and actively develop phosphorus reuse and recycling technologies and practices. At the same time, the issue of contaminants, both in phosphate rock and in recycled phosphates must be addressed, as well as the need to reduce phosphate inputs to surface waters where these are problematic. We can reduce the use of mined P by producing and applying fertilizer from recycled sources. By using improved practices and smarter crops, we can reduce the demand for P fertilizer and reduce the runoff to surface water bodies. By reducing and re-using food waste and eating food with lower P footprints we can lower our phosphorus consumption and demand. Collectively, these will also lessen the impacts of P runoff on precious water resources.

Future Plans 

NAPPS activities and stakeholder recruitment will be organized around four main sectors: P Recycling; P Efficiency in Food Production; BioEnergy and Food Choice; and Water Quality. Projects and activities will be decided by the Board of Directors, but may include:

1. Develop a common vision for creating a sustainable P cycle in North America

2. Identifying and helping businesses and other organizations respond to opportunities offered by challenges in P management and emerging research in P sustainability

3. Building networks between different interest groups and sectors related to phosphorus management and recycling

4. Evaluating new P efficiency and recycling technologies, including feasibility, availability of suppliers, inventory of existing technologies and companies, cost/benefit analysis, and life cycle analyses

5. Fostering implementation of new technologies by improving the efficiency of business value chains

6. Assessing and facilitating regulatory development pertaining to phosphorus management, including waste, environmental, discharge, and agriculture to improve P sustainability

7. Representing North American phosphorus managers and innovators in international meetings and initiatives

8. Preparing funding RFPs for demonstration projects and integration and dissemination of new technologies and concepts

Authors

Helen Ivy Rowe, Assistant Research Professor, School of LIfe Sciences, Arizona State University hirowe@asu.edu

James J. Elser, Regents Professor, School of LIfe Sciences, Arizona State University

Additional information                

http://sustainablep.asu.edu

Acknowledgements      

We thank Arizona State University for providing funds to launch this initiative.


Logo for Sustainable Phosphorus Initiative

The Sustainable Phosphorus Initiative - farm, food, fertilizer

The authors are solely responsible for the content of these proceedings. The technical information does not necessarily reflect the official position of the sponsoring agencies or institutions represented by planning committee members, and inclusion and distribution herein does not constitute an endorsement of views expressed by the same. Printed materials included herein are not refereed publications. Citations should appear as follows. EXAMPLE: Authors. 2015. Title of presentation. Waste to Worth: Spreading Science and Solutions. Seattle, WA. March 31-April 3, 2015. URL of this page. Accessed on: today’s date.

Nutrient Recovery Technologies—A Primer on Available and Emerging Nitrogen, Phosphorus, and Salt Recovery Approaches, their Performance and Cost


Purpose

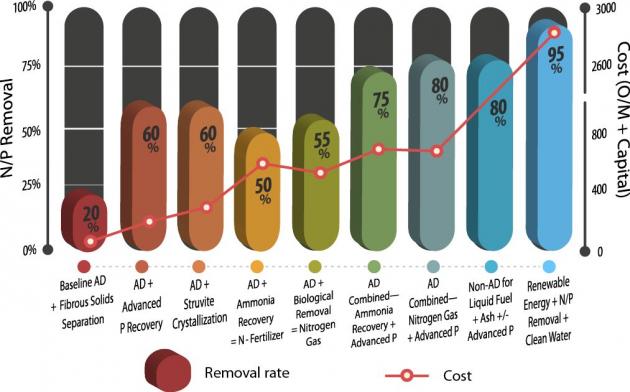
This presentation highlights existing and emerging recovery technologies that can be combined with energy recovery from dairy manure. A variety of technologies is in development, specifically tailored for solids, phosphorus, nitrogen, salt and combinations thereof. Data regarding estimated performance and cost as well as summary graphs are presented. Attention is focused on in-series treatment with anaerobic digesters, but mention is given to incorporation with other renewable energy/fuel technologies.

What did we do?

The presentation focused on information from pilot and commercial demonstration of nutrient recovery (NR) technologies, with sources including literature, pilot reports, company literature, project feasibility studies, and interviews. This presentation attempts to identify broad approaches, identify strengths and weaknesses of those approaches, as well as specific situations where each might be most appropriate. Individual case studies have been included so as to offer more detailed information about representative technologies.

What have we learned?

This presentation estimated a range of performance and cost achievements for each of these broad approaches to NR. Ranges are not necessarily indicative of individual technologies but rather represent an approximate average based on best available data in conjunction with some assumptions. Several factors made these performance and cost estimates challenging. In some cases, technologies are already operating in the dairy sector at commercial scale. In many cases, technologies are operating at a pre-commercial scale, or are used commercially in other sectors such as wastewater treatment facilities. This required assumptions to be made based on informed estimates. Also, because technologies are often applied within a single manure management system, it is clear that costs would vary significantly if applied in other situations. For example, an NR technology that operates well on dilute flush manure would likely require pretreatment at additional cost if applied to scraped manure. Finally, limited data were available, particularly in regard to costs. This is mostly due to proprietary concerns or unwillingness to cite specific costs due to rapidly changing technologies. These factors mean that performance and cost ranges should be viewed as “best estimates” based on the data currently available to researchers. It is meant to provide a broad view of the industry as a whole, and should not be used for individual technology purchase or investment decisions.

Report Conclusion

Future Plans

There are many other factors that will be important in developing the path forward for the dairy industry with respect to nutrient recovery, form and function of recovered nutrient products for example. Ongoing development of dairy NR technologies should therefore aim to develop products that fit seamlessly into existing fertilizer delivery systems while providing a form that meets transportation and market needs, at price points that are competitive with synthetic fertilizers. Development within such a competitive environment requires not only a sustained effort, but also national and capable partners, a lesson that has been identified during development of a market for high-value peat moss replacement from AD.

A look at the bigger picture, using analytical tools such as life cycle analysis, is also important. Comparison of the performance capabilities and costs of these two approaches are one point of comparison, but a more in-depth comparison may also include consideration of resource management and sustainability, including features such as energy balance, greenhouse gases, and eco-system benefits.

Authors

Jingwei Ma, Research associate at Washington State University mjw@wsu.edu

Craig Frear, Assistant Professor at Washington State University, Georgine Yorgey, Research associate at Washington State University, Chad Kruger, Director at Washington State University Center for Sustaining Agriculture & Natural Resources (CSANR)

Additional information

http://csanr.wsu.edu/wp-content/uploads/2014/07/ICUSD-Emerging-NR-Technology-Report-Final.121113B.pdf

Acknowledgements

This research was supported by funding from USDA National Institute of Food and Agriculture, Contract #2012-6800219814; National Resources Conservation Service, Conservation Innovation Grants #69-3A75-10-152; Biomass Research Funds from the WSU Agricultural Research Center; the Washington State Department of Ecology, Waste 2 Resources Program; US Environmental Protection Agency Grant # RD-83556701; and the Water Environment Research Foundation.

The authors are solely responsible for the content of these proceedings. The technical information does not necessarily reflect the official position of the sponsoring agencies or institutions represented by planning committee members, and inclusion and distribution herein does not constitute an endorsement of views expressed by the same. Printed materials included herein are not refereed publications. Citations should appear as follows. EXAMPLE: Authors. 2015. Title of presentation. Waste to Worth: Spreading Science and Solutions. Seattle, WA. March 31-April 3, 2015. URL of this page. Accessed on: today’s date.

Nutrient Management Planners’ Feedback on New York and Pennsylvania Phosphorus Indices

Purpose 

The Phosphorus Index (PI) estimates the relative risk of P loss from agricultural fields and encourages the implementation of best management practices to reduce this risk. A majority of states designed their own PI version to address local conditions and priorities, resulting in a large variation in PI structures among states. Currently, multiple projects nationwide are evaluating if the different PIs are directionally and magnitudinally correct in ranking fields based in their potential for P loss. In the Chesapeake Bay, New York (NY), Pennsylvania (PA), Delaware (DE), Maryland (MD), Virginia (VA), and West Virginia (WV) are working cooperatively to fulfill this objective. Several approaches have been proposed to determine the effectiveness of the various PIs. The following results summarize one approach: a survey of certified nutrient management (CNMP) planners with questions specifically related to their perspectives on the NY and PA PIs. This approach recognizes that planners have experience with the PI and have a close knowledge of the landscape scenarios and management that have previously resulted in water quality violations.

What did we do? 

A total of 36 CNMP planners were surveyed in NY in the winter of 2013-2014. The survey included questions about (1) the relative importance of the different factors in the current PI; (2) the main reasons for water-quality violations; (3) the management practices the PI should encourage and discourage, (4) the use of a screening tool to identify fields that need and do not need a PI assessment; and (5) the PI assessment across and within geographic regions.

In PA, a survey structure and question content similar to NY was used to ensure comparability of results. Certified private and public nutrient management (NM) specialists as well as other members of the PA NM community received the survey in the spring of 2014.

What have we learned? 

All source and transport factors included in the NY PI were considered important by the CNMP planners. More than half of the planners indicated that the water quality violations were mainly driven by manure applications (1) just before snow melt or rainfall events, (2) on frozen or saturated soils, (3) too close to streams or ditches, or (4) without incorporation. Many nutrient management planners suggested that the PI should incentivize manure incorporation, implementation of cover crops, setbacks and buffers, and preferential manure applications to fields without connectivity. A high percentage of planners also suggested that the PI should discourage manure applications to saturated or frozen soils, to fields close to streams, to fields with steep slopes, manure spreading without incorporation, and high manure rates. Several CNMP planners in NY indicated the weighting of factors in the NY PI should be reevaluated, in particular, the timing of manure application. Some planners proposed to use real weather data to fine-tune the timing of manure application, while others suggested replacing the calendar year as a driver for PI weights by field conditions. Most of the CNMP planners in NY (1) did not support including a screening tool to quickly identify fields of no P runoff risk in the revised PI,(2) supported a physiographic-based PI (NY plus Northern PA), and (3) did not support multiple PIs within the NY. Some planners also raised concerns about the lack of systematic assessment of water quality, and the attempt to numerically predict P loss as opposed to predict the relative risk of P applications.

Overall, responding NM specialists indicated a need to revise the PA PI and favored the continued use of a screening tool. State boundary was the preferred regional basis for revising and implementing the PA PI, but some respondents showed support for using physiographic region. Current, PA PI source and transport factors were considered important and reliable in assessing fields for vulnerability to P loss. However, many NM Specialists recognized other potential PA PI factors such as flooding frequency, concentrated flow, leaching potential, and degree of soil P saturation as important for consideration in revising the PA PI. Based on their experience, respondents reported water quality violations typically resulted from manure spills, manure discharge events, and erosions events. Management practices to be encouraged by the PA PI include buffers, cover crops, and erosion control practices such as no tillage. In turn, management practices to be discouraged by the PA PI include winter manure application and manure application to land without suitable cover.

Future Plans 

The management practices identified by CNMP planners will be evaluated in the revised version of the NY PI.

The information obtained from the PA survey will be considered in the PA PI revision process. Similarities in responses between PA and NY especially with respect to practices to be encouraged or discouraged by the PI demonstrate the need for continued cooperative regional work and PI evaluation.

Authors

Quirine M. Ketterings, Professor, Cornell University qmk2@cornell.edu

Sebastian Cela, Postdoctoral Associate Cornell Univ.,Karl J. Czymmek, Senior Extension Associate Cornell Univ., Jennifer Weld, Graduate Student Penn State, Douglas Beegle, Distinguished Professor Penn State, Peter Kleinman, Research Leader USDA-ARS PSWMRU

Additional information 

For additional information, contact Quirine M. Kettertings at qmk2@cornell.edu

Acknowledgements

This project is funded by a USDA-NRCS CIG Grant.

The authors are solely responsible for the content of these proceedings. The technical information does not necessarily reflect the official position of the sponsoring agencies or institutions represented by planning committee members, and inclusion and distribution herein does not constitute an endorsement of views expressed by the same. Printed materials included herein are not refereed publications. Citations should appear as follows. EXAMPLE: Authors. 2015. Title of presentation. Waste to Worth: Spreading Science and Solutions. Seattle, WA. March 31-April 3, 2015. URL of this page. Accessed on: today’s date.

A Novel Treatment System to Remove Phosphorus from Liquid Wastes

Lowering the total phosphorus (P) content of animal manures is one means of addressing concerns over P runoff following land application of animal manure. We developed a treatment system for liquid manures that conserves the manure nitrogen (N) content while removing most of the manure P content. Initial evaluation of a treatment system involving manure solid separation and precipitation of dissolved P with an alkaline salt (calcium hydroxide) resulted in poor liquid/solid separation and poor dissolved P removal and created conditions promoting ammonia-N volatilization. As a result, we developed a three step system with iterative solid removal and acid salt (ferric sulfate) precipitation of dissolved P: (1) removal of bulk and intermediate sized solids (>25 μm); (2) chemical treatment to convert dissolved P; and (3) final removal of fine solids and chemically precipitated P. When tested on manure slurries from 150 and 2700 cow dairies, 96 and 99% total P was removed respectively, resulting in liquid manure filtrates with up to 400:1 N:P ratio. While costs of treatment were roughly $38 per kg P removed, equivalent to $750 per cow annually, we anticipate that refinement of the process and beneficial uses of the solid materials (bedding, compost, etc.) will improve cost-efficacy considerably.

Author

Church,  Clinton  Clinton.Church@ars.usda.gov     USDA-ARS 

The authors are solely responsible for the content of these proceedings. The technical information does not necessarily reflect the official position of the sponsoring agencies or institutions represented by planning committee members, and inclusion and distribution herein does not constitute an endorsement of views expressed by the same. Printed materials included herein are not refereed publications. Citations should appear as follows. EXAMPLE: Authors. 2015. Title of presentation. Waste to Worth: Spreading Science and Solutions. Seattle, WA. March 31-April 3, 2015. URL of this page. Accessed on: today’s date.

Analysis of total Carbon, Nitrogen, and Phosphorus Contents in Soil Cores Over 10+ Years from Horicon Marsh in Dodge County, Wisconsin


Why Look at Marsh Soil Nutrients?

The purpose of this project was to evaluate changes in carbon (C), nitrogen (N), and phosphorus (P) in samples from identical locations taken ten years apart from Horicon Marsh in Dodge County, Wisconsin.

The area surrounding the marsh is primarily agricultural and has the potential to contribute nutrients to the marsh, affecting the fertility of the soils and changing the ecosystem.

What did we do?  

We hypothesized that carbon, nitrogen, and phosphorus would show significant increases over the ten-year interval between samplings.

Sample sites were positioned every ¼ mile along east-west transects throughout the marsh. A soil core was obtained at each sample site in the winter of either 2002 or 2003. The same sites were revisited and new samples collected in winter of either 2012 or 2013, ten years after the initial visits. The top five centimeters of each soil core were oven dried at 105°C for 72 hours.

Total carbon and nitrogen were analyzed by combustion using a PerkinElmer 2400 series II CHNS/O Analyzer. Total phosphorus was analyzed by the Olsen P-extraction method on a QuikChem FIA+ 8000 series Lachat analyzer.

A paired t-test (α=0.05) was used to compare nitrogen and phosphorus values. Carbon data were compared with a Mann-Whitney ranked sum test at the 95% confidence interval.

What have we learned?  

Carbon and nitrogen did not increase significantly over the time period. Carbon is generally bound in soil organic matter; in histic wetland soils, changes attributable to land use might be difficult to detect due to the already high organic matter content. Nitrogen accumulation was likely mitigated by denitrification processes.

Phosphorus concentrations were greater in the second set of samples. Phosphorus adsorbs tightly to sediment and organic material, which would prevent its removal by flowing water. Changes in land use, especially row crop agriculture in the Horicon marsh area, could contribute runoff inputs of soil particles carrying phosphorus with them. This may explain significantly increased phosphorus levels between the start and end of the study period.

Future Plans  

Future studies might quantify land use changes, their extent, and their impacts on the marsh ecosystem; analyze spatial patterns of phosphorus accretion to determine if it is cycling equally throughout the marsh; and determine the impact of denitrifying bacteria and anaerobic conditions on nitrogen accumulation. Additional research could include testing the water column of the marsh for dissolved nutrients; and sampling the Rock River at its inlet to and outlet from the Horicon Marsh to determine nutrient flux to the stream from the marsh.

Authors

Ashley Hansen, University of Wisconsin-Stevens Point ashleyhansen891@gmail.com

Anna Radke, University of Wisconsin-Stevens Point; Sarah Shawver, University of Wisconsin-Stevens Point

Additional information

Ashley Hansen, ahans891@uwsp.edu; Anna Radke, aradk591@uwsp.edu; Sarah Shawver, sshaw497@uwsp.edu

Acknowledgements

Dr. Robert Michitsch

Soils Professor and Research Advisor

Dr. Kyle Herrman

Water Resource Professor and Research Advisor

The authors are solely responsible for the content of these proceedings. The technical information does not necessarily reflect the official position of the sponsoring agencies or institutions represented by planning committee members, and inclusion and distribution herein does not constitute an endorsement of views expressed by the same. Printed materials included herein are not refereed publications. Citations should appear as follows. EXAMPLE: Authors. 2015. Title of presentation. Waste to Worth: Spreading Science and Solutions. Seattle, WA. March 31-April 3, 2015. URL of this page. Accessed on: today’s date.