
Purpose
Each farm uniquely contributes toward collective water quality passing through and leaving their neighborhood. University of Wisconsin – Discovery Farms research shows that critical sites, critical times, and critical conditions play a major role in loss of sediment and nutrients from farmland. Critical site losses can contribute the majority of whole farm annual sediment and nutrient loss, and very often, single-large event storms can be the source of almost all loss from a farm in any given year. Identifying critical areas, and how they are being managed, is step one toward maintaining soil productivity and minimizing sediment and nutrient loss within agricultural watersheds.
To understand and reduce agriculture’s environmental footprint, there needs to be accurate documentation of what’s currently happening on the land and how the current farming system is impacting water quality. UW – Discovery Farms has been working with farmers to conduct whole farm walkovers to document and better understand the effectiveness of their farming system toward minimizing sediment and nutrient loss from cropland.
 What we did
The UW – Discovery Farms Program and Yahara Pride Farms, a non-profit organization dedicated to improving water quality of the Yahara River watershed in south central, Wisconsin, have worked with more than 60 farmers in three Wisconsin watersheds to conduct whole farm walkovers (2012-2014). This process helped prioritize soil and water management on individual farms by raising awareness of critical site locations and what their current condition is. On a watershed scale, whole farm walkovers also help to evaluate watershed resource conditions at a particular point in time.
Whole farm walkovers evaluated cropland and other farmland areas, identifying critical sites where significant loss of sediment and/or nutrients either could occur, or was actively occurring. This concept is producer derived and producer desired, and was not meant to take the place of agency plans.
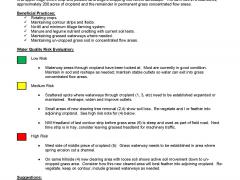
 A simple “stop-light” scoring process was used to attach qualitative scores to critical sites that posed risk for sediment or nutrient loss as follows: 1) Green – areas with excellent or very good management (no changes required); 2) Yellow – areas that need some improvement over a period of 1 – 5 years; and 3) Red – areas that need improvement within the next 12 -18 months.
Walkovers were summarized into two-page color-coded text and map documents (Fig. 1 and 2). This information identified the risk of sediment or nutrient loss with a rank based on the green-yellow-red criteria. It also documented practices that farmers were currently using that protect water quality. This information was shared with each farmer to ensure that the evaluation identified all of the critical areas on their farm. Areas that need improvement were discussed and strategies developed to secure additional assistance where necessary.
What we learned
This concept is producer derived and producer desired. Farmer feedback has helped improve the deliverables and keep the process practical. Farmers have welcomed staff to walk their land and consult back with an honest discussion, helping them understand critical sites they manage. Many “yellow and red” areas identified within cropland were corrected even before staff could return to the farm with summarized information. This validates the importance of 1:1 on-farm interactions and the value farmers attached to the walkover process. Whole farm walkovers have helped farmers begin planning repairs to actively contributing critical sites, and consider land management changes to minimize sediment and nutrient loss from their property.
Results from two different watersheds show approximately 75% of farmland is being managed very well, with minimal risk of losing sediment or nutrients; 20% needs some attention and conservation repair; and approximately 2% was showing significant risk, with most of that existing outside of cropland areas. The general breakdown is similar between the two watersheds, with differences in the details and kind of yellow and red critical areas, reflecting local landscapes and farming systems. A summary follows:
Watershed DR had 9,923 acres of farmland evaluated for 27 farmers on 85 tracts of land. A total of 250 critical areas were identified in this glaciated, long sloped landscape influenced by corn-soybean crop rotations and a small number of active dairy farms, with breakout as follows:
- (78%) green;
- (20%) yellow – most categorized as concentrated water flow areas. Other “yellows” included stream corridor, livestock areas, un-cropped upland areas, and manure piles;
- (< 2%) red – all categorized within stream corridors.
Watershed JV had 4,816 acres of farmland evaluated for 33 farmers on 54 tracts of land. A total of 599 critical areas were identified in this unglaciated, steeper sloped landscape influenced by dairy / forage based farming systems, with breakout as follows:
- (76%) green;
- (21%) yellow – most categorized as concentrated water flow areas. Other “yellows” included entry from cropland concentrated flow into non-cropland, un-cropped upland areas, livestock areas, and stream corridor;
- (2.5 %) red – most categorized as un-cropped upland. Other “reds” included concentrated flow areas, and livestock areas.
Future plans
We will teach this process to crop consultants, farmer groups, soil and water conservation professionals, and farmers to empower them with a proactive way to identify local critical sites and respond by choosing practical soil, water and nutrient management practices that work within their regional neighborhood and within their chosen farming systems.
Authors
Kevan Klingberg, and Todd Prill
Outreach Specialist, kevan.klingberg@ces.uwex.edu, and Watershed Coordinator, discovery.farms.prill@gmail.com, respectively, University of Wisconsin –Extension, Discovery Farms Program, PO Box 429, Pigeon Falls, WI, 54760, www.uwdiscoveryfarms.org.
Additional Information
http://www.uwdiscoveryfarms.org
The authors are solely responsible for the content of these proceedings. The technical information does not necessarily reflect the official position of the sponsoring agencies or institutions represented by planning committee members, and inclusion and distribution herein does not constitute an endorsement of views expressed by the same. Printed materials included herein are not refereed publications. Citations should appear as follows. EXAMPLE: Authors. 2015. Title of presentation. Waste to Worth: Spreading Science and Solutions. Seattle, WA. March 31-April 3, 2015. URL of this page. Accessed on: today’s date.