Food retailers and consumers worldwide are pressuring producers to reduce the use of fossil fuels and the carbon footprint of swine production systems. The primary objective of this study was to evaluate a solar-powered system designed to cool sows that might reduce the use of fossil fuels in farrowing rooms and improve performance of lactating sows.
What did we do?
Two mirror-image, farrowing rooms equipped with 16 farrowing stalls each were used for this study. Each farrowing stall in the COOL room was equipped with a cooled flooring insert (Cool Sow, Nooyen Manufacturing) under the sow and a single nipple drinker delivering chilled drinking water. Circulating water cooled by a water-source heat pump powered by a 20 kW photovoltaic solar array cooled the floor inserts (60 to 65 °F) and chilled the drinking water (55 to 60 °F). Warm water (110 to 119 °F) was circulated through pads in the piglet creep area. The CONTROL room was nearly identical to the COOL room except there was no cooling of floor inserts or drinking water and supplemental heat for piglets was provided by one heat lamp (125 W) per farrowing stall (Group 1) or an electric heating pad (Hog Hearth, Innovative Heating Technologies; Group 2). Groups (n = 28 CONTROL sows and 28 COOL sows) were studied during summer months and room heaters were operated to keep rooms above 75 °F to ensure sows were heat stressed. Electric consumption for all systems (ventilation, piglet heating, lights, and cooling system) was measured and performance of sows and piglets were recorded over lactation.
What have we learned?
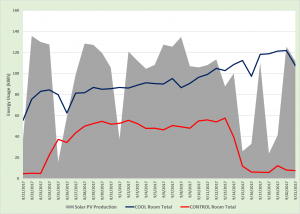
The COOL room consistently used more electricity than the CONTROL room (Figures 1 and 2). For Group 1, the COOL room used 93.0 kWh/day while the CONTROL room used 35.3 kWh/day. Similarly in Group 2, the COOL and CONTROL rooms required 71.5 and 19.7 kWh/day, respectively. Production of electricity from the solar panels totaled 95.3 and 86.7 kWh/day, respectively. Sows housed in the COOL room were more comfortable as indicated by a lower respiration rate (64.4 vs 96.8 breaths/min; P < 0.01), higher feed intake (11.39 vs 9.25 lb/d; P < 0.01) and reduced lactation body weight loss (35.1 vs. 54.2 lbs; P < 0.06) compared with sows housed in the CONTROL room. Litter size at birth and weaning as well as piglet weaning weights were not different across rooms.
The cooling systems (cooled floor and cooled drinking water) and piglet heating systems studied effectively mitigated heat stress of lactating sows but did not enhance pig performance. Furthermore, these systems required over 2.5 times more total electrical energy than a traditional lactation housing system without sow cooling.
Future Plans:
Effects of cooled floors and cooled drinking water were confounded in this study. Cooled floors are expensive and difficult to install in existing facilities. The effects of cooled drinking water will be assessed independent of cooled floors in future studies. Cooled drinking water will be easier to install in existing barns. Future analyses will consider the economic feasibility of various components of the sow cooling and piglet heating systems.
Corresponding authors, titles, and affiliations:
B. M. Lozinski1, M. Reese1, E. Buchanan1, A. M. Hilbrands1, K. A. Janni2, E. Cortus2, B. Hetchler2, J. Tallaksen1, Y. Li1, and L. J. Johnston1
1West Central Research and Outreach Center, University of Minnesota, Morris, and
2Department of Biosystems and Biological Engineering, University of Minnesota, St. Paul
Acknowledgements:
The authors would like to express gratitude to the Minnesota Environment and Natural Resources Trust Fund for their financial support of this project.


The authors are solely responsible for the content of these proceedings. The technical information does not necessarily reflect the official position of the sponsoring agencies or institutions represented by planning committee members, and inclusion and distribution herein does not constitute an endorsement of views expressed by the same. Printed materials included herein are not refereed publications. Citations should appear as follows. EXAMPLE: Authors. 2019. Title of presentation. Waste to Worth. Minneapolis, MN. April 22-26, 2019. URL of this page. Accessed on: today’s date.

