
Minnesota’s Runoff Risk Advisory Forecast: Forecasting the optimal time for manure application

The Runoff Risk project was started in Wisconsin in 2011, with the realization at that time, there was no real-time runoff risk guidance available for manure applicators. The project has grown, with four states (Michigan, Minnesota, Ohio and Wisconsin) now operating real-time runoff risk forecast websites.
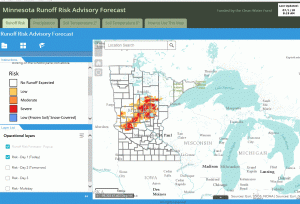
screenshot of Minnesota runoff risk advisory forecast
Figure 1. Minnesota Runoff Risk Advisory Forecast from July 1, 2018.

The Minnesota Runoff Risk Advisory Forecast (RRAF) system is a tool developed by the Minnesota Department of Agriculture (MDA) and the National Weather Service (NWS). It is designed to help farmers and commercial applicators determine the best time to apply manure to reduce the runoff risk of valuable nutrients and protect water resources. It is part of a regional risk advisory forecast project that utilizes existing NWS weather and watershed models in a water quality application. Figure 1 shows a screenshot of the website from July 1, 2018, indicating the runoff risk forecast in the central part of the state.

Runoff Risk Analysis

The NWS models continuously simulate soil moisture and temperature conditions as well as incorporating future precipitation and temperature forecasts and current and future snowpack. An algorithm that looks at chosen model state values is evaluated for a variety of risk conditions, such as runoff and soil saturation. Based on over 20 years of simulations, basin specific thresholds were created. Finally, there was post–processing of that data that is run on the output to produce risk events. This information is provided daily to the project partners through data servers. The data is processed and the website is updated twice daily. The graphic displays the different risk events predicting the likelihood of today (Day 1), tomorrow (Day 2), and Day 3 or multi-day (Day 1 through Day 3 combined) runoff events. Farmers and commercial applicators use an interactive map to locate their field and find their forecasted risk. Users can also sign up for email or text messages for their county that alert them to a severe runoff risk for that day.
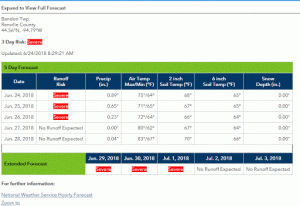
screenshot of tabular format risk advisory forecast
Figure 2. Tabular 5 day forecast from June 24, 2019 in Bandon Township, Renville County, Minnesota.

Runoff risk is grouped into four categories: No event, Low, Moderate and Severe. When the risk is Moderate or Severe, it is recommended that the applicator evaluate the situation to determine if there are other locations or later dates when the application could take place. Figure 2 shows results for a specific location in Bandon Township in Renville County, Minnesota. For the first three days, the risk of runoff at that specific location was Severe, which indicated that a producer should wait to apply.

Daily Mapping Information

screenshot of soil temperature map
Figure 3. Daily soil temperature forecast at 6 inch depth for Minnesota.

The RRAF website also provides statewide forecasted daily average two inch soil depth temperatures which can be useful at planting time, daily average six inch soil depth temperatures which are helpful when determining fall fertilizer application in appropriate areas and daily precipitation forecasts. Figure 3 shows the daily soil temperature forecast at the six inch depth for the state of Minnesota. The colored dots are real time soil temperature gauges that can be interactively clicked on to reveal current soil temperature. The color of the dot is not reflective of the temperature at the gauge. It simply notes what entity is in charge of the gauge.

Potential of RRAF

This is a relatively new application that has been implemented in Minnesota since March 2018. The potential impacts of usage on this could be quite large. Any time movement of manure to water resources can be minimized is a success for the farmer and the environment. The overall goal of the presentation is to make people aware of this tool, share information on the performance, and encourage potential users to add this tool to their “toolbox”. The main message is to check conditions, delay if necessary, and spread on the day when there is least potential impact to the environment.

Further partnerships are desired to continue to get the word out on this application. Yearly multi-state coordination meetings occur, with the next meeting coming up in Ohio in August 2019. Version 3 of the RRAF will be derived from the National Weather Service National Water Model. Development on this version will start in Spring 2019 and should take four years for it to be merged into the National Water Model system. For MDA, we continue to promote RRAF website and monitor the output, comparing it to real time data to make sure that the model is working correctly.

Heather Johnson, Hydrologist 3, Minnesota Department of Agriculture

Heather.johnson@state.mn.us

Additional information


The authors are solely responsible for the content of these proceedings. The technical information does not necessarily reflect the official position of the sponsoring agencies or institutions represented by planning committee members, and inclusion and distribution herein does not constitute an endorsement of views expressed by the same. Printed materials included herein are not refereed publications. Citations should appear as follows. EXAMPLE: Authors. 2019. Title of presentation. Waste to Worth. Minneapolis, MN. April 22-26, 2019. URL of this page. Accessed on: today’s date.

Sidedressing Corn: Swine Manure via Dragline Hose Produces Yields Comparable to Synthetic Fertilizer

Spring in the upper Midwest can be short, resulting in challenges for producers to apply manure and plant crops in a timely manner to maximize yield. This results in a significant       amount of manure applied in the fall after the crop is harvested. Fall applied manure has ample time to mineralize and leave the root zone before next season’s crop can utilize the nutrients. These nutrients can end up in rivers and other freshwater bodies decreasing water quality. Sidedressing manure in growing crops could provide producers with another window of opportunity to apply their manure, maximize nutrient uptake efficiency, and protect water quality. The summer of 2018 was the start of a two-year, on-farm study researching the effectiveness of sidedressing slurry swine manure to corn via dragline hose. The swine manure was compared to sidedressed anhydrous ammonia, 32% urea ammonium nitrate (UAN), and a  control that received no additional nitrogen at the time of sidedressing.

What we did

Corn was planted May 7th with a 12-row planter equipped to apply an in-furrow and top dressed liquid fertilizer. The total fertilizer applied at planting was 40.7 lbs of nitrogen (N), 19.8 lbs of P2O5 phosphorus (P), and 14.4 lbs of sulfur (S) per acre.

Sidedressing the nitrogen sources

We sidedressed all treatments on June 4-5 with 140 pounds of available N, except the control which had no additional N applied. All the equipment applied nutrients between 30-inch rows and fit a 12-row planter to match up on odd rows.

  • Anhydrous ammonia treatment = 12-row toolbar and tractor were supplied by the farmer.
  • Finishing hog manure dragline hose treatment = The toolbar for the dragline hose sidedress was supplied by Bazooka Farmstar. The toolbar is a coulter till 28-foot bar with 30-inch spacing.
  • UAN treatment = The tool bar for the UAN sidedress application was provided by a local farmer.
  • Control treatment = The control treatment did not receive any fertilizer at sidedress.
Swine manure slurry being applied via dragline hose and Bazooka Farmstar sidedress bar.

Soil data collection methods

Soil nitrate and ammonium samples were taken 5 times through the growing season, approximately every 4 weeks, to track nitrogen in the soil profile. Soil sample depths were 0-6, 6-12, and 12-24 inches from the soil surface. Soil

Two foot soil sampling with tractor probe.

samples were taken from the middle of the interrow, 7.5 inches from both sides of the middle of the inter row and in the middle of the row. This sample method assured soil samples would be representative of the soil profile since banded fertilizer can skew results.

Yield data collection methods

Yield was harvested October 6th by a combine with a 6-row head. The combine took the middle 12 rows of the 24-row treatment reducing the side effects from neighboring treatments. A calibrated weigh wagon measured the weight of each combine pass which was calculated to find yield in bushels per acre for every sample.

What we have learned

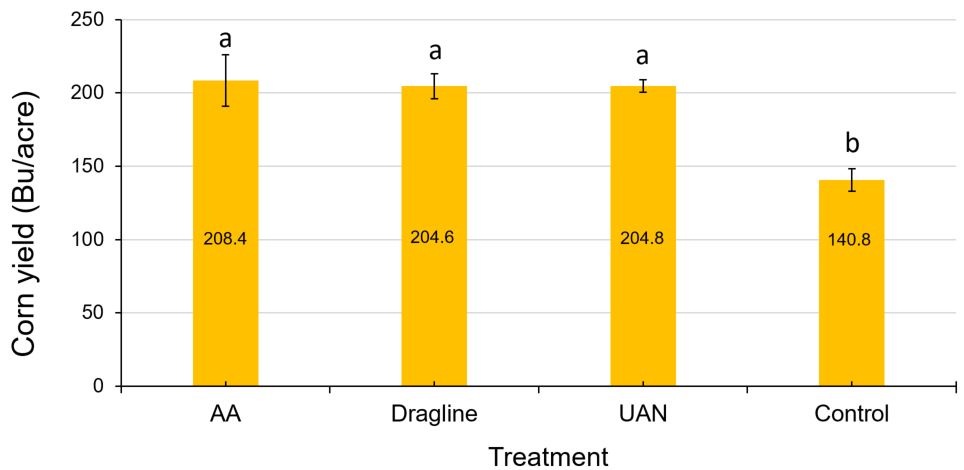
First year data revealed all sidedressed nitrogen sources significantly increased corn yields over the control but were otherwise statistically similar (Figure 1).

Figure 1. Yield data from 2018 manure sidedress trial in bushels per acre. AA=anhydrous ammonia, UAN=urea ammonium nitrate, Control=received no additional N at sidedress, and Dragline=swine manure slurry applied via dragline hose.

When we analyzed the soil inorganic nitrogen by each date differently, nitrogen concentrations between treatments were only statistically different on the soil sample date of June 15th (Figure 2) This soil sample date was ten days after the sidedress application on June 4th.  All other soil nitrogen sample dates are not statistically different between treatments and even the control.  

Figure 2. Total soil inorganic N (ammonium and nitrate) by treatment and sample date.

Statistics have not yet been run on the whole plant nitrogen content data in the graph below but numerically there doesn’t seem to be a difference in nitrogen content between the three sidedress treatments but a difference from the control (Figure 3).

Figure 3. Percent nitrogen in harvest grain, R6 cobbs, and R6 stover between treatments.

Future plans

The first year of data was collected during the 2018 growing season and a second year of data will be collected in the summer of 2019. This study aims to evaluate the effectiveness of sidedressed swine manure slurry compared to traditionally used synthetic fertilizers. Since we have seen promising results this first year an additional study that could follow this experiment would be a direct comparison of fall applied swine manure and sidedressed swine manure. This information would help us understand the efficiency of sidedressing compared to fall application. Soil samples from this study would also illustrate the difference in mineralization and nitrogen movement between fall-applied and sidedressed swine manure slurry.    

Authors

  • Chris Pfarr, M.S. student in the Land and Atmospheric Sciences Program, University of Minnesota, pfarr025@umn.edu
  • Melissa Wilson, Ph.D., Assistant Professor and Extension Specialist, Department of Soil, Water, and Climate, University of Minnesota, mlw@umn.edu

Additional information

Acknowledgements  

This project was partially funded by the Minnesota Soybean Research and Promotion Council and the Minnesota Pork Board.

The authors are solely responsible for the content of these proceedings. The technical information does not necessarily reflect the official position of the sponsoring agencies or institutions represented by planning committee members, and inclusion and distribution herein does not constitute an endorsement of views expressed by the same. Printed materials included herein are not refereed publications. Citations should appear as follows. EXAMPLE: Authors. 2019. Title of presentation. Waste to Worth. Minneapolis, MN. April 22-26, 2019. URL of this page. Accessed on: today’s date.
Energy Consumption in Commercial Midwest Dairy Barns

Consumer interest and concern is growing in regards to sustainability of livestock production systems. Demand for reduced carbon emissions within agricultural systems has been growing along with increasing demand for food. Baseline fossil fuel consumption within agricultural systems, including dairy production, is scarce. Therefore, there is a need to discern where and how fossil energy is being used within dairy production systems. Determining baseline energy use is the first step in investigating the demand for a reduced carbon footprint within dairy production systems. The objective of this study was to measure total electricity use and determine specific areas of high energy consumption in commercial dairy barns located in the Upper Midwest of the United States.

What did we do?

Four commercial dairy barns representative of typical Midwest dairy farms and located in west central Minnesota were evaluated in the study. The dairy farms were: 1) a 9,500 cow cross-ventilated barn with a rotary milking parlor (Farm A), 2) a 300 cow naturally-ventilated barn with stirring fans for air movement and 6 automatic milking systems (Farm B), 3) a 200 cow naturally-ventilated barn with stirring fans for air movement and a parabone milking parlor (Farm C), and 4) a 400 cow naturally-ventilated barn with stirring fans for air movement and a parallel milking parlor (Farm D).

Electricity use was monitored from July 2018 to December 2018 with a goal of collecting two years of total energy usage. Two-hundred ninety-two  electric loads across the four farms were monitored on the farm side of the electric utility meter to evaluate areas of highest energy usage (Figure 1). Some of the monitored electric loads included freestall barn fans, water heaters, compressors, chillers, manure pumps, and pressure washers. The electric loads were monitored by data loggers (eGauge, Boulder, CO) and electric current sensors at the circuit panels. Electrical use data (kWh) of each load were collected and analyzed on a monthly basis. In addition, monthly inventory of cows on farm, cows milked per day, and milk production was recorded. Bulk tank production records (milk, fat percentage, protein percentage, and somatic cell count) were also recorded.

Figure 1. Data loggers with electric current sensors installed on farm circuit panel boxes.

What have we learned?

Based on preliminary results, fans were the largest electrical load across all four dairy farms. Fan usage during the summer ranged from 36 to 59% of the total electricity measured (Figure 2). Regular maintenance, proper control settings, design, sizing, location, selecting energy efficient fans and motors, and other factors all could influence the efficiency of these ventilation/cooling systems. Farms B, C, and D had greater electricity usage across all months for milk cooling (compressors and chillers) than Farm A. This is likely due to the fact that Farm A does not utilize bulk tanks to store milk, but instead, milk is directly loaded onto bulk milk trucks. Lighting use ranged from 7 to 21% of the total electricity use measured across the four farms, which suggests there is potential to reduce energy usage by upgrading to more efficient lighting systems such as LEDs. For heating, energy usage includes water heating, heating units in the milking parlor or work rooms, waterer heating elements, and generator engine block heaters. Average monthly heating use ranged from 5% of electricity used in Farm A to 32% of electricity used in Farm C.

Figure 2. The average monthly electrical use measured by data loggers and the percent used by each electrical load category. The average monthly total electricity in kWh is displayed at the top of each bar.

Future plans

Based on the preliminary analysis, clean energy alternatives and energy-optimized farms will be modeled as clean energy alternatives for Minnesota dairy facilities. An economic analysis will also be conducted on the clean energy alternatives and farms. Potential on-site renewable electric generation may supply some or the entire electric load allowing the buildings to approach net-zero (producing as much energy as is used).

The results of this study provide recent energy usage for farm energy benchmarks, agricultural energy policy, economic evaluations, and further research into dairy farm energy studies. The data will also be useful to producers who are searching for areas for reduced energy usage in their own production systems. Improving the efficiency of electrical components in dairy operations could provide opportunities to improve the carbon footprint of dairy production systems.

Authors

Kirsten Sharpe, Animal Science Graduate Research Assistant, West Central Research and Outreach Center (WCROC), Morris, MN, sharp200@umn.edu

Bradley J. Heins, Associate Professor, Dairy Management, WCROC, Morris, MN

Eric Buchanan, Renewable Energy Scientist, WCROC, Morris, MN

Michael Cotter, Renewable Energy Researcher, WCROC, Morris, MN

Michael Reese, Director of Renewable Energy, WCROC, Morris, MN

Additional information

The West Central Research and Outreach Center (WCROC) has developed a Dairy Energy Efficiency Decision Tool to help provide producers a way to estimate possible energy and costs savings from equipment efficiency upgrades. The tool can be used to evaluate areas of a dairy farm that may provide the best return on investment for energy usage. Furthermore, a guidebook has been developed for Optimizing Energy Systems for Midwest Dairy Production. This guidebook provides additional information about energy usage issues as well as a decision tool. More information may be found at https://wcroc.cfans.umn.edu/energy-dairy

Acknowledgements

The funding for this project was provided by the Minnesota Environment and Natural Resources Trust Fund as recommended by the Legislative-Citizen Commission on Minnesota Resources (LCCMR).

The authors are solely responsible for the content of these proceedings. The technical information does not necessarily reflect the official position of the sponsoring agencies or institutions represented by planning committee members, and inclusion and distribution herein does not constitute an endorsement of views expressed by the same. Printed materials included herein are not refereed publications. Citations should appear as follows. EXAMPLE: Authors. 2019. Title of presentation. Waste to Worth. Minneapolis, MN. April 22-26, 2019. URL of this page. Accessed on: today’s date.

On-Farm Research and Student Engagement to Assess and Promote Manure and Mulch as Land Treatment Practices in Nebraska

In regions of intensive livestock production, like many areas in Nebraska, significant amounts of livestock manure are produced and, at times, underutilized. Manure positively impacts soil health, has been shown to reduce runoff and erosion, and is no more of a pollutant risk than commercial fertilizers when applied responsibly and at appropriate rates.

Eastern red cedar trees (Juniperus virginiana), a native tree in Nebraska and many parts of the Great Plains, can proliferate readily when not properly managed. In Nebraska, where they are often planted to create windbreaks for livestock and homesteads, red cedar trees have multiplied substantially and are now considered an invasive species in many areas. Negative ecological and economic impacts of this phenomenon include reduced forage production on rangeland, fragmented habitat for wildlife, reduced water availability due to its high water consumption and increased risk and severity of wild fires. Prescribed burning of smaller trees and mechanical removal of larger ones can effectively limit dissemination of red cedar, but the expense of mechanical removal limits the management of these trees by many landowners. Identifying value-added markets for cedar wood chips has become a priority of the Nebraska Forest Service and many Natural Resources Districts (NRDs) in the state to offset expenses for tree management. The project presented here describes on-going efforts to quantify agronomic, economic and ecological impacts of utilizing cedar wood chips alone or co-mingled with livestock manure as soil amendments in crop production systems.

In addition to investigating the impacts of this novel use for cedar wood chips, this project is contributing to a larger effort to demonstrate the value and promote the utilization of manure as a nutrient source and soil amendment in cropping systems. The overall goal of this effort is to document and demonstrate the effects of land applied manure and cedar mulch on agronomic, economic and soil health variables in cropland under different agro-climatic conditions using a novel partnership model.

WHAT DID WE DO?

A producer-driven research study was initiated in 2015 to assess the impacts of cedar woodchips alone and co-mingled with livestock manure or urea ammonium nitrate fertilizer on soil, water use efficiency and agronomic productivity. This three-year study, conducted in the Nebraska Sandhills where sandy, excessively drained soils dominate, was completed in 2018 and is now being expanded to document and demonstrate the impacts of these practices throughout Nebraska under varying soil types and climatic conditions.

An ambitious partnership model, designed to accomplish the research and outreach goals through broad collaborative efforts, encompasses an on-farm research initiative replicated in six NRDs throughout Nebraska utilizing local implementation teams. Study sites include Overton, Brule, Saint Paul, Julian, Ainsworth, and Pierce, Nebraska (Figure 1). The local implementation team for each site is composed of a crop farmer and members of the local NRD, Natural Resources Conservation Service, Nebraska Extension, the Nebraska On-farm Research Network, the Nebraska Forest Service and the University of Nebraska-Lincoln. Additionally, each local implementation team is engaged with at least one local high school agricultural program. Delivery of a curriculum to students in these programs, developed according to the research and extension objectives, and student participation in on-farm research are intended to improve their knowledge about on-farm research methods, soil health, and benefits of responsible recycling of manure and cedar mulch as soil amendments. Using their research experiences, students will develop novel outreach products intended to positively impact knowledge and behaviors related to soil health, manure and red cedar tree management among crop producers and their advisors.

Map of Nebraska: locations of on-farm research and high school agriculture program partners.
Figure 1. Statewide locations of on-farm research and high school agriculture program partners.

WHAT HAVE WE LEARNED?

The current project was initiated in summer 2018 and early efforts generated broad interest among crop producers and school teachers to participate in. On-farm research sites are being established using a Complete Randomized Block Design. Plots measure 170 m (350 ft) in length and up to 12 m (40 ft) in width, depending on equipment utilized by each partnering farmer. Up to four treatments are assigned to plots within each of four blocks. Treatments include: livestock manure, manure mixed with cedar woodchips, cedar woodchips* and commercial fertilizer. (*Note: Not all sites include a woodchip-only treatment; likewise, some sites include a treatment selected by the farmer, such as biochar.) Samples collected prior to treatment applications and regularly throughout the growing season will provide agronomic, environmental and soil health data at each study site.

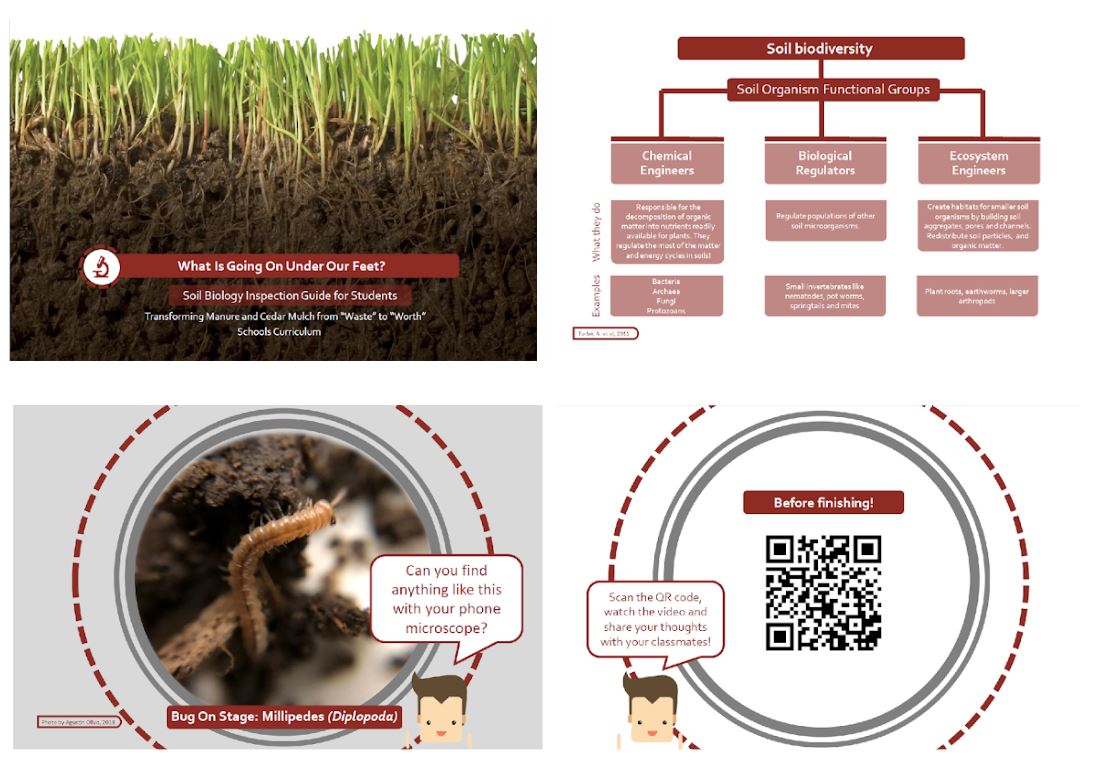
Curriculum implementation has begun at five high schools, each associated with a research site. Approximately 60 students will participate in the project during spring 2019. The curriculum (Figure 3) encompasses 4 modules: On-farm research (Module 1), Soil Health (Module 2), Crop Productivity (Module 3) and Outreach (Module 4). Each module is comprised of field and classroom activities. Partnering teachers and their students will use this curriculum document to complete lessons in one or more modules during each semester of engagement with the project team.

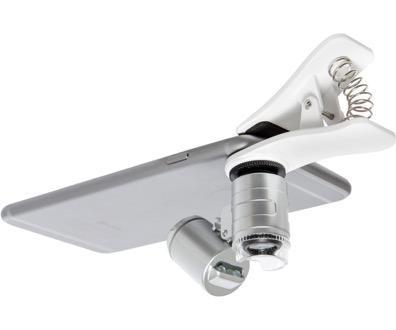
A 52-page Soil Biology Inspection Guide (Figure 4) has been developed for use by students to identify and understand the roles of soil organisms they find during hands-on soil inspections with a smart phone microscope. Along with the printed materials, each partnering teacher will receive a supply of smart phone microscopes (Figure 5) for students to use to inspect soil within the study site with which they are associated and in other soil samples.

Figure 3. Sample pages from the High School Curriculum.


Figure 4. Sample pages from the Soil Biology Inspection Guide.
Figure 5. Smart phone compatible microscopes to be provided to classrooms.

FUTURE PLANS

On-farm research will be conducted during the 2019 and 2020 growing seasons to document short-term effects of the applied treatments. Each on-farm research site will host a field day during year three of the project to share study results and host farmer experiences with local agricultural producers and their advisors. Participating high school students will maintain an active role in research and outreach throughout the project. Assessments of knowledge gained and intended or actual behavior changes among students, their teachers, participating producers and outreach audiences will be completed to document impacts of this effort. Furthermore, an online photo sharing site is being explored to facilitate exchange of project photos among classes in all partnering high schools. Engaging students in the study near their school will be complimented by engaging classrooms from other schools participating in the project to share study statuses, data, and other information. These activities will be conducted via Zoom (online meeting platform) and facilitated by project team members to encourage students to share successes, frustrations, discoveries and outcomes from their study site with students in other schools participating in this project.

AUTHORS

Olivo, Agustin (University of Nebraska-Lincoln) – agustinolivo@outlook.com

Schmidt, Amy (University of Nebraska-Lincoln) – aschmidt@unl.edu

Koelsch, Richard (University of Nebraska-Lincoln)

Schott, Linda (University of Nebraska-Lincoln)

Howard, Larry (University of Nebraska-Lincoln)

Ingram, Troy (University of Nebraska-Lincoln)

Lesoing, Gary (University of Nebraska-Lincoln)

Nygren, Aaron (University of Nebraska-Lincoln)

Saner, Randy (University of Nebraska-Lincoln)

Timmerman, Amy (University of Nebraska-Lincoln)

Whitney, Todd (University of Nebraska-Lincoln)

ADDITIONAL INFORMATION

https://water.unl.edu/article/animal-manure-management/manure-and-mulch-are-teaming

http://digitalcommons.unl.edu/biosysengdiss/86/

ACKNOWLEDGMENTS

The Nebraska Environmental Trust provided funding for this project, Project 18-203: Transforming Manure and Cedar Mulch from ‘Waste’ to ‘Worth’.

The authors are solely responsible for the content of these proceedings. The technical information does not necessarily reflect the official position of the sponsoring agencies or institutions represented by planning committee members, and inclusion and distribution herein does not constitute an endorsement of views expressed by the same. Printed materials included herein are not refereed publications. Citations should appear as follows. EXAMPLE: Authors. 2019. Title of presentation. Waste to Worth. Minneapolis, MN. April 22-26, 2019. URL of this page. Accessed on: today’s date.

Methodologies for In-situ Characterization of the Impact of Equine Manure Management Practices on Water Quality

Nutrient loading of nitrogen and phosphorus in runoff and water leachate threatens Florida’s environmental and water resources. Of those nutrients, nitrate (NO3–) nitrogen is highly soluble and not strongly bound to soils. Consequently, nitrate is highly mobile and subject to leaching losses when both nitrate content and water movement are high.

Due to Florida’s sandy soils and humid subtropical climate, nitrate losses from leaching and runoff are high and creates concerns for animal waste handling1. Mitigating nutrient loading to ground and surface waters through proper management of horse manure and stall waste can help protect water quality. However, information regarding the relationship between on-farm equine manure management practices and water quality remains limited.

What did we do

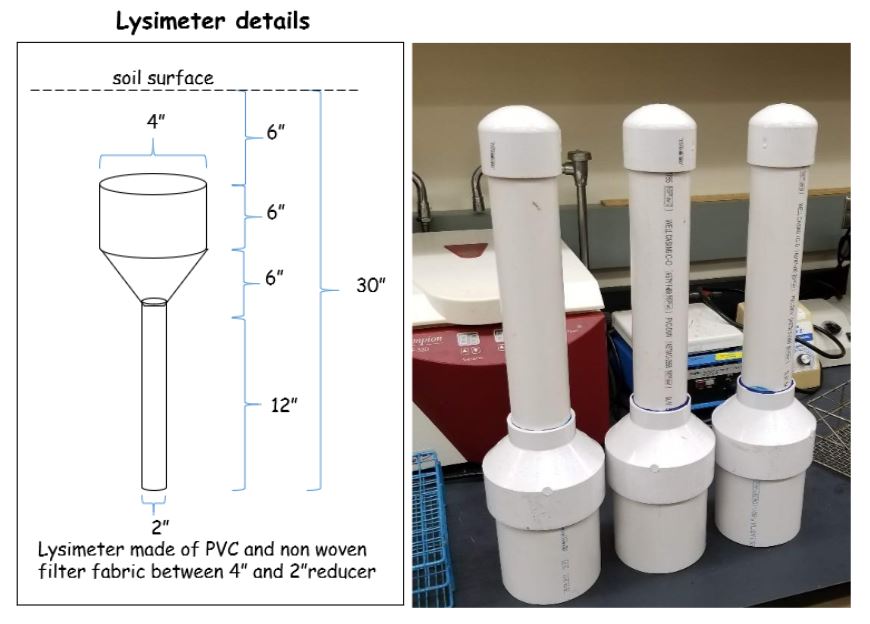
The objective of this study was to address waste management challenges on Florida equine operations by developing methodologies for in-situ characterization of nutrient profile of pore and surface water runoff from stockpiled equine waste and waste that has been effectively composted. Two small-scale horse properties with 2-8 horses managed on 4-9 acres, and 1 larger scale operation with up to 70 horses managed on 300+ acres located within the Rainbow Springs Basin Management Action Plan (BMAP) were enlisted for the project. Lysimeters (soils enclosed in suitable containers and exposed to natural surroundings to capture leachates) were constructed of PVC and non-woven filter fabric suspended between a 4” and 2” PVC reducer with a total length of 24” and deployed 6” below ground2 (Figure 1).

Figure 1. Design details and image of lysimeters used for leachate collection. Each lysimeter was equipped with silicone tubing for effluent collection.


One hole was drilled between the 4” and 2” PVC reducer to insert the sampling lines to the bottom well of the lysimeter and secured with duct tape. For each lysimeter installation, the top 6” of the soil profile was removed using a 6” diameter core ring to ensure the soil profile was undisturbed. The remaining 6”-12” depth of soil was composited and repacked into the lysimeter container, layer by layer. An auger was used to achieve a total depth of 30 inches from the surface to secure the lysimeter in the ground. Following lysimeter installation, the top 6” of intact soil was replaced above the lysimeter and all lines were buried 6” in the soil and channeled to one central location. The collection trenches were fabricated from vinyl gutter material filled with river rock (pre-rinsed for removal of iron and sediment) and installed up and downgradient at stockpile systems and at the opening of each compost bin. A 5-gallon bucket attached to the downgradient gutter served as the water collection reservoir (Figure 2).

three bin compost structure
Figure 2a) Three bin manure compost structure
Manure stockpile structure
Figure 2b) Manure stockpile structure

Figure 2. Placement of runoff collection trenches within the (a) compost and (b) stockpile manure bin structures. The trenches intercept any runoff during heavy rainfall and drain into a 5-gallon bucket. Once the bilge pump below the bucket is adequately submerged, the water is evacuated to the secondary collection bucket for sampling.

Figure 3. Arrangement of the eight peristaltic pumps on a hand truck dolly for ease of transport. The pumps with connected clear silicone tubing are attached to the lysimeter collection line for leachate collection.

For the lysimeter leachate sampling, eight peristaltic pumps were arranged in an array of 4 pumps wired together and controlled by an on/off switch connected to a sampling tube of the lysimeter (Figure 3).
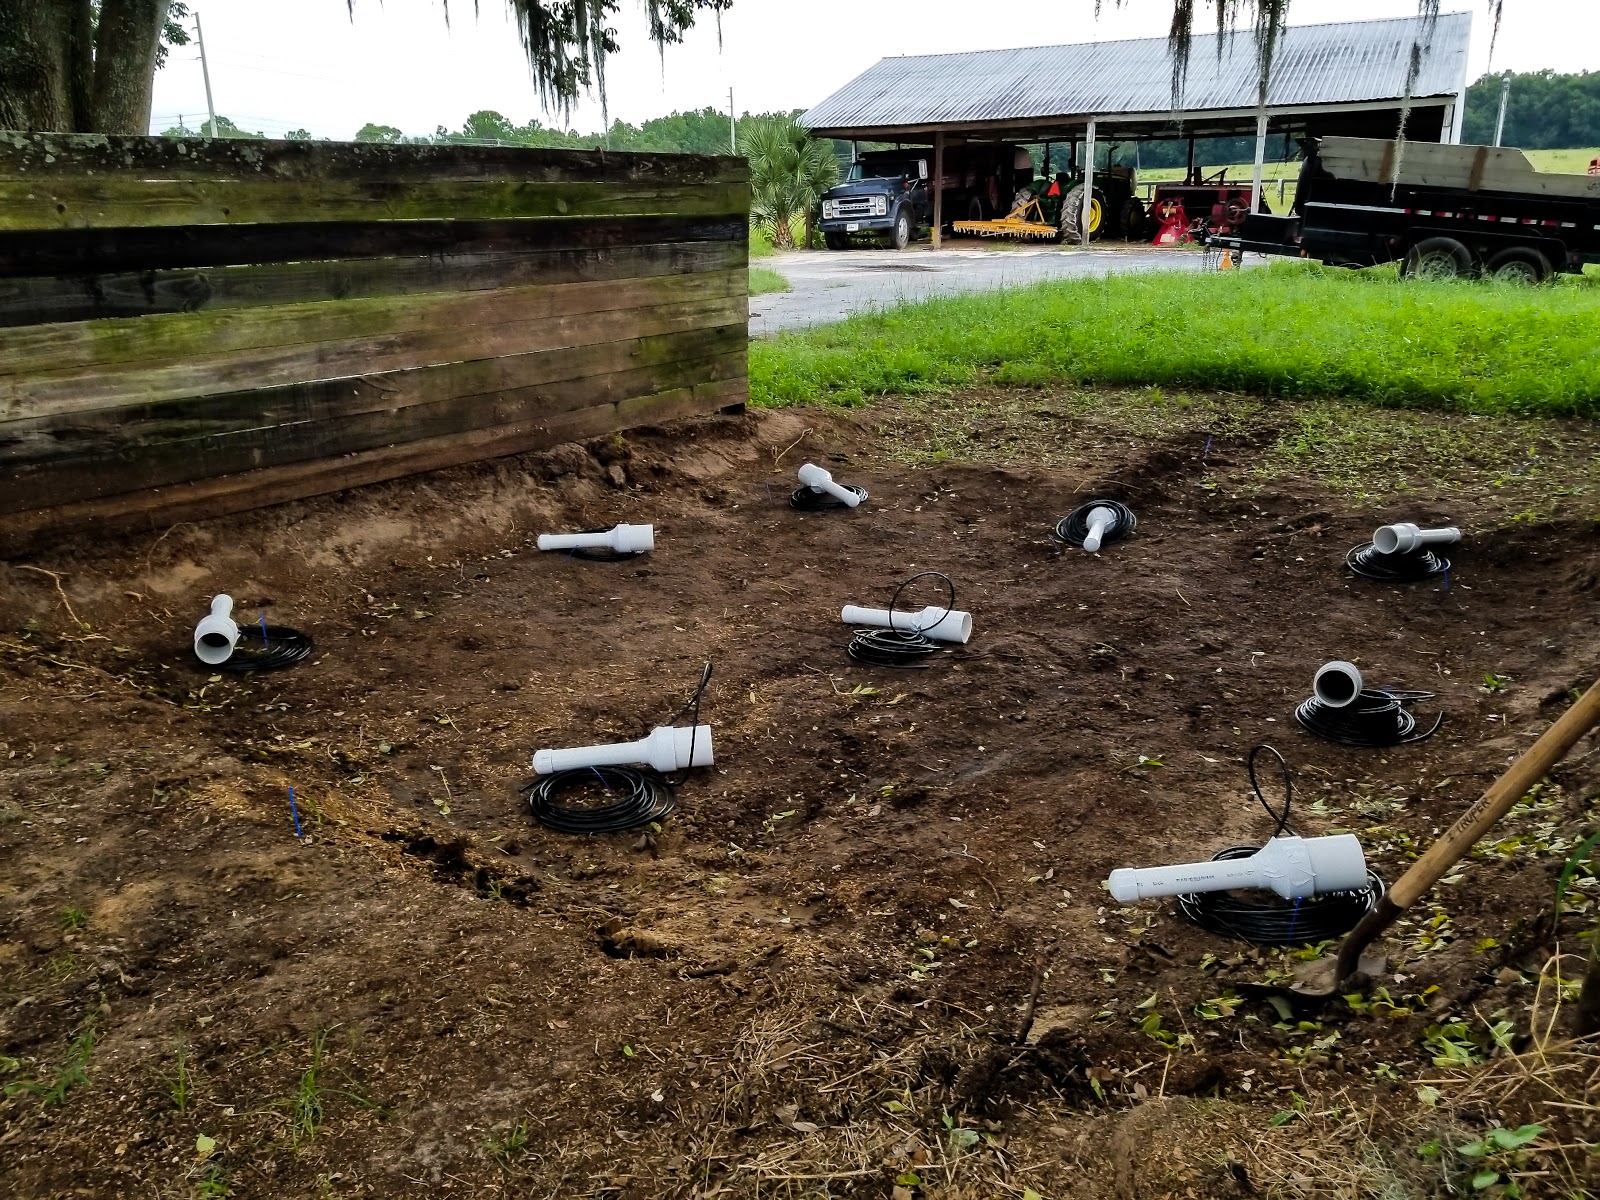
A grid of 4-5 lysimeters were placed under each compost bin for collection and compositing of samples. The lysimeters for the stockpile were arranged in a 3×3 grid across the stockpile bin with each row (3 lysimeters) representing a composited sample (Figure 4).

Figure 4. Pre-installation and arrangement (3x3) of the lysimeters within the manure stockpile structure.
Figure 4. Pre-installation and arrangement (3×3) of the lysimeters within the manure stockpile structure.

The lysimeters were purged with deionized water after two weeks or after a heavy rainfall event prior to the first sample collection.  For water runoff collection, a 12 volt (500gph) automatic bilge pump, powered by a marine battery, was used to pump water from the collection bucket to a 5-gallon sampling bucket. A 10% subsample was collected with the remaining 90% expelled to the ground surface using a 2-way restricted-flow Y connector. Runoff samples (collected immediately post rainfall event) and leachate samples (collected biweekly) were acidified and stored in scintillation vials at 4oC for nutrient analysis (NO-X, NH4+, TKN, and TP).

Outcome

 The lysimeter and water runoff collection trench construction provide a cost-effective, easily deployed system for characterizing nutrient loading in leachate and surface runoff from manure storage and composting sites. The system has been successful in collecting samples for nutrient analysis, however, a few challenges have also been identified. (1) The runoff system requires periodic maintenance, primarily cleaning (re-rinsing) the gutter and river rock to remove any material lying above the trench. (2) Also, the Y connectors require calibration every month to remove leaf litter and other debris to allow water flow through the valves to ensure a 10% subsample is collected. (3) Suspended materials (fine soil or organic matter) have been observed in lysimeter leachate samples and runoff collection trenches. (4) A subset of lysimeter samples have emitted a sulfur odor when adverse weather conditions or other events delay sampling beyond the target 2-week interval.

Future plans

To assess potential nitrate losses due to sample retention time, the lysimeter effluent will be sampled at specific intervals (day 1, day 3, day 6, day 9, day 14) during a period of no rainfall. These measurements should help determine the optimal time interval for sample collection for analysis of nitrate levels.  Additionally, runoff samples are being collected for analysis of fecal coliform and E. coli. The methodologies employed in this field level study represent an important step towards an improved understanding of the impact of manure management BMPs on water quality.

Corresponding author, title, and affiliation

Agustin Francisco, Graduate Student, University of Florida

Corresponding author email

afran@ufl.edu

Other authors

Carissa Wickens, State Extension Horse Specialist, University of Florida Mark Clark, Wetland Ecologist, University of Florida; Caitlin Bainum, Extension Agent, Florida Cooperative Extension, Marion County, Ocala, Florida; Megan Mann, Extension Agent, Florida Cooperative Extension, Lake County, Tavares, FL

Additional information

1FDEP. 2013. Small Scale Horse Operations: Best Management Practices for water resource protection in Florida.

2Bergstrom, L. 1990. Use of lysimeters to estimate leaching of pesticides in agriculture soils. J. Environmental Pollution. 67:325-347

Additional information regarding this project is available by contacting Carissa Wickens (cwickens@ufl.edu), or Agustin Francisco (afran@ufl.edu).

Acknowledgements

The authors wish to thank the Southwest Florida Water Management District (SWFWMD) for funding support, the farm site cooperators Dave and Deb Kane, Jim and Merry Lee Bain, and Eli and Jeff McGuire. We would also like to thank Carol Vasco, Ellen Rankins, Ana Margarita Arias, Anastasia Reif for their assistance with site installation and data collection.

The authors are solely responsible for the content of these proceedings. The technical information does not necessarily reflect the official position of the sponsoring agencies or institutions represented by planning committee members, and inclusion and distribution herein does not constitute an endorsement of views expressed by the same. Printed materials included herein are not refereed publications. Citations should appear as follows. EXAMPLE: Authors. 2019. Title of presentation. Waste to Worth. Minneapolis, MN. April 22-26, 2019. URL of this page. Accessed on: today’s date.

i(AM)Responsible: A Nationwide Network for Engaging Consumers and Agricultural Producers in Addressing Antimicrobial Resistance (AMR)

Antimicrobial resistant infections have been recognized globally as a significant threat to public health. While research to characterize antimicrobial resistance (AMR) in microbial populations on livestock production systems has progressed since launching the AFRI Food Safety AMR Program, a nationwide coordinated effort among university outreach programs to convey science-based knowledge on AMR dynamics to stakeholders, including agricultural producers, food safety experts, educators, consumers, medical professionals, and policymakers, remains undeveloped. Significant uncertainty about the exact cause(s) and factors impacting proliferation of AMR still exists. As research continues to focus on these topics, developing nationwide capacity for conducting effective scientific outreach and stakeholder education on this topic will be critical to disseminating best management strategies that stakeholders can implement to mitigate their contributions to AMR. Continue reading “i(AM)Responsible: A Nationwide Network for Engaging Consumers and Agricultural Producers in Addressing Antimicrobial Resistance (AMR)”

The Michigan EnviroImpact Tool: A Supporting Tool to Help Farmers in Forecasting Manure Nutrient Runoff Risk

The purpose of the MI EnviroImpact Tool is to provide farmers with a daily runoff risk decision support tool that can aid in effectively planning short-term manure and nutrient application. This not only helps keep nutrients on the field and potentially saves money, but it also helps to protect our waterways in Michigan.

Lifecycle of manure nutrients
Figure 1. Livestock operations are a readily available source of manure nutrients. With effective nutrient application, farmers might be able to reduce the use of commercial fertilizers and save money.
With the MI EnviroImpact tool, farmers are able to plan for effective short-term manure application.
Figure 2. With the MI EnviroImpact tool, farmers are able to plan for effective short-term manure application.

What did we do?

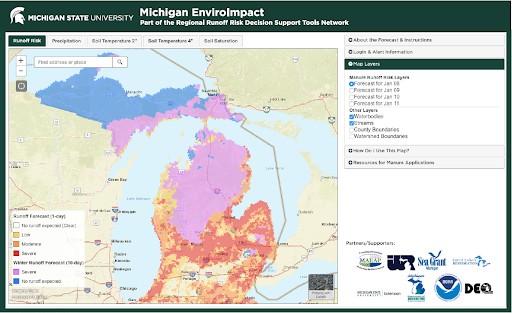
Farmer interest groups were pulled together for initial piloting and testing of the MI EnviroImpact tool to hear what worked and what needed improvement. The goal was to make this a very user-friendly tool that everyone could use. Additionally, educational and outreach materials were created (factsheet, postcard, YouTube videos, and presentations) to help get the word out about this decision support tool. The ultimate goal of the MI EnviroImpact tool is for use as a decision support tool for short-term manure and nutrient application. The tool derives the runoff risk forecast from real-time precipitation and temperature forecasts. This information is then combined with snow melt, soil moisture and temperature, and other landscape characteristics  to forecast times when the risk of runoff will be higher. The MI EnviroImpact tool is applicable in all seasons and has a winter mode for times when the average daily snow depth is greater than 1 inch or the 3-day average soil temperature (top 2 inches) is below freezing.

The MI EnviroImpact tool displaying both winter and non-winter modes of daily runoff risk.
Figure 3. The MI EnviroImpact tool displaying both winter and non-winter modes of daily runoff risk.

What did we learn?

Through our work with the MI EnviroImpact Tool and those that helped to develop this tool, we were able to spread awareness of this user-friendly tool, so that more farmers would be likely to use it to help in nutrient application planning. Furthermore, those outside of the farming community have been very encouraged to see that agriculture is continuing to take steps in being environmentally friendly. Additionally, others have viewed this tool as a resource outside of farmers, showing that the MI EnviroImpact Tool has broader implications than just agriculture.

Future Plans

Future plans include continuing education about the MI EnviroImpact Tool as well as continued distribution of educational materials to help spread awareness of the tool itself.

Additional Information

Those who would like to learn more about the MI EnviroImpact Tool can visit the following links:

Acknowledgements

This project was prepared by MSU under award NA14OAR4170070 from the National Oceanic and Atmospheric Administration, U.S. Department of Commerce through the Regents of the University of Michigan. The statements, findings, conclusions, and recommendations are those of the author(s) and do not necessarily reflect the views of the National Oceanic and Atmospheric Administration, the Department of Commerce, or the Regents of the University of Michigan.

MSU is an affirmative-action, equal-opportunity employer, committed to achieving excellence through a diverse workforce and inclusive culture that encourages all people to reach their full potential. Michigan State University Extension programs and materials are open to all without regard to race, color, national origin, gender, gender identity, religion, age, height, weight, disability, political beliefs, sexual orientation, marital status, family status or veteran status. Issued in furtherance of MSU Extension work, acts of May 8 and June 30, 1914, in cooperation with the U.S. Department of Agriculture. Jeff Dwyer, Director, MSU Extension, East Lansing, MI 48824. This information is for educational purposes only. Reference to commercial products or trade names does not imply endorsement by MSU Extension or bias against those not mentioned.

Partners and funding sources involved in supporting, developing, and implementing the MI EnviroImpact tool.
Figure 4. Partners and funding sources involved in supporting, developing, and implementing the MI EnviroImpact tool.

Project Collaborators:

Heather A. Triezenberg, Ph.D.
Extension Specialist and Program Leader, Michigan Sea Grant
Michigan State University Extension
Community, Food and Environment Institute
Fisheries and Wildlife Department
Meaghan Gass
Sea Grant Extension Educator
Michigan State University Extension

Jason Piwarski
GIS Specialist
Michigan State University
Institute of Water Research

Dustin Goering
Senior Hydrologist
North Central River Forecast Center
NOAA National Weather Service

Cindy Hudson
Communications Manager, Michigan Sea Grant
Community, Food & Environment Institute
Michigan State University Extension

Jeremiah Asher
Assistant Director
Institute of Water Research
Michigan State University

Kraig Ehm
Multimedia Producer
ANR Communications and Marketing
College of Agriculture and Natural Resources
Michigan State University

Luke E. Reese
PhD, Associate Professor
Biosystems and Agricultural Engineering
Michigan State University

Marilyn L. Thelen
Associate Director, Agriculture and Agribusiness Institute
Michigan State University Extension

Todd Marsee
Senior Graphic Designer
Michigan Sea Grant
University of Michigan

Mindy Tape
Manager
ANR Communications & Marketing
Michigan State University Extension


The authors are solely responsible for the content of these proceedings. The technical information does not necessarily reflect the official position of the sponsoring agencies or institutions represented by planning committee members, and inclusion and distribution herein does not constitute an endorsement of views expressed by the same. Printed materials included herein are not refereed publications. Citations should appear as follows. EXAMPLE: Authors. 2019. Title of presentation. Waste to Worth. Minneapolis, MN. April 22-26, 2019. URL of this page. Accessed on: today’s date.

Regional Runoff Risk Tools for Nutrient Reduction in Great Lakes States

One method to reduce the impacts of excess nutrients leaving agricultural fields and degrading water quality across the Nation is to ensure nutrients are not applied right before a runoff event could occur.  Generally nutrient management approaches, including the 4-Rs (“right” timing, rate, placement, and source), include some discussion about the “right time” for nutrient applications, however that information is static guidance usually centered on the timing of crop needs.  What has been missing, and what will be discussed in this talk, will be the development and introduction to runoff risk decision support tools focused on providing farmers and producers real-time guidance on when to not apply nutrients in the next week to 10 days due to the risk of runoff capable of transporting those nutrients off their fields.  The voluntary adoption and use of runoff risk in short-term field management decisions could provide both environmental and economic benefits.

In response to the need for real-time nutrient application guidance and a request from states in the Great Lakes region, the National Weather Service (NWS) North Central River Forecast Center (NCRFC) has helped develop these runoff risk tools in collaboration with multiple state agencies and universities and with support from the Great Lakes Restoration Initiative (GLRI).  There are currently four active runoff risk tools in the Great Lakes region: Michigan, Minnesota, Ohio, and Wisconsin.  It is possible to develop similar tools for Illinois, Indiana, and New York if willing state partners are identified.  

What did we do?

Studies have shown that a few large runoff events per year contribute a majority of the annual load leaving fields.  In addition applications generally occur during the riskiest times of year for runoff (fall through spring) when fields experience the least vegetative cover and soils are vulnerable.  Knowing this information, real-time NWS weather and hydrologic models were evaluated to identify conditions that correlated with runoff observed at edge-of-field (EOF) locations.  The runoff risk algorithm identifies daily runoff events and stratifies the events by magnitude respective to each grid cell’s historical behavior.  The events are then classified into risk categories for the farmers and producers. In general, high risk events are larger magnitude events that don’t happen as often and also have a higher accuracy rate.  On the other end, low risk events are smaller magnitude events that have a higher chance of being a false alarm yet are also less likely to be associated with significant nutrient loss.

NWS models are run twice daily and simulate soil temperature, soil moisture, runoff, and snowpack conditions continuously.  The runoff risk algorithm is applied against the model output to produce runoff risk guidance which is sent to the state partners.  Each state has a working group and a lead agency or organization that manages the effort to produce and maintain the runoff risk websites as well as promote the tools and educate the users on how to interpret and use the guidance.  

What have we learned?

At this point there are four regional runoff risk tools available.  Response has been positive from both state agencies and when farming groups are asked about the runoff risk concept during post-presentation surveys and small focus groups.  There is a strong desire from the farming community to make the best decision during stressful times of the year when farming schedules and the weather are often in conflict.  

At this point, it is universally accepted among the runoff risk collaborators that there is a need to provide free, easily obtainable forecast guidance to the farming community so they can make the best nutrient application decisions for their operations and the environment.

Runoff risk tools are strictly for decision support and not meant to be a regulatory tool in nature.  This is due to the limitations in hydrologic models, weather forecasting, spatial scale issues, and that the tools have no way of incorporating farmer specific practices into the risk calculations.  Although model improvements will occur in the future, ensuring users understand the limitations but also the benefits they can provide are important components in the States’ outreach and education functions.  

Future Plans

Based on feedback from the states employing runoff tools, there is a second round of enhancement planned for the runoff risk algorithm in the summer of 2019.  Other improvements from the states’ perspective deal with updating webpages and building on and enhancing push notification capabilities such as text message and email alerts.

The next major step forward begins in spring 2019 with the start of version 3 runoff risk.  This 2-year development will transition runoff risk guidance from the current model over to the new NWS National Water Model (NWM).  The NWM framework will allow finer resolution guidance (1km or smaller) for numerous models runs per day all with full operational support.  Moving to the NWM also allows continuous improvement and future collaboration opportunities with universities to improve the underlying WRF-Hydro model as well as runoff risk and other derived decision support guidance.

Authors

Dustin Goering, Senior Hydrologist, North Central River Forecast Center, National Weather Service
Andrea Thorstensen, Hydrologist, North Central River Forecast Center, National Weather Service

Corresponding Author email
dustin.goering@noaa.gov

Additional Information

For further information on runoff risk background please visit this page: https://vlab.ncep.noaa.gov/web/noaa-runoff-risk/runoff-risk-background  (Still under construction)


To visit the state tools see the following links:


Michigan  

Minnesota 

Ohio  

Wisconsin  

Acknowledgements

There are many individuals across a wide spectrum of agencies, industry, and universities that have been instrumental in the development of runoff risk to this point.

Support for the development of runoff risk across the Great Lakes and the upcoming version 3 runoff risk from the National Water Model has been provided by multi-year grants from the Great Lakes Restoration Initiative.


The authors are solely responsible for the content of these proceedings. The technical information does not necessarily reflect the official position of the sponsoring agencies or institutions represented by planning committee members, and inclusion and distribution herein does not constitute an endorsement of views expressed by the same. Printed materials included herein are not refereed publications. Citations should appear as follows. EXAMPLE: Authors. 2019. Title of presentation. Waste to Worth. Minneapolis, MN. April 22-26, 2019. URL of this page. Accessed on: today’s date.

Antibiotic Measurement and Recovery in Manure and Impacts on Antimicrobial Resistance in Agricultural Settings

Antimicrobial resistance (AMR) has been exacerbated through anthropogenic sources of antibiotics, with antibiotics use in animal production being a possible contributor to AMR. On dairy and beef cattle operations, different classes of antibiotics are administered in response to an infection, or as a prophylactic to prevent infection. The connection between cattle antibiotic use and AMR development in human pathogens is uncertain. To better understand this possible connection (and associated risks), we need improved knowledge of the fate and transport of antibiotics in livestock manure. This necessitates quantification of antibiotics in complex organic matrices. The challenges in measuring antibiotics in animal husbandry result from the heterogeneity of manure with varying manure treatment and handling systems. Typically, antibiotic extraction procedures focus on a single class of antibiotic; however, the goal of this study was to optimize one extraction method for multiple classes of antibiotics in cattle manure. Four classes of antibiotics were targeted: tetracyclines, macrolides, sulfonamides, and beta-lactams. The beta-lactams, penicillin G, ampicillin, ceftiofur, and two lactam metabolites were of specific interest because of their prevalent use for treatment and prevention of mastitis in dairy cows and difficulty to detect in manure extracts. Two manure preservation methods were considered: frozen and freeze-dried. Tested extraction methods included: accelerated solvent extraction, liquid-liquid extraction, solid phase extraction, and salting out. None of the direct extraction procedures produced sufficient recoveries for the beta-lactams. A derivatization method that hydrolyzed the beta-lactam group with piperidine prior to extraction improved recoveries. Antibiotic extraction efficiencies from cattle manure, determined using reverse phase HPLC tandem MS-MS analyses after preservation and extraction, will be presented in full.

Authors


Andrea Yarberry, Beltsville Agricultural Research Center, ORISE Participant, United States Department of Agriculture, ayarberry@gmail.com

Rice, Clifford (Agricultural Research Center, Sustainable Agricultural Systems Laboratory, United States Department of Agriculture, Beltsville, MD, USA); Poindexter, Carlton (Department of Environmental Science and Technology, University of Maryland, College Park, MD, USA); Lansing, Stephanie (Department of Environmental Science and Technology, University of Maryland, College Park, MD, USA)

Acknowledgements

This research was supported in part by an appointment to the Agricultural Research Service (ARS) Research Participation Program administered by the Oak Ridge Institute for Science and Education (ORISE) through an interagency agreement between the U.S. Department of Energy (DOE) and the U.S. Department of Agriculture (USDA). ORISE is managed by ORAU under DOE contract number DE-SC0014664. All opinions expressed in this paper are the author’s and do not necessarily reflect the policies and views of USDA, ARS, DOE, or ORAU/ORISE.


The authors are solely responsible for the content of these proceedings. The technical information does not necessarily reflect the official position of the sponsoring agencies or institutions represented by planning committee members, and inclusion and distribution herein does not constitute an endorsement of views expressed by the same. Printed materials included herein are not refereed publications. Citations should appear as follows. EXAMPLE: Authors. 2019. Title of presentation. Waste to Worth. Minneapolis, MN. April 22-26, 2019. URL of this page. Accessed on: today’s date.
A National Assessment of the Environmental Impacts of Beef Cattle Production

Environmental effects of cattle production and the overall sustainability of beef have become national and international concerns. Our objective was to quantify important environmental impacts of beef cattle production throughout the United States. This provides baseline information for evaluating potential benefits of alternative management practices and mitigation strategies for improving the sustainability of beef.

What did we do?

Surveys and visits of farms, ranches and feedlots were conducted throughout seven regions of the United States (Northeast, Southeast, Midwest, Northern Plains, Southern Plains, Northwest and Southwest) to determine common practices and characteristics of cattle production. These data along with other information sources were used to create about 150 representative production systems throughout the country, which were simulated with the Integrated Farm System Model using local soil and climate data. The simulations quantified the performance and environmental impacts of beef cattle production systems within each region. A farm-to-gate life cycle assessment was used to determine resource use and emissions for all production systems including traditional beef breeds and cull animals from the dairy industry. Regional and national totals were determined as the sum of the production system outputs multiplied by the number of cattle represented by each simulated system.

What we have learned?

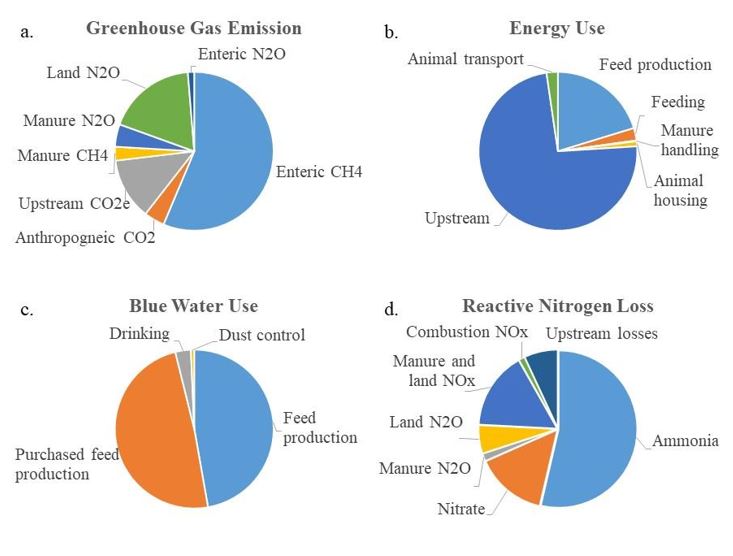
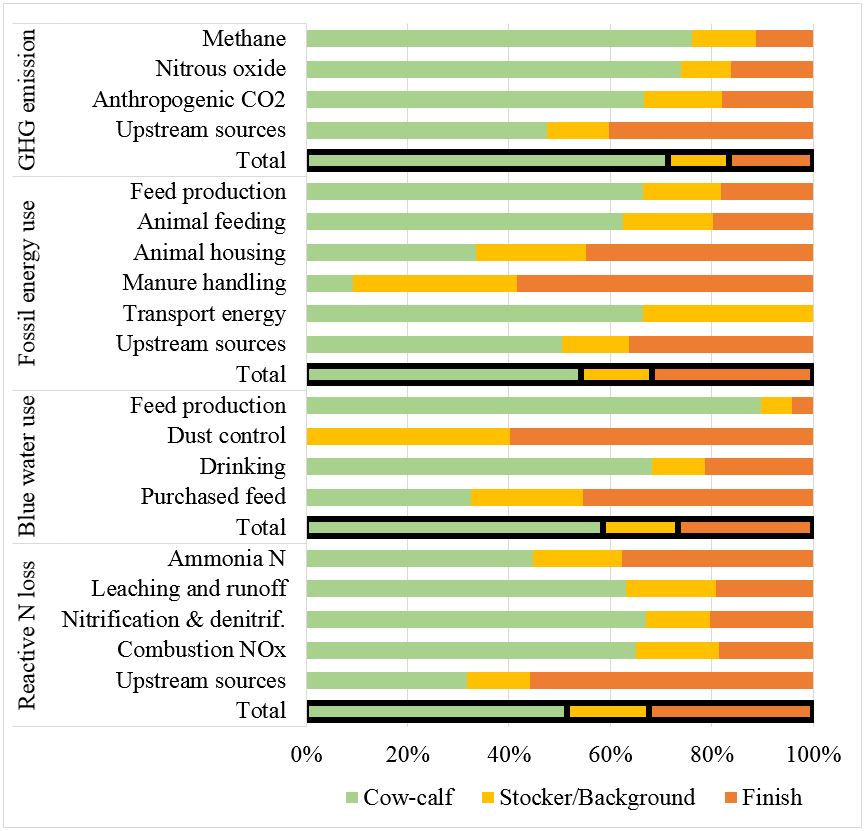
Average annual greenhouse gas emission related to beef cattle production was determined as 268 ± 29 million tons of carbon dioxide equivalent, which is approximately 3.3% of the reported total U.S. emission. Fossil energy use was 539 ± 50 trillion BTU, which is less than 1% of total U.S. consumption. Non-precipitation water use was 6.2 ± 0.9 trillion gallons, which is on the order of 5% of estimated total fresh water use for the country. Finally, reactive N loss was 1.9 ± 0.15 million ton, which indicates about 15% of the gaseous emissions of reactive N for the nation are related to beef cattle production. Expressed per lb of carcass weight produced, these impacts were 21.3 ± 2.3 lb CO2,e, 21.6 ± 2.0 BTU, 0.155 ± 0.012 lb N and 244 ± 37 gal for carbon, energy, reactive N and water footprints, respectively. Many sources throughout the production system contributed to these footprints (Figure 1). The majority of most environmental impacts was associated with the cow-calf phase of production (Figure 2).

Distribution of the major sources for each environmental footprint.
Figure 1. Distribution of the major sources for each environmental footprint.
Figure 2. Distribution of the sources of each environmental impact across the three major phases in the life cycle of beef cattle production.

Take-home message: This study is the most detailed, yet comprehensive, study conducted to date that provides baseline measures for the sustainability of U.S. beef.

Future plans

These farm-to-gate values are being combined with sources in packing, processing, distribution, retail, consumption and waste handling to produce a full life cycle assessment of U.S. beef considering additional metrics of environmental and economic impact. Further work is ongoing to complete this full LCA and to more fully assess opportunities for mitigating environmental impacts and improving the sustainability of beef.

Authors

Alan Rotz, USDA-ARS; Senorpe Asem-Hiablie, USDA-ARS; Sara Place, National Cattlemen’s Beef Association; Greg Thoma, University of Arkansas.

Additional information

Information on the Integrated Farm System Model is available in the reference manual:

Rotz, C., Corson, M., Chianese, D., Montes, F., Hafner, S., Bonifacio, H., Coiner, C., 2018. The Integrated Farm System Model, Reference Manual Version 4.4. Agricultural Research Service, USDA. https://www.ars.usda.gov/ARSUserFiles/80700500/Reference%20Manual.pdf.

Further information on the national assessment of the environmental impacts of U.S. cattle production is available in:

Rotz, C. A., S. Asem-Hiablie, S. Place and G. Thoma. 2019. Environmental footprints of beef cattle production in the United States. Agric. Systems 169:1-13.

Acknowledgements

This work was funded in part by The Beef Checkoff and the USDA’s Agricultural Research Service. USDA is an equal opportunity provider and employer.

The authors are solely responsible for the content of these proceedings. The technical information does not necessarily reflect the official position of the sponsoring agencies or institutions represented by planning committee members, and inclusion and distribution herein does not constitute an endorsement of views expressed by the same. Printed materials included herein are not refereed publications. Citations should appear as follows. EXAMPLE: Authors. 2019. Title of presentation. Waste to Worth. Minneapolis, MN. April 22-26, 2019. URL of this page. Accessed on: today’s date.