
Thermal and Electrical Energy and Water Consumption in a Midwest Dairy Parlor

The typical dairy farm uses a large amount of energy during milking activities. This is due to the frequency of milking and the energy intensive nature of harvesting milk, keeping it cool, and cleaning the equipment with hot water. Renewable energy systems generally become more economically efficient as the amount of energy used increases, making dairy farms a great place to incorporate renewable energy.

Dairy farms have not typically been set up with energy efficiency in mind and often use relatively expensive fuel sources like heating oil or propane to heat water. One of the difficulties encountered with renewable energy systems is the intermittent generation of wind and solar energy, whereas the energy load on a dairy farm is very consistent since cows are typically milked twice or three times every day (very large dairies may milk continuously). An efficient way to store energy has long been sought to tie energy production and consumption together. A dairy farm’s need for both electricity and heat provides an ideal situation to generate electrical energy on-site to meet current electrical load requirements, displace conventional thermal fuels with electrical energy, and evaluate thermal storage as a solution to the time shifting of wind and solar electrical generation.

What did we do?

The dairy operation at the University of Minnesota West Central Research and Outreach Center in Morris milks between 200 and 275 cows twice daily and is representative of a mid-size Minnesota dairy farm. The cows are split almost evenly between a conventional and a certified organic grazing herd, and all cows spend the winter outside in lots near the milking parlor. The existing dairy equipment is typical for similarly sized dairy farms and includes none of the commonly recommended energy efficiency enhancements such as a plate cooler, refrigeration heat recovery, or variable frequency drives for pump motors. The WCROC dairy provides an ideal testing opportunity to evaluate and demonstrate the effect of on-site renewable energy generation and energy efficient upgrades on fossil fuel consumption and greenhouse gas emissions (Figure 1).

Heat pumps, electric water heaters, and thermal storage at the University of Minnesota Morris
Figure 1. Renewable energy upgrades that include new heat pumps, electric water heaters, and thermal storage tank at the University of Minnesota WCROC Dairy in Morris, MN.

A data logger was installed in the utility room of the milking parlor in August 2013 to monitor 18 individual electric loads, 12 water flow rates, 13 water temperatures, and two air temperatures. Average values were recorded every 10 minutes for the last 4 years. The milking parlor has gas and electric meters that measure the total consumption of natural gas and electricity within the parlor. The data helped us evaluate energy and water usage of various milking appliances. Some small energy loads were not measured in unused parts of the barn, or for equipment not directly related to the milking operation. These small and miscellaneous loads were estimated by subtracting monitored energy use from the total energy use.

Baseline measurements were collected at the WCROC dairy and overall, the milking parlor currently consumes about 250 to 400 kWh in electricity and uses between 1,300 and 1,500 gallons of water per day (Figures 2 and 3). The parlor currently uses about 110,000 kWh per year (440 kWh per cow per day) in electricity and 4,500 therms per year in natural gas. A majority of the electricity (26 percent) is used for cooling milk , with ventilation, fans and heaters  utilizing 16 percent. The dairy uses about 600 gallons of hot water per day, with a majority used for cleaning and sanitizing milking equipment (57%), followed closely by cleaning the milking parlor (27%). Energy and water usage fluctuates throughout the year; the dairy calves 40 percent of the cows from September to December and 60 percent from March to May. Therefore, water and energy use escalates dramatically during April.

The first energy efficiency upgrade was the installation of a variable frequency drive for the vacuum pump in September 2013. Prior to the upgrade, the vacuum pump used 55 to 65 kWh per day. Following installation, electrical consumption by the vacuum pump decreased by 75% to just 12 kWh per day. This data provides a vivid example of the significant energy savings that can be achieved with relatively simple upgrades.

Because the dairy operates both  organic and conventional systems, two bulk tank compressors are used: one scroll and one reciprocating. The scroll compressor is the newest and uses 15 kWh per day versus 40 kWh per day for the reciprocating compressor. Based on milk production, the scroll compressor costs $0.73 per kWh per cwt. versus $1.08 per kWh per cwt. for the reciprocating compressor, indicating that the scroll compressor is more efficient. In terms of fossil fuel consumption, milk harvesting consumed more energy than feeding and maintenance.  

Pie Chart: Electrical usage by equipment component for 2016.
Figure 2. Electrical usage by equipment component for 2016.
Pie chart: Hot water usage by activity during 2016
Figure 3. Hot water usage by activity during 2016

During the fall of 2016, a TenKSolar Reflect XTG 50 kW DC array was installed. The annual production from this solar PV system was projected to be 70,000 kWh. At a total cost of $138,000 ($2.77/W) for the solar system,  a 19.7-year simple payback without incentives was predicted. Adding the “Made in Minnesota” incentives would reduce the payback period to 8.6 years.

In 2017, two 10-kW VT10 wind turbines from Ventera were installed. These turbines are a three blade, downwind turbine model, each with an annual predicted generation of 22,400 kWh. The wind system cost was $156,800 ($78,400 per tower) with a 35-year simple payback without incentives. With the 30% federal credit, each turbine would have a 24.5-year payback.

What we have learned?

Our study suggests that fossil energy use per unit of milk could be greatly reduced by replacing older equipment with new, more efficient technology or substituting renewable sources of energy into the milk harvesting process. To improve energy efficiency, begin with an audit to gather data and identify energy-saving opportunities. Some energy efficiency options that may be installed on dairy farms include refrigeration heat recovery, variable frequency drives, plate coolers, and more efficient lighting and fans. A majority of these upgrades have immediate to two- to five-year paybacks. Make all electrical loads as efficient as possible, yet practical. Consider converting all thermal loads to electricity by the use of heat pumps that allow for cooling of milk. In the future, we have plans to harvest energy from our manure lagoon and store electricity as heat by use of heat pumps. Renewable energy options also can improve energy efficiency.

Solar panels
Figure 4. 50 kW solar array at the University of Minnesota WCROC Dairy, Morris, MN

Future Plans

We will continue to monitor the WCROC dairy and make renewable energy upgrades. We have begun monitoring the two 10-kW wind turbines, and installed a new 30-kW solar array in the WCROC pastures for renewable energy production. Additionally, we will evaluate the cow cooling potential of solar systems in the grazing dairy system at the WCROC. This study is the first step toward converting fossil fuel-based vehicles used in dairy farms to clean and locally produced energy. The knowledge and information generated will be disseminated to agricultural producers, energy professionals, students, and other stakeholders.

Authors

Brad Heins, Associate Professor, Dairy Management, hein0106@umn.edu

Mike Reese, Director of Renewable Energy

Eric Buchanan, Renewable Energy Scientist

Mickey Cotter, Renewable Energy Junior Scientist

Kirsten Sharpe, Research Assistant, Dairy Management

Additional information

We have developed a Dairy Energy Efficiency Decision Tool to help provide producers a quick way to estimate possible energy and costs savings from equipment efficiency upgrades. The tool can be used to quickly see what areas of a dairy operation may provide the best return on investment. Furthermore, we have developed a U of MN Guidebook for Optimizing Energy Systems for Midwest Dairy Production. This guidebook provides additional information about the topics that were discussed in this article, as well as the decision tool. More information may be found at https://wcroc.cfans.umn.edu/energy-dairy

Acknowledgements

To complete our goals, we have secured grants from the University of Minnesota Initiative for Renewable Energy and the Environment (IREE), the Minnesota Rapid Agricultural Response Fund, and the Xcel Energy RDF Fund.

The authors are solely responsible for the content of these proceedings. The technical information does not necessarily reflect the official position of the sponsoring agencies or institutions represented by planning committee members, and inclusion and distribution herein does not constitute an endorsement of views expressed by the same. Printed materials included herein are not refereed publications. Citations should appear as follows. EXAMPLE: Authors. 2019. Title of presentation. Waste to Worth. Minneapolis, MN. April 22-26, 2019. URL of this page. Accessed on: today’s date.
Carbon, Water, and Land Use for Pork Production when Modifying Type and Regional Sourcing of Feed Ingredients

Providing animal protein to tomorrow’s nine billion people will be a challenge given the associated environmental pressures with animal production, particularly issues such as greenhouse gas (GHG) emissions, human health and water usage/quality. Globally, livestock production systems contribute 14.5% to the total human-induced emissions of greenhouse gases (FAO, 2013). Animal feed is a major component of these impacts with the composition of animal diets having important downstream effects (i.e. GHG emissions, animal productivity, animal health, product safety and quality and animal welfare) as well as upstream effects on water quality, GHG emissions, land use and energy consumption (Makkar, 2016). Despite these effects, feeding programs for swine largely only focus on cost minimization and productivity (Dubeau et al. 2011; Pomar et al. 2007). Finding ways to produce animal protein while reducing the environmental impacts is vital to maintaining the long-term economic viability and cultural significance of this industry.

Pork, and the meat industry in general, has downstream pressure from customers to decrease environmental impacts. Major food companies have initiated supply chain management programs to minimize their carbon footprint in response to consumer demands and societal concerns. Within pork production, feed grains and manure management are the two largest contributors to GHG emissions, water use and land use (Matlock et al., 2014; Thoma et al., 2011). However, there is high variability in agricultural production systems and the associated environmental impacts across these locations (Yang and Heijung 2016; Hellweg and Canals, 2014). There is further variability across space due to the large differences in manure management practices, climate conditions and fuel mixes employed in U.S. counties and processing facilities. While research has been done on characterizing the average environmental impacts across the U.S. (Thoma et al 2011; Macleod et al 2013), and for particular production systems on a specific farm (or on average) (Bandekar et al 2014), this substantial variability across the U.S. can significantly affect specific supply chain environmental impacts.

What did we do?

The US pork industry is not a homogenous group of producers (in location, size, or even feed inputs) and therefore providing one single LCA number for the entire industry is incomplete. To capture this variability we used the Food Systems Sustainable Supply-chain model (FoodS3) that uses county level environment impacts of corn production, rather than using a single national average estimate. We also added spatial difference in manure impacts by estimating the volatile solids excreted in manure by the three regional feeding programs using county specific manure management practices. Using these estimates, we calculated the water and land use impacts of corn feed inputs in regional pig feeding programs, as well as the GHG impacts from corn feed inputs and manure emissions. We ran these calculations for four feed programs including: 1) the use of corn distillers dried grains with solubles (DDGS) and 2) dehydrated retail level food waste, as approaches for recycling nutrients back into pig feed; as well as 3) the use of synthetic amino acids (AA) and 4) enzymes (i.e. phytase), as back-end diet supplementation strategies for minimizing the environmental impact of pork production.

What have we learned?

The inclusion of county level spatial environmental impact data and supply chain connections are significant to this work. Location matters, not just in regional diet mixes, but also in environmental impacts of sourcing ingredients and manure management. With the FoodS3 model is was possible to bring in modeled supply relationships in environmental impact analysis. Similarly, having food waste data nutrient analyses available to test a food waste diet added in a hypothetical “future technology” for pig food that has not been extensively studied.

We found that using the food waste feeding program resulted in the lowest corn input greenhouse gas emissions totals compared with all other feeding programs evaluated in this study. However, for all GHG emissions, the control feeding program had the lowest GHG emissions. While use of synthetic amino acids decreased excretion of volatile solids in manure, it resulted in the greatest greenhouse gas emissions. These emissions are the result of proportionally greater use corn in the synthetic amino acid diets than any other diet (more corn was required to ensure that the diet met the Nutrient Requirement for Swine (NRC, 2012) in our modeled diets). The impact of feeding program on greenhouse gas emissions also varied among geographic regions, where the Mid-West region had the least per pig emissions regardless of the type of diets used in the feeding program. This variation is primarily due to the spatially different emissions of feed ingredients estimated with our FoodS3 model. As expected, water and land use were least for the feeding program based on food waste, while using synthetic amino acids in diets resulted in the greatest water and land use per pig produced.

Future plans

While this study was an important step in bringing spatial heterogeneity to understanding the environmental impacts of pig diets, further work should consider diets with combinations of our alternative ingredients. Most commercially available pig diets already include synthetic AA and inorganic phosphorus (P), and many include DDGS. Furthermore, the diets may have regional variations in more than just corn and soy (which we accounted for), but also in some of our alternative ingredients, such as DDGS and food waste. Future research is needed to compare the environmental impacts of these diets to one that includes food waste as well as examine different rates of inclusion for food waste.

Authors

Jennifer Schmitt1*, Pedro Urriola2, Jae Cheol Jang3; Gerald Shurson4

1 Program Director and Lead Scientist, NorthStar Initiative for Sustainable Enterprise, Institute on the Environment, UMN jenniferschmitt@umn.edu

2 Research Assistant Professor, Department of Animal Science, UMN

3 Post-doctoral Associate Department of Animal Science, UMN

4 Professor-Swine Nutrition, Department of Animal Science, UMN

* Corresponding Author

Additional Information

Bandekar, P. et al., 2014. Life cycle analysis of swine management practices. San Francisco, Proceedings of the 9th International Conference on Life Cycle Assessment in the Agri-Food Sector.

Dubeau, F., Julien, P.-O., & Pomar, C. (2011). Formulating diets for growing pigs: economic and environmental considerations. Annals of Operations Research, 190(1), 239–269. https://doi.org/10.1007/s10479-009-0633-1

FAO. (2013). Food Wastage Footprint: Impacts on Natural Resources—Summary Report. Rome. Retrieved from http://www.fao.org/docrep/018/i3347e/i3347e.pdf

Hellweg, S. & Canals, L., 2014. Emerging approaches, challenges and opportunities in life cycle assessment. Science, 344(6188), pp. 1109-1113.

Macleod, M. et al., 2013. Greenhouse gas emissions from pig and chicken supply chains – a global life cycle assessment, Rome: Food and Agriculture Organization of the United Nations.

Matlock, M., Greg Thoma, B., Eric Boles Mansoor Leh, P., Sandefur Rusty Bautista, H., & Rick Ulrich, P. (2014). A Life Cycle Analysis of Water Use in U.S. Pork Production Comprehensive Report.

Pomar, C., Dubeau, F., Létourneau-Montminy, M.-P., Boucher, C., & Julien, P.-O. (2007). Reducing phosphorus concentration in pig diets by adding an environmental objective to the traditional feed formulation algorithm. Livestock Science, 111(1), 16–27. https://doi.org/10.1016/j.livsci.2006.11.011

Thoma, G., Nutter, D., Ulrich, R., Charles, M., Frank, J., & East, C. (2011). National Life Cycle Carbon Footprint Study for Production of US Swine, 1–75.

Yang, Y. & Heijungs, R., 2016. A general computation structure for regional life-cycle assessment. International Journal of Life Cycle Assessment, pp. 1-9.

Acknowledgements

Funding, in part, was provided by the National Pork Checkoff.

The authors are solely responsible for the content of these proceedings. The technical information does not necessarily reflect the official position of the sponsoring agencies or institutions represented by planning committee members, and inclusion and distribution herein does not constitute an endorsement of views expressed by the same. Printed materials included herein are not refereed publications. Citations should appear as follows. EXAMPLE: Authors. 2019. Title of presentation. Waste to Worth. Minneapolis, MN. April 22-26, 2019. URL of this page. Accessed on: today’s date.

Impact of Animal Manure and Organic Biosolids on Properties Contributing to Soil Health

The high concentration of organic carbon (C) and plant essential nutrients in manure and organic biosolids make them excellent fertilizers. However, manure is greatly underutilized as a fertilizer; only about 22% of the manure produced worldwide is applied as fertilizer (FAO 2018). This underutilization can yield regional nutrient imbalances when inorganic fertilizers are imported to meet crop nutrient needs that locally produced fertilizers could supply. However, with this challenge comes opportunity as the campaign to improve agricultural soil health has gained momentum among conservationists and researchers worldwide. Thus, a comprehensive assemblage of outcomes from manure and soil health-related research studies is important. Particularly, the identification of knowledge gaps is an important step to direct future research that informs soil health improvement outreach programs.

What did we do?

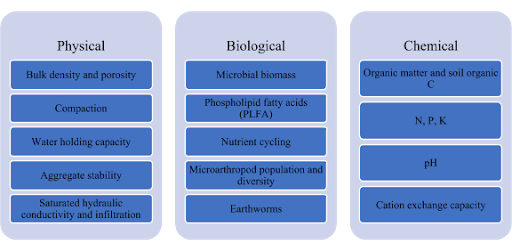
 Soil health properties included in systematic literature review related to livestock manure and organic biosolids.
Figure 1. Soil health properties included in systematic literature review related to livestock manure and organic biosolids.

We conducted a systematic literature review based on peer-reviewed studies that evaluated the effect of livestock manure and organic biosolids on soil health properties. Soil health properties included in the review are shown in Figure 1. All studies included had to be replicated field trials written in English where manure or organic biosolid application was the only differing factor between treatments. Additionally, included data had to be statistically analyzed to compare organically amended treatments to a control. A total of 163 studies met all criteria.

What have we learned?

Overall, manure and biosolid applications have the potential to improve the health of agricultural soils. These organic amendments add significant amounts of organic C to soil, which has positive effects on other soil health metrics. When compared to inorganic fertilizers, soils that have had application of livestock manure or organic biosolids have the following properties:

Physical
decreased bulk density
more resistant to compaction, especially when wet
increased water holding capacity (WHC) in fine-textured soils with no effect in course textured soils
varied effect on aggregate stability
increased saturated hydraulic conductivity and infiltration
Biological
increased microbial biomass C and microbial biomass N
increased bacterial and fungal populations but no effect on diversity as measured by PLFA
increased microbial respiration and potential N mineralization
no change in microarthropod population and diversity
increased earthwork population
Chemical
increased soil organic C and soil organic matter, in general
varied effect on soil NPK; depends on study methodology (application rate and timing, amendment type, etc.)
varied effect on pH; depends on initial soil pH, amendment pH, and application rate
increased cation exchange capacity due to increased soil organic C

Future Steps

The evaluation of the impact of manure and biosolids on soil health properties is difficult to do based on current literature because 1) there are inconsistent research methodologies between individual research studies, and 2) there are few comprehensive studies that have included all soil health properties. Improvements in research methodologies needs to be improved to fill substantial knowledge gaps identified with this review. Specifically, future research should: (1) quantify soil biological metrics, (2) investigate the short- and long-term effects of a single application of manure or biosolids, (3) study nutrient application balance on an annual or multi-year basis, and (4) discuss how research findings translate into management decisions relevant to agricultural crop producers.

Authors

Corresponding Author: Linda Schott, Assistant Professor/ Extension Specialist- Nutrient and Waste Management, University of Idaho, lschott@uidaho.edu

Other Authors: Amy Schmidt, Associate Professor/ Livestock Bioenvironmental Engineer, University of Nebraska-Lincoln; Humberto Blanco-Canqui, Associate Professor, University of Nebraska-Lincoln

Additional Information

FAO. (2018). Nitrogen inputs to agricultural soils from livestock manure. New statistics. Integrated Crop Management (Vol. 24). Rome, Italy

More information on this project can be found at: https://soilhealthnexus.org/resources/manure-and-soil-health/

Acknowledgements

This project was supported by funding from the North Central Region Water Network and the Soil Health Institute. The authors would also like to thank Mara Zelt and Ashley Schmit for their assistance.


The authors are solely responsible for the content of these proceedings. The technical information does not necessarily reflect the official position of the sponsoring agencies or institutions represented by planning committee members, and inclusion and distribution herein does not constitute an endorsement of views expressed by the same. Printed materials included herein are not refereed publications. Citations should appear as follows. EXAMPLE: Authors. 2019. Title of presentation. Waste to Worth. Minneapolis, MN. April 22-26, 2019. URL of this page. Accessed on: today’s date.

Impact of Biochar on Nitrogen Cycling: Impact of Oxidation and Application to Filter Strips

Biochar has been shown to have the ability to affect nitrogen cycling in soils. In this study, we investigated the impact of adding biochar to filter strip plots to understand the impact on nitrogen leaching, particularly in the form of nitrate. In addition, we examined additions of biochar to soil columns to determine the mechanism for reductions in leaching and to assess the impacts to nitrous oxide emissions.  

What did we do?

grass
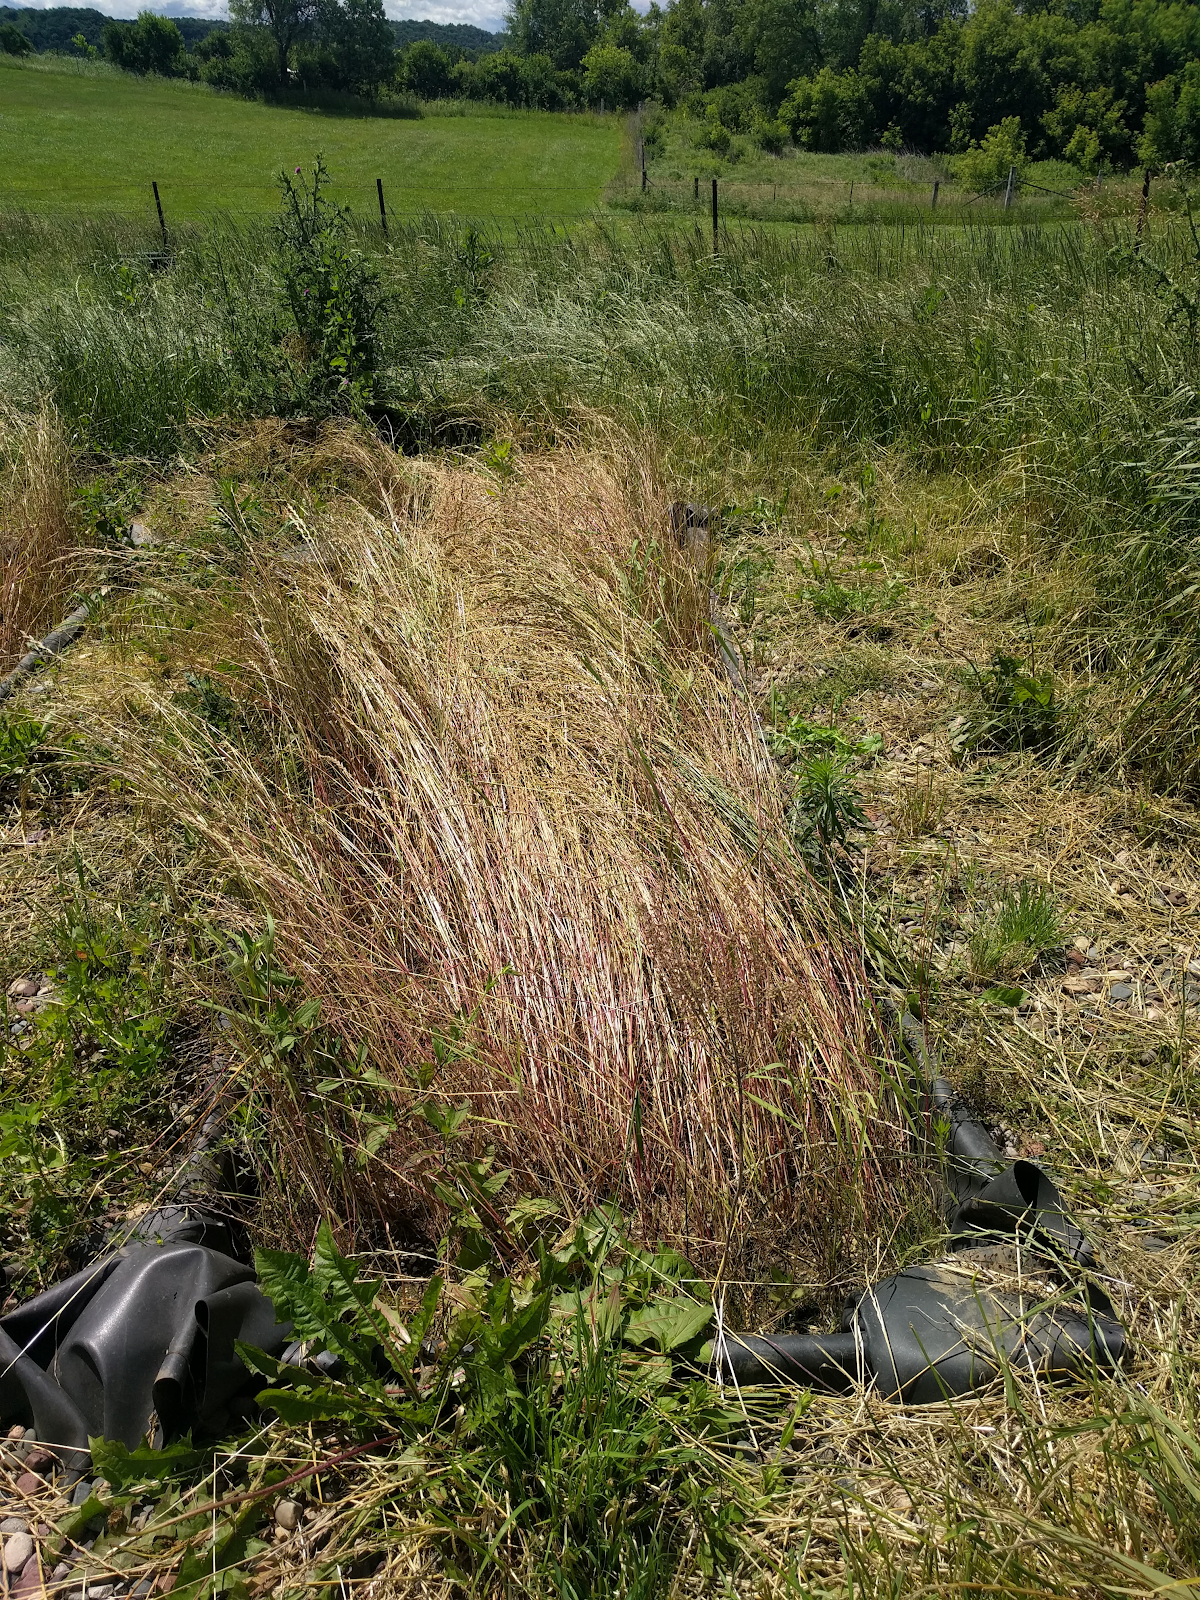
Figure 1: Filter strip plots with vegetation receiving silage runoff with collection of surface and subsurface water samples

We conducted three studies to investigate the impact of biochar to nitrogen cycling. First, we developed filter strip plots where we added biochar to the soil matrix in three of six plots. We then applied bunker silage storage runoff ( containing nitrogen) to the plots and determined the forms and quantities of nitrogen leaching through the soil profile. Second, we oxidized biochar and completed sorption studies to determine if oxidation of biochar plays a role in nitrate sorption. Third, we conducted soil column experiments to determine if biochar impacted mineralization rates, nitrification and/or denitrification in soil systems when synthetic wastewater containing nitrogen was applied.

What have we learned?

We have found that biochar does impact nitrogen leaching. When added to filter strip plots, it reduced total nitrogen and nitrate leaching. In addition, oxidation of biochar was found to have an impact to nitrate sorption. Finally, when biochar is applied to soil columns it not only reduces nitrate leaching but also reduces nitrous oxide emissions.

Future plans

We plan to further investigate biochar applications to reduce nitrogen losses to the environment.

Authors

Rebecca A. Larson, Associate Professor, Biological Systems Engineering, University of Wisconsin-Madison, rebecca.larson@wisc.edu

Joseph Sanford, Biological Systems Engineering, University of Wisconsin-Madison

Acknowledgements

This material is based on work that is supported by the National Institute of Food and Agriculture, U.S. Department of Agriculture, under award number 2015-67019-23573 and 2017-67003-26055.


The authors are solely responsible for the content of these proceedings. The technical information does not necessarily reflect the official position of the sponsoring agencies or institutions represented by planning committee members, and inclusion and distribution herein does not constitute an endorsement of views expressed by the same. Printed materials included herein are not refereed publications. Citations should appear as follows. EXAMPLE: Authors. 2019. Title of presentation. Waste to Worth. Minneapolis, MN. April 22-26, 2019. URL of this page. Accessed on: today’s date.
Nutrient Leaching Under Manure Staging Piles

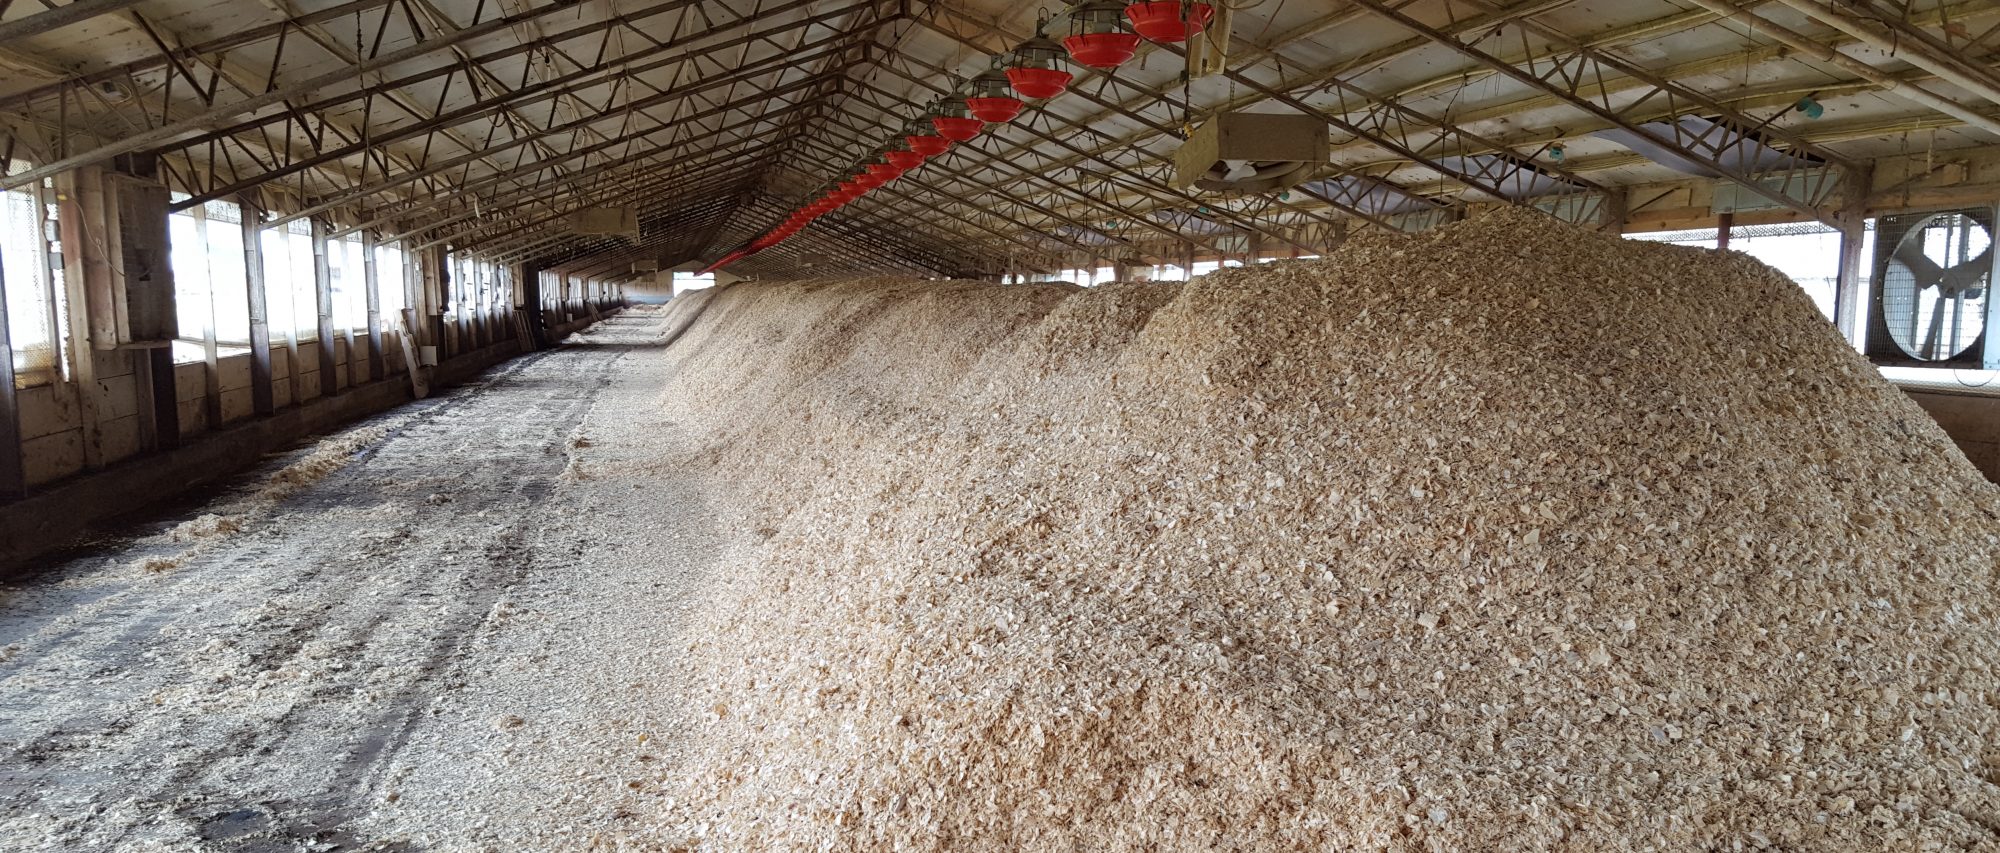
For many livestock producers, manure storage capacity is limited.  Severe weather events can intensify the manure storage capacity limitations.  One option available to producers is to haul manure to the field and place it in manure staging areas.  This can reduce the manure storage capacity needed at the livestock facility, and reduce manure hauling time in the spring.  Hauling of manure to manure staging areas is typically done when convenient, with little thought about the effect of timing and nutrient loss.  This study examined nutrient loss from manure staging piles placed in November, January, and March over a course of five years.

What Did We Do?

This study compared manure staging areas with manure placed at three different times (November, January, and March) and two different bedding materials (straw, no straw).  

For each placement event (November, January, March) manure from the tie stall barn (straw bedding) and the butterfly sheds (sand bedding) at the Utah State University Caine Dairy was hauled to Cache Junction, UT and placed in manure staging piles.  Composite manure samples were collected from each pile (manure type) at the time of placement, and at removal each year (in the fall after crop harvest) for five years. Manure samples were analyzed for ammonium-nitrogen using Method 12-107-04-1-F on a Lachat Flow Injection Analysis (FIA) analyzer and total N using an Elementar combustion analyzer.  Leachate was collected biweekly by means of zero-tension lysimeters installed under the manure staging areas and analyzed for ammonium-nitrogen using Method 10-107-06-2-O and nitrate-nitrogen using Method 10-107-04-1-R on a Lachat FIA analyzer. Soil samples were taken to a depth of 90 cm and analyzed for nitrate-nitrogen using Method 12-107-04-1-F on a Lachat FIA analyzer.

What Have We Learned?

Figure 1. Total N (mg) in leachate/lysimeter under manure staging piles.

Significant leachate was produced under the manure staging piles placed during the winter months, with the manure with no straw (sand bedding) producing more leachate than the manure with straw (straw bedding).  Manure piles placed in November produced less leachate and lost less total N than those placed in January and March (Figure 1). Due to Utah’s dry climate, this is most likely due to drying of the manure in the late fall months, which enabled the manure to absorb more moisture during the winter months. Manure piles placed in January produced the most leachate and exhibited more total N loss (Figure 2).

Difference in manure Total N% from time of placement to removal for land application.
Figure 2.  Difference in manure Total N% from time of placement to removal for land application.

The snow and snow melt most likely contributed to the large amount of leachate and nitrogen loss observed under the January piles.

Future Plans

The results of this study indicate that straw bedding helps retain the nitrogen in the manure and reduce nitrogen loss from manure placed in manure staging piles.  In addition, in Utah’s dry climate, the timing of manure staging pile placement does affect nutrient loss with placement in late November minimizing nutrient leaching.  This information will be presented to producers, NRCS, DWQ, and other ag professionals.

Authors

Rhonda Miller, Ph.D.; Agricultural Systems Technology and Education Dept.; Utah State University, rhonda.miller@usu.edu

Jennifer Long; Agricultural Systems Technology and Education Dept.; Utah State University

Additional Information

Website:  http://agwastemanagement.usu.edu

Acknowledgements

The authors gratefully acknowledge support from Utah State University Experiment Station.


The authors are solely responsible for the content of these proceedings. The technical information does not necessarily reflect the official position of the sponsoring agencies or institutions represented by planning committee members, and inclusion and distribution herein does not constitute an endorsement of views expressed by the same. Printed materials included herein are not refereed publications. Citations should appear as follows. EXAMPLE: Authors. 2019. Title of presentation. Waste to Worth. Minneapolis, MN. April 22-26, 2019. URL of this page. Accessed on: today’s date.
Environmental Impacts of Dairy Production Systems in the Changing Climate of the Northeast

To meet the nutritional needs of a growing population, dairy producers must increase milk production while minimizing farm environmental impacts. As we look to the future, management practices must also be adapted to maintain production under projected climate change. To plan for the future, better information is needed on practices that can reduce emissions from the farm and adapt to changes in the climate while maintaining or improving production and profitability.

What did we do?

We conducted a comprehensive assessment of the effects of climate change on both the productivity and environmental performance of farms as influenced by strategies to reduce emissions and adapt to the changing climate. Production systems were evaluated using three representative northeastern dairy farms: a 1500-cow farm in New York, a 150-cow farm in Wisconsin and a 50-cow farm in southern Pennsylvania. A cradle-to-farm gate life cycle assessment was conducted using farm-scale process-based modeling and climate projections for high and low emission scenarios. Environmental considerations included the carbon footprint of the milk produced and reactive N and P losses from the farms.

What we have learned?

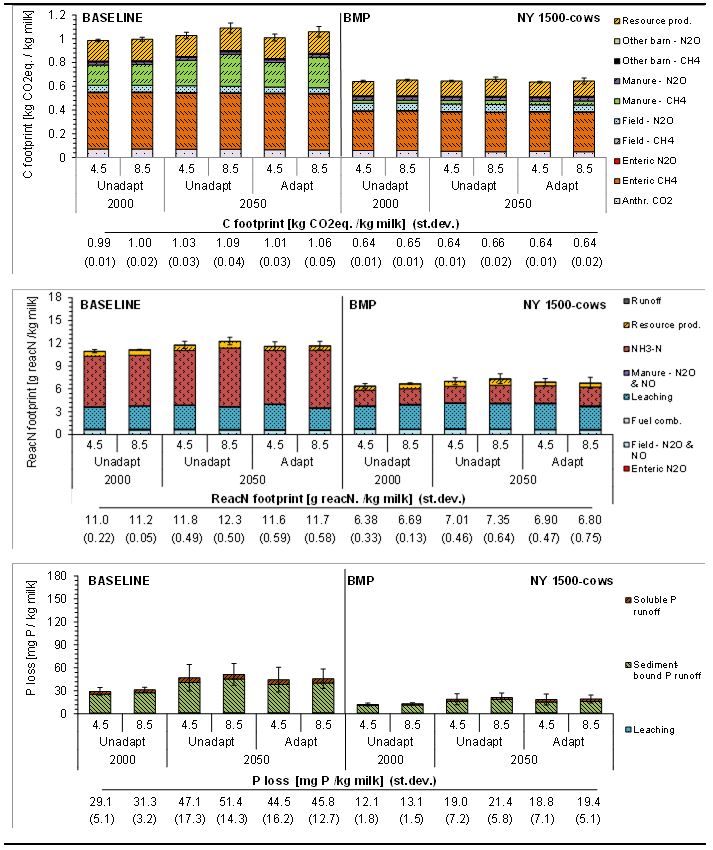
We found that the environmental impact of the three representative dairy farms generally increased in the near future (2050) climate if no mitigation measures were taken. Overall, feed production was maintained as decreases in corn grain yield were compensated by increases in forage yields. Adaptation of the cropping system through changes in planting and harvest dates and corn variety led to a smaller reduction in corn grain yield, but the detrimental effects of climate change could not be fully negated. Considering the increased forage yield, total feed production increased except for the most severe projected climate change. Adoption of farm-specific beneficial management practices substantially reduced the greenhouse gas emissions and nutrient losses of the farms in current climate conditions and stabilized the environmental impact in future climate conditions, while maintaining feed and milk production (See Figure 1 for example results).

Figure 1. Carbon footprint, reactive nitrogen footprint and P loss in recent (2000) and future (2050) climate conditions (RCP4.5 and RCP8.5) for a 1500-cow farm in New York with baseline and Best Management Practice (BMP) scenarios, with and without crop system adaptions in 2050. Error bars represent the standard deviation of IFSM simulations for 3 climate scenarios per RCP. Unadapt = not adapted cropping system. Adapt = adapted cropping system.

The take-home message is that with appropriate management changes, our dairy farms can become more sustainable under current climate and better prepared to adapt to future climate variability.

Future plans

A more comprehensive life cycle assessment is being done by linking the output of the farm model with life cycle assessment software. The process level simulation of the farm provides inventory information for an inclusive life cycle assessment with multiple environmental considerations. This integrated software will provide a more complete sustainability assessment of the potential benefits of alternative management strategies for both now and the future.

Authors

Karin Veltman, University of Michigan; C. Alan Rotz, USDA-ARS; Larry Chase, Cornell University; Joyce Cooper, Washington State University; Chris Forest, Penn State University; Pete Ingraham, Applied GeoSolutions; R. César Izaurralde, University of Maryland; Curtis D. Jones, University of Maryland; Robert Nicholas, Penn State University; Matt Ruark, University of Wisconsin; William Salas, Applied GeoSolutions; Greg Thoma, University of Arkansas; Olivier Jolliet, University of Michigan.

Additional information

Information on the Integrated Farm System Model is available in the reference manual:

Rotz, C., Corson, M., Chianese, D., Montes, F., Hafner, S., Bonifacio, H., Coiner, C., 2018. The Integrated Farm System Model, Reference Manual Version 4.4. Agricultural Research Service, USDA. Available at: https://www.ars.usda.gov/northeast-area/up-pa/pswmru/docs/integrated-farm-system-model/#Reference.

Information on the analysis of Best Management Practices on northeastern dairy farms is available in:

Veltman, K., C. A. Rotz, L. Chase, J. Cooper, P. Ingraham, R. C. Izaurralde, C. D. Jones, R. Gaillard, R. A. Larsson, M. Ruark, W. Salas, G. Thoma, and O. Jolliet. 2017. A quantitative assessment of beneficial management practices to reduce carbon and reactive nitrogen footprints and phosphorus losses of dairy farms in the Great Lakes region of the United States. Agric. Systems 166:10-25.

Acknowledgements

This work was supported by the National Institute of Food and Agriculture, U.S. Department of Agriculture, under award number 2013-68002-20525. Any opinions, findings, conclusions, or recommendations expressed in this publication are those of the authors and do not necessarily reflect the view of the U.S. Department of Agriculture. USDA is an equal opportunity provider and employer.

The authors are solely responsible for the content of these proceedings. The technical information does not necessarily reflect the official position of the sponsoring agencies or institutions represented by planning committee members, and inclusion and distribution herein does not constitute an endorsement of views expressed by the same. Printed materials included herein are not refereed publications. Citations should appear as follows. EXAMPLE: Authors. 2019. Title of presentation. Waste to Worth. Minneapolis, MN. April 22-26, 2019. URL of this page. Accessed on: today’s date.
2019 Webcasts Approved for ARPAS Continuing Education Units

These webcasts have been approved for 1 continuing education unit (each) as part of the American Registry of Professional Animal Scientists (ARPAS) program. To receive CEUs, view a live or archived webcast, complete an evaluation (if available), and contact ARPAS, 217-356-5390 to have the credit applied to your CEU balance. Repeat this process for each webcast being utilized for CEUs.

2019 Webinars

The following webinars require Flash Player (already installed on 98% of browsers) to view. You can go to the archive page and download power point slides and other resources even if you do not have Flash Player installed.

More Webinars…

2018 Webinars

Topics include: Emergency response, treatment technologies, manure foaming, small farm equipment, manure’s impact on soil, manure irrigation, manure pit death, sampling, and biosecurity. More…

2017 Webinars

Topics include: Climate resiliency, avian influenza, side-dressing nitrogen on emerged corn, runoff risk advisory tools, anaerobic digestion, manure handling safety, long-term manure application, and managing edge of field losses.. More…

2016 Webinars

Topics include: Construction and maintenance of manure ponds, antibiotic resistance, manure entomology, NAQSAT, Drones, manure safety and transport, the nutrient recycling challenge, Vermont nutrient management training course, and pathogens. More…

2015 Webinars

Topics include: Manure Apps, Gypsum Bedding, Livestock Housing, Tile Drained Lands, Micro Manure Management, Horse Manure Composting, Uses of Biochar, Thermal Manure-to-Energy Systems, Mortality Management during Avian Influenza, Communication Pathways, Communicating During Controversy. More…

2014 Webinars

Topics include: Capturing Nutrients, Manure as a biofuel, Water Quality Index, Liquid manure nutrients, Carbon credits, Bioaerosols, WOTUS, Biosecurity, Mortality composting, Whole Farm Nutrient management, Winter manure application, Next generation activities. More…

2013 Webinars

Topics include: Risk Management, Waste to Worth, Mono-slope beef barns and research results, Bioavailability of Phosphorus, Capturing Nutrients. More…

2012 Webinars

Topics include: Biofilters, The 4Rs, Microbes, Life-Cycle Assessments, Carbon Footprints, Nitrates, Adaptive Nutrient Managment, Chesapeake Bay, Emergency Management. More…

2011 Webinars

Topics include: Top-dressing manure, Chesapeake Bay, Soil Health, Reducing Odor Risk, Anaerobic Digestion, NMP implementation, NAEMS, Lagoon Closure, Manure Economics, 2011 NPDES CAFO rule. More…

2010 Webinars

Topics include: Cover Crops, Vegetative Environmental Buffers, Mortality Composting, Manure Spills, NAQSAT, Manure on No-Till, SPCC, Ammonia Emissions. More…

2009 Webinars

Topics include: Feeding Strategies, Carbon Footpring, Conserving Nitrogen, AFO Inspection, Mortalities, Air Emissions, Grazing Management. More…

2008 Webinars

Topics include: Market Based Conservation, Antibiotics and Hormones, Dry Manure Housing Systems, Ammonia, Small Farms, Regulations, Manure Management Planner Software. More…

2007 Webinars

Topics include: Integrated Nutrient Management, Manure Application to Legumes, Value of Manure in Land Application, Smithfield Project, Value Added Processing of Manure, Manure Treatment Technologies, Value of Manure in Energy Generation, Vegetative Treatment Systems, and Innovative Manure Treatment Technologies. More…

2006 Webinars

Topics include: CNMP Core Curriculum, Pathogens, EPA CAFO Regulations. More…

Having Trouble?

If you experience difficulty in viewing webinars, please visit our webinar troubleshooting page:

Conservation Practices and Animal Agriculture


Module Home | Importance of Conservation | Conservation Practices in Animal Ag (you are here)

Many conservation practices are available for animal agriculture producers interested in protecting air and water quality, improving soil health or wildlife habitat, and increasing the productivity of animals, pastures, and crops. This module will especially focus on conservation practices impacting water quality with the goal of keeping clean water clean.

Farmers and ranchers can implement conservation practices on their own. They can also seek technical or financial assistance through agencies such as a local Conservation District or USDA Natural Resources Conservation Service (NRCS).

NRCS has developed approximately 160 conservation practice standards at the national level. States have the option of adopting a standard and using the same or more stringent criteria. Farmers should use state-adopted standards whenever available. To find out whether your state has adopted a certain standard, contact your local NRCS office.

Conservation practices relevant to water quality and animal agriculture can be divided into three categories. Clicking the link will take you to a virtual tour website that describes each practice and includes several photos.

Manure
Management

manure storage structure

Land & Pasture Management

stream crossing

Mortality
Management

poultry mortality compost

Conservation Practices Included In Each Virtual Tour

Manure Management

  • Anaerobic Digester (366)
  • Composting Facility (317)
  • Dust Control from Animal Activity on Open Lot Surfaces (Ac.) (375)
  • Feed Management (592)
  • Nutrient Management (590)
  • Roofs and Covers (367)
  • Vegetated Treatment Area (635)
  • Waste Facility Closure (360)
  • Waste Recycling (633)
  • Waste Separation Facility (632)
  • Waste Storage Facility (313)
  • Waste Transfer (634)
  • Waste Treatment (629)
  • Waste Treatment Lagoon (359)

Land & Pasture Management

  • Access Control (472)
  • Cover Crop (340)
  • Critical Area Planting (342)
  • Denitrifying Bioreactor (605)
  • Diversion (362)
  • Fence (382)
  • Filter Strip (393)
  • Grassed Waterway (412)
  • Heavy Use Protection Area (561)
  • Livestock Shelter Structure (576)
  • Prescribed Grazing (528)
  • Riparian Forest Buffer (391)
  • Riparian Herbaceous Cover (390)
  • Saturated Buffer (604)
  • Streambank & Shoreline Protection (580)
  • Stream Crossing (578)
  • Watering Facility (614)

Mortality Management

  • Animal Mortality Facility (316)
  • Emergency Animal Mortality Management (368)

Applying Conservation Practices to Individual Farms

Conservation practices should be implemented on an individual farm basis to ensure they are addressing a natural resource concern and will be effective in the particular farm setting.

Some questions to ask when evaluating whether a conservation practice will be beneficial for an animal agriculture operation:

  • Is the farm a confinement facility or are animals on pasture (or both)?
  • Are confined animals kept under a roof or open lots (or both)?
  • Where are pastured animals housed or fed in the winter?
  • Does the operation include crop land?
  • Are there waterbodies such as streams or ponds on the facility or crop land?
  • How does the farm store or handle manure; as a solid or slurry/liquid?
  • How much manure does the farm produce and where is it currently stored?
  • Are there neighbors nearby? How many and where?
  • Are there environmentally sensitive features on or near the facility? Wells, sinkholes, public parks or public use areas, wildlife, impaired waterbody, or similar features should all be considered.
  • What are the goals of the farmer or rancher? What is important to them and what do they have interest and capacity to implement and manage?

For example, consider these fictional farms. Both have 200 dairy cows and are interested in developing a manure management system. They are both in the same state with similar soil types.

Farm 1: There is a child in college interested in returning to help manage the farm, so future expansion is a strong possibility. The farm has sufficient cropland to use the manure they currently produce as crop fertilizer.

Farm 2: This farm is considering organic production. They do not have much cropland and must export most of their manure to neighboring crop farmers. This farm also has connections to organic crop farmers as well as the nursery and landscape industry.

While both farms have similar characteristics, they have very different goals. Their conservation plans could be very different. Farm 1 is likely to consider an earthen or concrete slurry manure storage structure with the biggest question being how large to make the structure considering a possible expansion in the near future. They are likely to develop a comprehensive nutrient management plan (CNMP) to ensure the cropland base continues to support any future expansion.

Farm 2 may look at manure collection and storage very differently. The cattle may have access to open lots (manure is handled as a solid) or grazing paddocks. Given the off-farm connections and lack of crop land, composting or other ways to generate value-added products may be an option. Marketing manure or exporting it off-farm will be important to this farm’s manure management plans.

Both farms intend to protect natural resources but need to implement different practices to reach their goals.

Previous: Importance of Conservation | Next: (Home) Animal Ag, Manure, and Stewardship

Acknowledgements

These materials were developed by the Livestock and Poultry Environmental Learning Center (LPELC) with funding from the USDA.Natural Resources Conservation Service through an interagency agreement with the U.S. Environmental Protection Agency.
All images on this page, unless otherwise noted, are courtesy of the U.S. Department of Agriculture or USDA NRCS. For questions on this material, contact Jill Heemstra, jheemstra@unl.edu.


The Importance of Conservation in Animal Agriculture


Module Home | Importance of Conservation (you are here) | Conservation Practices in Animal Ag

This page focuses largely on USDA Natural Resources Conservation Service (NRCS) practice standards and how NRCS works with farmers by providing technical and financial assistance. The next section in this module discusses many of the practices relevant to animal agriculture in greater detail.


Why is conservation important in animal agriculture?

Conservation is key for farmers interested in protecting natural resources while producing food, fuel, and fiber from working lands. There are a variety of conservation practices that can be voluntarily implemented to protect natural resources for surrounding ecosystems, community, and future generations. Conservation practices can have both on-farm and off-farm benefits and can be customized to the unique location, soils, and needs of each farm. Conservation practices are site-specific, not one-size-fits-all. They must be planned and installed with the characteristics of the individual site in mind.

Many conservation practices are voluntary and incentivized through technical and financial assistance. If a farm is subject to regulatory oversight, NRCS practice standards may not meet the requirements of state or federal regulations or permits. Producers should double-check those requirements rather than assuming that they will suffice.

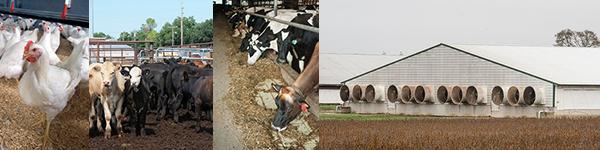
several different types of animal agriculture operations

Photo 1. Animal agriculture operations are very different from farm to farm.

Because manure is one of the largest by-products of animal feeding operations, conservation practices are often designed to increase the farmer’s ability to manage manure as a beneficial resource and reduce risk associated with manure application. Nutrients (whether from manure or from inorganic fertilizer) not taken up by crops can run off from fields or leach to groundwater through rain events or irrigation.

Conservation practices can have beneficial impacts on water quality, wildlife habitat, and air quality. Adopting practices that result in manure applications that are well-timed, at agronomic rates, and away from sensitive locations can help farmers make significant positive contributions to water quality. Conservation practices are important in grazing operations to improve soil and vegetation health and to protect water quality and wildlife habitat. For example, restricting livestock access to a stream or creek reduces the chance the animals will deposit manure or urine in the water, break down stream banks and beds, and/or stir up sediment. Rotational grazing can provide important rest and recovery time for vegetation and allow wildlife cover for nesting or raising their young.

Agencies Involved in Implementing Conservation on Farms

There are several public agencies that cooperate to encourage the use of conservation practices on farms:

USDA Natural Resources Conservation Service (NRCS)

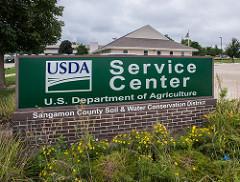
usda service center sign

Photo 2. A local USDA Service Center

USDA NRCS was established in 1935 to work in close partnerships with farmers and ranchers, local and state governments, and other federal agencies to maintain healthy and productive working landscapes on a voluntary, non-regulatory basis. Originally known as the “Soil Conservation Service,” the name was changed to NRCS in 1994 to better reflect the broad scope of the agency’s mission. Learn more about the history of NRCS.

The National Office is located in Washington, DC, and is where national policy, procedures, and conservation practice standards are developed. State offices adopt these standards, either directly, or with changes that make the standards more stringent. The local or district office (Photo 2) works directly with farmers and ranchers to assist them in protecting natural resources by implementing conservation practices on working land. They provide technical and sometimes financial assistance for conservation practices. Learn more about how NRCS is organized.

Video: How to receive conservation assistance from NRCS

Financial assistance for USDA NRCS conservation practices comes from the Farm Bill, a piece of legislation that is developed about every 5 years by Congress. The Farm Bill is traditionally made up of several programs in the areas of food and nutrition assistance, marketing, commodity support, research, conservation, and more. The conservation programs authorized in the 2014 Farm Bill include:

  • Environmental Quality Incentives Program (EQIP)
  • Conservation Stewardship Program (CSP)
  • Agricultural Management Assistance Program (AMA)

Local NRCS offices will help farmers determine if their conservation needs are a fit for financial assistance. Factors that they will consider include:

  • Whether the farm is in a watershed or area designated with a high need for conservation practices
  • Past efforts of the farmer
  • Legislative priorities, such as bioenergy
  • The need to encourage beginning, veteran, and minority farmers

More information on financial assistance is available below (How Do Farmers Access Technical or Financial Assistance for Conservation?)

Conservation Districts

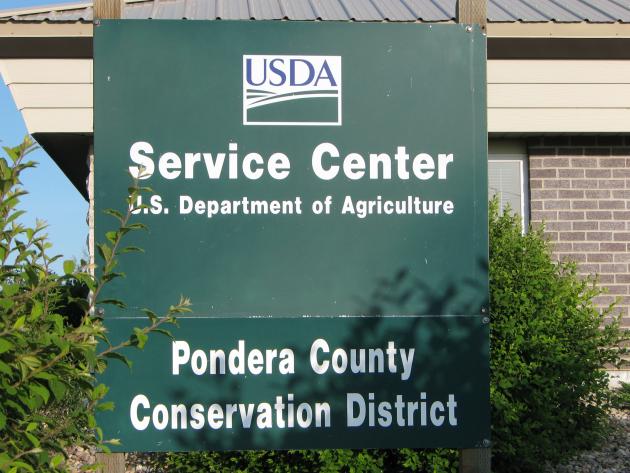
conservation district signPhoto 3. This local conservation district office is located in the same building as the local USDA service center.
Conservation districts are local governmental units responsible for protecting and conserving natural resources in their assigned geographic area. They are governed by a locally-elected board. In some states, they may have a different name, such as soil and water conservation district or natural resource conservation district. There are over 3,000 conservation districts, nationwide.

Conservation districts often partner with NRCS (Photo 3) to work with local farmers, ranchers, and other landowners to implement conservation practices that help address issues of local importance. By working together, NRCS and the districts can more efficiently address conservation needs.

US Environmental Protection Agency

EPA’s role in conservation is primarily regulatory but also includes non-regulatory, voluntary, and incentive-based programs such as the Clean Water Act Section 319 funding. This program provides grants to states and tribes to reduce nonpoint source runoff.

EPA also develops partnerships with industry. One such example is the EPA AgSTAR program, which works with farmers on a voluntary basis to encourage the use of anaerobic digesters for manure treatment and renewable energy generation.

Recommended resource: EPA National Agriculture Center includes information on regulations, compliance assistance, and partnerships.

State Environmental/Water Quality Agencies

sky reflected in water

Photo 4. State environmental agencies are generally tasked with enforcing the Clean Water Act and Clean Air Act.

Many Clean Water Act and other programs that originate with federal statutes are implemented by State, Tribal, and Territorial environmental agencies. Those programs generally work directly with local partners and landowners to develop watershed plans and implement nonpoint source control measures. Those partners often include Conservation Districts for agricultural projects and often utilize resources from multiple agencies and organizations, including USDA. Under Section 319 of the CWA, states, territories, and tribes receive grant money that supports a wide variety of activities to control nonpoint source pollution, including technical assistance, financial assistance, education, training, technology transfer, demonstration projects, and monitoring to assess the success of nonpoint source implementation projects.

Recommended Resource: Nonpoint Source Success Stories features stories about nonpoint source impairments with documented water quality improvements attributable to restoration efforts.

State Agricultural Departments

For the most part State agricultural Departments do not play a direct regulatory role in enforcing the Clean Water Act or Clean Air Act. One major area where state agriculture departments are involved in the implementation of conservation practices are in the case of animal mortality, both routine and catastrophic. Most states have regulations that specify appropriate methods for carcass disposal. State agriculture departments may also develop programs that encourage the use of conservation practices through cost-share, educational outreach, or other methods.

NRCS Conservation Practice Standards

There are over 160 conservation practices for which national standards have been developed. Any that are adopted by a state can be implemented in that state to assist farmers and ranchers with their environmental stewardship efforts. Farmers and ranchers should use the conservation practice adopted by the state, rather than the national standard.

To find your state’s approved practice standards, contact your local NRCS office for assistance.

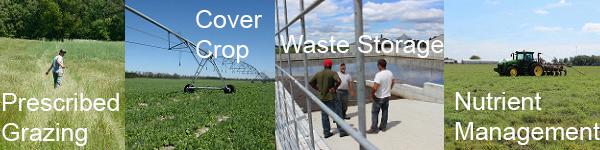
conservation practice collage

Photo 5. Many different conservation practices are used on animal agriculture operations.

What are conservation practice standards?

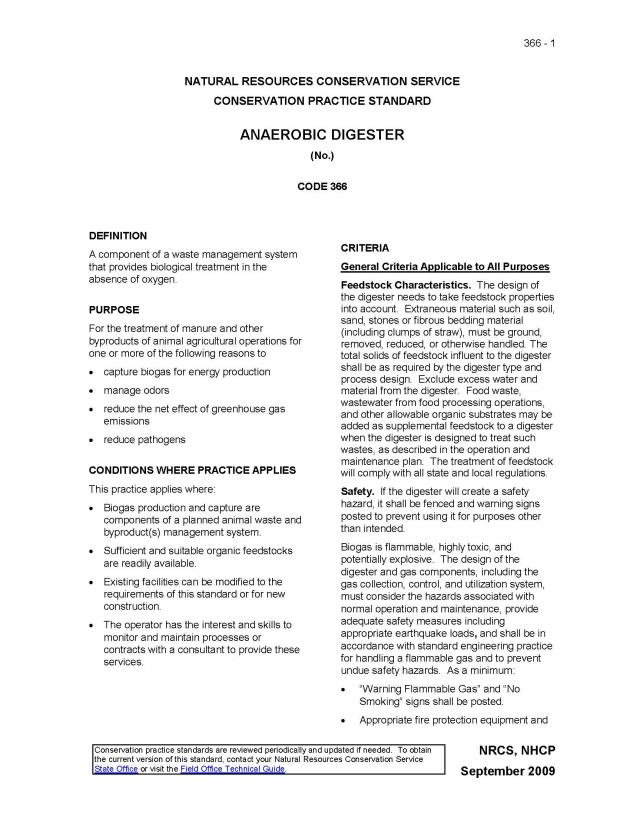
page 1 of the conservation practice standard for anaerobic digester (366)

Photo 6. A screenshot of the Anaerobic Digester conservation practice standard. Click here to download the full-size PDF version.

A conservation practice is defined as: “A specific treatment, such as a structural or vegetative measure, or management techniques, commonly used to meet specific needs in planning and implementing conservation, for which standards and specifications have been developed.”

NRCS conservation practice standards provide guidance for applying conservation practices and set the minimum level for acceptable application of the technology. Each standard is given a number. For example, the standard for “Anaerobic Digester” is #366. Practice standards include information (Photo 6), such as:

  • Purpose: The conservation goal achieved with this practice
  • Where it applies: The type of farm, land use, or situation where the practice is appropriate
  • Criteria: Location, safety considerations, permits needed, management, related conservation practices, and other important considerations

Three categories of conservation practices that apply to animal agriculture include:

  • Manure Management
  • Land and Pasture Management
  • Mortality (Dead Animal) Management

Specific practices and details about each practice are included in the next section, Conservation Practices in Animal Agriculture.

How are standards for practices developed/updated?

Practice standards may be newly identified or change over time based on new science and technology. They are periodically reviewed and updated, usually every 5 years. Any new or updated practice standard is reviewed by technical experts in pertinent fields and is available for review and comment by the public before it is adopted.

NRCS publishes national conservation practice standards in its National Handbook of Conservation Practices (NHCP). If a practice is adopted by a state, the state has some latitude to develop a more stringent or specific version that fits typical conditions or situations in that state.

Recommended Resource: The first 12-13 minutes of the video “Use of NRCS Conservation Practice Standards and Specifications” describes the process of how a new standard may be identified as well as the process used to validate it and the sections included in a standard. It is presented for NRCS staff, but is useful for others that work with farmers who want more background on how a practice standard is developed and what is required to be in a standard.

What is conservation planning?

conservation planning

Photo 7. Conservation planning needs to consider individual farm goals and current conditions.

A conservation plan is a record of the conservation practices implemented on a farm or ranch. It may include sub-plans such as one for grazing management, comprehensive nutrient management, wildlife management, or others.

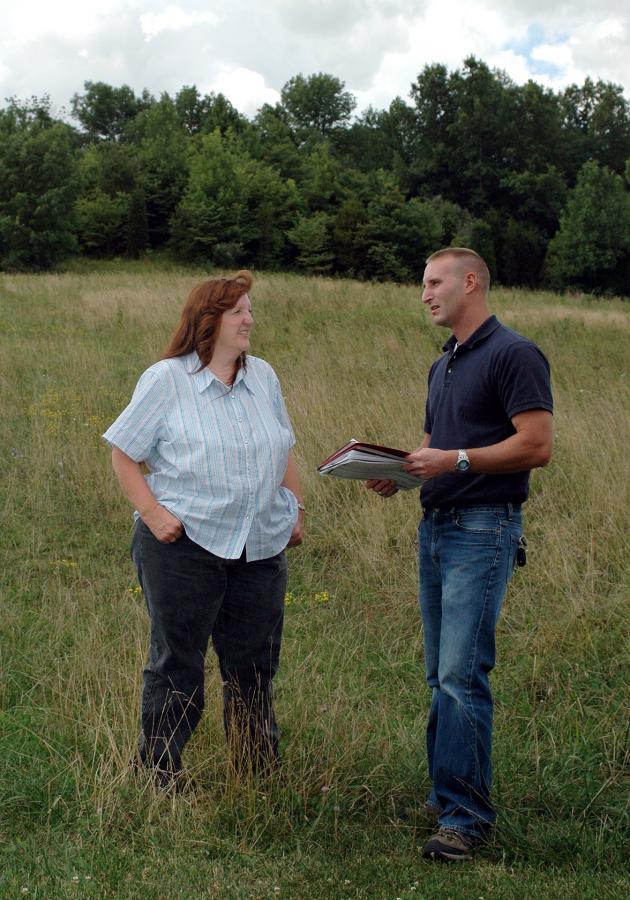
Conservation planning starts with a farmer or rancher recognizing a problem area or wanting to improve some aspect of the farm or ranch. The next step is to contact NRCS. NRCS helps the farmer or rancher review and analyze the current conditions for possible solutions. Depending on the preferences of the client, certain practices may be selected to include in the conservation plan.

Conservation plans are voluntary and are developed by NRCS at no cost.

How do farmers access technical or financial assistance for conservation?

Contact your local NRCS office to access technical assistance in implementing conservation practices. If conservation practices are eligible for financial assistance (cost-share), farmers complete and submit an application. If approved for cost-share, a contract is developed that specifies what will be done, when it will be done, and how much assistance will be provided.

A look at specific practices that can apply to animal agriculture operations is discussed in the next section, Conservation Practices in Animal Agriculture

Previous: (Home) Animal Ag, Manure, and Water Quality | Next: Conservation Practices in Animal Ag

Acknowledgements

These materials were developed by the Livestock and Poultry Environmental Learning Center (LPELC) with funding from the USDA.Natural Resources Conservation Service through an interagency agreement with the U.S. Environmental Protection Agency.
All images on this page, unless otherwise noted, are courtesy of the U.S. Department of Agriculture or USDA NRCS. For questions on this material, contact Jill Heemstra, jheemstra@unl.edu.
 

2018 Webcasts Approved for ARPAS Continuing Education Units

These webcasts have been approved for 1 continuing education unit (each) as part of the American Registry of Professional Animal Scientists (ARPAS) program. To receive CEUs, view a live or archived webcast, complete an evaluation (if available), and contact ARPAS, 217-356-5390 to have the credit applied to your CEU balance. Repeat this process for each webcast being utilized for CEUs.

2018 Webcasts

The following webcasts require Flash Player (already installed on 98% of browsers) to view. You can go to the archive page and download power point slides and other resources even if you do not have Flash Player installed.

More Webcasts…

2017 Webcasts

Topics include: Climate resiliency, avian influenza, side-dressing nitrogen on emerged corn, runoff risk advisory tools, anaerobic digestion, manure handling safety, long-term manure application, and managing edge of field losses.. More…

2016 Webcasts

Topics include: Construction and maintenance of manure ponds, antibiotic resistance, manure entomology, NAQSAT, Drones, manure safety and transport, the nutrient recycling challenge, Vermont nutrient management training course, and pathogens. More…

2015 Webcasts

Topics include: Manure Apps, Gypsum Bedding, Livestock Housing, Tile Drained Lands, Micro Manure Management, Horse Manure Composting, Uses of Biochar, Thermal Manure-to-Energy Systems, Mortality Management during Avian Influenza, Communication Pathways, Communicating During Controversy. More…

2014 Webcasts

Topics include: Capturing Nutrients, Manure as a biofuel, Water Quality Index, Liquid manure nutrients, Carbon credits, Bioaerosols, WOTUS, Biosecurity, Mortality composting, Whole Farm Nutrient management, Winter manure application, Next generation activities. More…

2013 Webcasts

Topics include: Risk Management, Waste to Worth, Mono-slope beef barns and research results, Bioavailability of Phosphorus, Capturing Nutrients. More…

2012 Webcasts

Topics include: Biofilters, The 4Rs, Microbes, Life-Cycle Assessments, Carbon Footprints, Nitrates, Adaptive Nutrient Managment, Chesapeake Bay, Emergency Management. More…

2011 Webcasts

Topics include: Top-dressing manure, Chesapeake Bay, Soil Health, Reducing Odor Risk, Anaerobic Digestion, NMP implementation, NAEMS, Lagoon Closure, Manure Economics, 2011 NPDES CAFO rule. More…

2010 Webcasts

Topics include: Cover Crops, Vegetative Environmental Buffers, Mortality Composting, Manure Spills, NAQSAT, Manure on No-Till, SPCC, Ammonia Emissions. More…

2009 Webcasts

Topics include: Feeding Strategies, Carbon Footpring, Conserving Nitrogen, AFO Inspection, Mortalities, Air Emissions, Grazing Management. More…

2008 Webcasts

Topics include: Market Based Conservation, Antibiotics and Hormones, Dry Manure Housing Systems, Ammonia, Small Farms, Regulations, Manure Management Planner Software. More…

2007 Webcasts

Topics include: Integrated Nutrient Management, Manure Application to Legumes, Value of Manure in Land Application, Smithfield Project, Value Added Processing of Manure, Manure Treatment Technologies, Value of Manure in Energy Generation, Vegetative Treatment Systems, and Innovative Manure Treatment Technologies. More…

2006 Webcasts

Topics include: CNMP Core Curriculum, Pathogens, EPA CAFO Regulations. More…

Having Trouble?

If you experience difficulty in viewing webcasts, please visit our webcast troubleshooting page: