
Nutrient Recovery Membrane Technology: Best Applications and Role in Conservation

Proceedings Home | W2W Home w2w17 logo

Purpose

Animal manure contains nutrients and organic matter that is valuable to crop producers if it can be efficiently applied to nearby fields, however this can be a significant source of environmental contamination if managed incorrectly. In most cases, concentrated animal production facilities are rarely close to sufficient cropland to fully utilize these resources and management becomes a disposal issue rather than a utilization opportunity. The goal of this work is to design and test a pilot-scale system to implement a hydrophobic, gas permeable, expanded polytetraflouroethylene (ePTFE) membrane (U.S. patent held by USDA) to recover ammonia from swine wastewater in a solution of sulfuric acid. The pilot-scale system results are described elsewhere; the purpose of this presentation is to explore the best applications for this and other recovery technologies in animal feeding operations.

What did we do?

The reactor test (figure 1) system consisted of 19 membrane tubes (ID of 0.16 in, wall thickness of 0.023 in) within a 2.01 in diameter, 24.7 in long reactor giving a membrane density of 3.83 in2 in-3 of reactor. Wastewater first passed through a CO2 stripping column (4.016 in diameter, 55 in length) where a small air stream (0.0614 ft 3 min-1) stripped CO2 from the wastewater and raised the pH one full unit, shifting the equilibrium to NH3 and enhancing transport across the membrane. Batch tests (0.706 ft3) were run for 9-12 days with wastewater recirculating at a rate of 0.16 gal min-1. The recovery fluid inside the tubular membranes was a 0.01 N sulfuric acid solution with the pH automatically maintained below 4.0 standard units and recirculating at a rate of 1/100th the wastewater flowrate. Freshly collected settled wastewater and anaerobic digester effluent were tested to determine the mass of ammonia collected, the acid required to main! tain the low pH of the recovery solution and potential ammonia losses to the atmosphere.
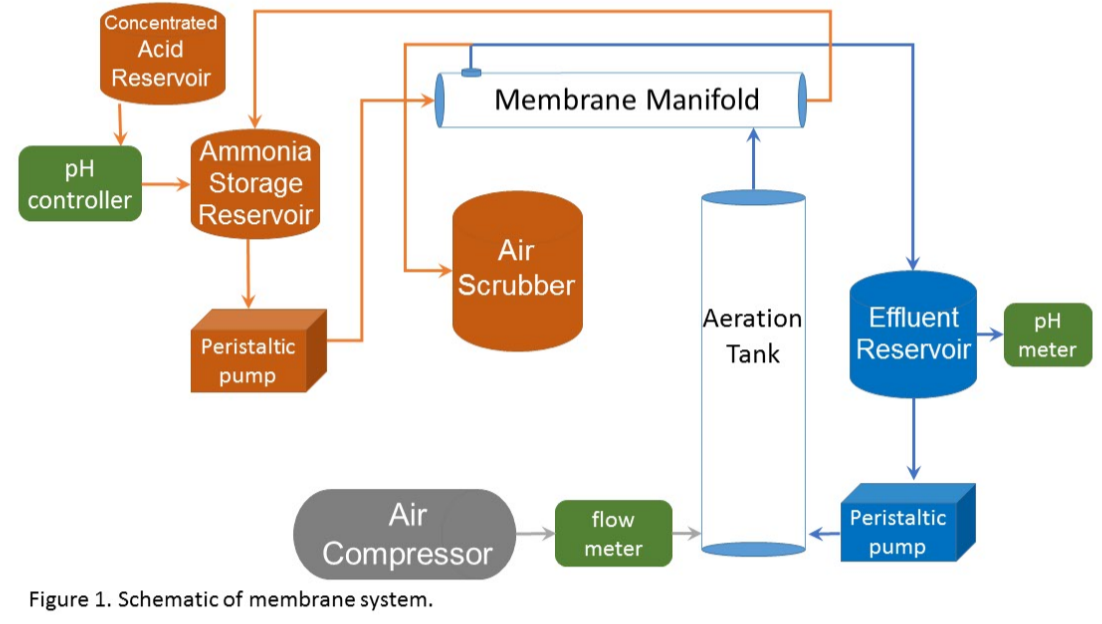
Figure 1. Schematic of membrane system

What have we learned?

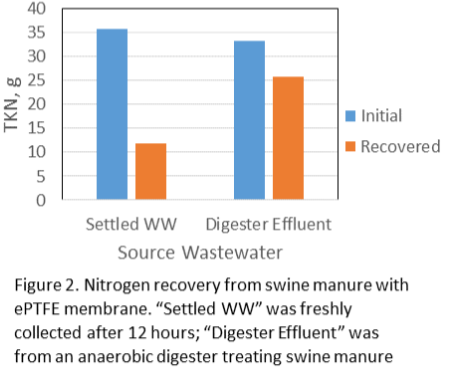
The batch volumes of the two sources contained about the same mass of nitrogen (35.6 g in freshly collected settled wastewater and 33.2 g in digester effluent) but the higher fraction of ammonia in digester effluent resulted in greater recovery (77% vs. 33%).

Future Plans

The best use of this and other recovery technologies cannot be determined by simply comparing the cost of installation and operation with the price of the recovered product. The question of where and how to implement such recovery technologies requires knowledge of the value added by each process and further needs an understanding of how various practices interact and contribute to a sustainable system. Process interactions will suggest one step come before another because of the characteristics produced by one and needed by the other. Anaerobic digestion effluent has different characteristics than the output of a hydrothermal process. As seen in the membrane results, freshly collected liquid waste has a different ammonia : organic nitrogen ratio than digester effluent. Source separated manure solids have high levels of organic phosphorus but digester effluent has high concentrations of dissolved phosphate.

Product recovery is only the beginning of the valuation process; as an industry and as a society, we value conservation for other reasons. We do not yet have a well-accepted way to quantify that value. The avoided cost of nitrogen removal from surface waters is a good start to estimate the value of keeping nitrogen out of drainage and runoff but what is the quantified value of preserving the ecosystem services that excess nitrogen disrupts? The cost of recovered phosphorus may be high relative the current price of virgin phosphate from ore but the value of that recovery process includes the avoided problems in rivers, lakes, and estuaries caused by excess nutrients. The fertilizer value of recovered ammonia that was prevented from escaping to the atmosphere may be small compared to the avoided cost of particulate pollution and the associated health problems.

In addition to improved operation of the membrane reactor system, at least three things are needed to fully realize the value of resource recovery:

1. Cost-effective dewater processes. Rejecting inert water can reduce the capital and/or operating cost of almost all waste management processes;

2. Process to quantify the value of ecosystem services and avoided costs of recovery;

3. Cooperation of and investment from major stakeholders in the form of research funding as well as collaboration regarding processes and feed stocks for fertilizer and feed formulations. Animal production companies have historically been involved but fertilizer companies, feed mill operators, animal nutritionists and others must also be involved.

Corresponding author, title, and affiliation

John J. Classen, Associate professor, Biological and Agricultural Engineering, NC State University

Corresponding author email

john_classen@ncsu.edu

Other authors

J. Mark Rice, Extension Specialist, Biological and Agricultural Engineering, NC State University, Kelly Zering, Professor and Extension Specialist, Agricultural and Resource Economics, NC State University

Additional information

John J. Classen

Biological and Agricultural Engineering

Campus Box 7625

North Carolina State University

919-515-6755

Acknowledgements

This project was supported by NRCS CIG Award 69-3A75-12-183. The authors are grateful for the analytical work of the BAE Environmental Analysis Laboratory, Dr. Cong Tu, manager.

The authors are solely responsible for the content of these proceedings. The technical information does not necessarily reflect the official position of the sponsoring agencies or institutions represented by planning committee members, and inclusion and distribution herein does not constitute an endorsement of views expressed by the same. Printed materials included herein are not refereed publications. Citations should appear as follows. EXAMPLE: Authors. 2017. Title of presentation. Waste to Worth: Spreading Science and Solutions. Cary, NC. April 18-21, 2017. URL of this page. Accessed on: today’s date.

Nutrient Recovery Membrane Technology: Pilot-Scale Evaluation

Proceedings Home | W2W Home w2w17 logo

Purpose

Animal manure contains nutrients and organic matter that are valuable to crop production.  Applying manure to nearby fields can be a significant source of environmental contamination, however, if managed incorrectly. In many cases, concentrated animal production facilities are not close enough to sufficient cropland to fully utilize these resources and management of manure becomes more of a disposal issue rather than a utilization opportunity. One potential solution is to remove and concentrate manure nutrients so they can be cost effectively transported longer distances to cropland that is lacking in nutrients.  The objective of this work was to design and test a pilot-scale system to implement a hydrophobic, gas-permeable, ePTFE (a synthetic fluoropolymer) membrane (U.S. patent held by USDA) to recover ammonia from swine wastewater in a solution of sulfuric acid. The pilot-scale system was designed to replicate the laboratory results and to determine critical operational controls that will assist in design of farm-scale systems.

What did we do?

Through a series of preliminary experiments, we established operational criteria and selected a membrane with an inside diameter of 0.16 in., wall thickness of 0.023 in., and a density of 0.016 lb in-3. A test system was developed (Figure 1) with 19 membrane tubes within a 2.01-inch diameter, 24.7-inch-long reactor, giving a membrane density of 3.83 sq. in. per cubic inch of reactor volume. Wastewater first passed through a CO2 stripping column (4.016 in. diameter, 55 in. length) where a small air stream (0.0614 cfm) stripped CO2 from the wastewater and raised the pH one full unit, shifting the equilibrium to NH3 and enhancing transport across the membrane. Batch tests (0.706 ft3) were run for 9-12 days with wastewater recirculating at a rate of 0.16 gpm. The recovery fluid inside the tubular membranes was a 0.01 N sulfuric acid solution with the pH automatically maintained below 4.0 standard units and recirculating at a rate of 1/100th the wastewater flow rate. Freshly collected settled wastewater and anaerobic digester effluent were tested to determine the mass of ammonia collected, the acid required to maintain the low pH of the recovery solution, and potential ammonia losses to the atmosphere.

Figure 1. Schematic of membrane system

What have we learned?

The freshly collected wastewater had an initial mass of 35.6 g nitrogen but the NH3 was only 14.5 g, leading to a recovery of 11.8 g (33% of initial content) over 12 days. The anaerobic digester effluent had an initial mass of 33.2 g nitrogen with an NH3 mass of 31.3 g. The higher fraction of ammonia helped push the recovery to 25.7 g or 77% of the initial nitrogen content (see Figure 2). Very little ammonia was lost with the exhaust air.

Figure 2. Nitrogen recovery from swine manure with ePTFE membrane

Future Plans

An optimized membrane reactor could be a viable tool in ammonia nitrogen recovery from a manure treatment system if used in conjunction with digestion. Higher economic value could be generated by further concentrating the ammonium sulfate product.

Corresponding author, title, and affiliation

John J. Classen, Associate Professor, Biological & Agricultural Engineering, NCSU

Corresponding author email

john_classen@ncsu.edu

Other authors

J. Mark Rice, Extension Specialist, NCSU; Alison Deviney, Graduate Research Assistant, NCSU

Additional information

John J. Classen

Biological and Agricultural Engineering

Campus Box 7625

North Carolina State University

919-515-6755

Acknowledgements

This project was supported by NRCS CIG Award 69-3A75-12-183. The authors are grateful for the analytical work of the BAE Environmental Analysis Laboratory, Dr. Cong Tu, manager.

Manure Treatment and Natural Inactivation of Porcine Epidemic Diarrhea Virus in Soils

Proceedings Home | W2W Home w2w17 logo

Purpose

The porcine epidemic diarrhea virus (PEDv) outbreak in North America has substantially impacted swine production, causing nearly 100% mortality in infected newborn piglets. Because manure may remain a source of reinfection, proper manure management practices to limit outbreaks need to be developed and evaluated. Two laboratory studies simulating manure pit treatment with increasing amounts of quicklime were conducted to determine PEDv susceptibility to increasing pH. Additionally, two laboratory soil incubation studies contrasting manure liming, multiple soil types, and two antecedent soil moistures were conducted over several months with incubation conditions mimicking the climates in Minnesota, Missouri, and Oklahoma to determine whether current manure application practices reduce the potential for PEDv reinfection via manure-amended soil. Quantitative PCR and live swine bioassays were used to enumerate PED virus and to determine whether manure and soil samples contained infectious PEDv.

What did we do?

Quicklime-Manure Slurry Incubations: An initial short-term manure slurry study was conducted on fresh PEDv-positive manure slurry collected in 2015 from the shallow pit of a commercial swine facility in southeast Nebraska. Manure was sampled prior to treatment (0 h) and then distributed among glass beakers (250 mL) to accommodate triplicates of three treatments: liming to pH 10, liming to pH 12, and unlimed manure. Following pH adjustment, aliquots of each sample were collected at 1 and 10 h, immediately neutralized with 10 mM HCl and stored at -80°C for subsequent analysis. In a second manure slurry incubation, triplicate PEDv-positive manure samples collected from a commercial swine operation in south central Nebraska site in December 2016 were mixed in equal portion (w:v) with distilled water to mimic manure slurry consistency observed in swine production pit storages. Quicklime was added stepwise (0.25 g addition) to each manure slurr! y sample with continuous stirring to gradually increase manure slurry pH. After each addition of quicklime, pH was measured and an aliquot of manure slurry was collected for subsequent quantitative PCR PEDv enumeration and infectivity in a pig bioassay.

Long-term manure and soil incubation. Initial tests determined appropriate initial soil moisture contents (representing a ‘dry’ and ‘moist’ soil condition) and manure:soil ratios (1 g slurry:3 g soil) to best represent the manure:soil within an injection furrow when slurry is injected into soil, and appropriate liming source (ag lime vs. quicklime). PEDv-positive manure slurry collected from a commercial swine operation in southeast Nebraska was divided between two 3-L containers, one for limed treatment (LIME) and the other for the control, or no-lime, treatment (CNL). Quicklime (30 g) was added to one 3 L portion (equivalent to an application of 80 lbs. quicklime per 1000 gallons of slurry) to achieve a final pH of 12. Both treated and untreated slurry stocks were incubated at room temperature for 24 hours. Distilled water was added to two soils, a silty clay loam (pH 7.0) and a loamy fine sand (pH 6.9), to attain 10% and 30% water holding capacity! (dry and moist soil condition). Thirty grams (dry weight) of soil was apportioned to multiple 50 mL screw top conical tubes and a cavity was made in the center of the soil by pressing a 10 mL pipet tip into the soil. Ten mL of slurry (LIME or CNL) were then added to each soil tube via pipet. Four replicate tubes were immediately frozen at -80°C for each combination of soil, moisture, and manure treatment to represent initial soil application (day 0). The tubes were loosely capped and placed into one of three incubators operated independently throughout the trial to simulate soil temperatures between November 1 and May 1 at one of three geographic locations: southern Minnesota, northern Missouri, and central Oklahoma (Figure 1). Twenty replicate tubes were created for each combination of soil, moisture, incubation, and manure treatment, and a set of four tubes were collected for each treatment combination on days 30, 60, 90, 120 and 150 of the incubation and immediately transfer! red to a -80°C freezer for storage.

Molecular detection and quantification of PEDv. Prior to analysis, soil and manure samples were removed from -80°C storage and allowed to thaw at room temperature. The RNA in each sample was extracted using the RNA PowerSoil Total RNA Isolation kit (Mo Bio, Carlsbad, CA). PEDv was detected in samples by reverse transcription and quantitative polymerase chain reaction (RT-qPCR).

Swine bioassay. To confirm that conditions yielding a PCR negative result actually inactivated the PED virus and rendered the manure non-infectious, a live pig bioassay was conducted with the limed and non-limed manure slurry samples from the initial short-term manure slurry incubation (quicklime addition). Fifteen pigs, approximately 21 days old, were sourced from a high-health facility whose dams tested negative for PEDv antibodies and virus by PCR. Piglets were tested for PEDv upon arrival and confirmed negative. Piglets were randomly assigned to individual housing in BSL-2 rooms at the University of Nebraska-Lincoln Life Sciences Annex as follows: control (3 piglets), pH 10 (6 piglets), and pH 12 (6 piglets), and allowed to acclimate for three days. Each pig was then administered a 10-mL oral gavage of manure slurry: three piglets in the control room received one of the three un-limed slurry samples; six piglets in the pH 10 room received one of the six limed (pH 10) sl! urry samp les (three limed for 1 h and three limed for 10 h); and six pigs in the pH 12 room received one of the six limed (pH 12) slurry samples (three limed for 1 h and three limed for 10 h). Piglets were monitored for fecal shedding of PEDv for four days until control animals began to demonstrate clinical signs of PEDv infection, at which time all piglets were humanely euthanized. Fecal swabs, and duodenum, ileum, jejunum, and cecum samples were collected from each animal and fixed in formalin. All fecal and tissue samples were analyzed for the presence of detectable PED virus by immunohistochemistry and PCR.

PEDv, log # g soil

What have we learned?

Manure Slurry Incubation: Manure limed to pH 10 and pH 12 for 1 and 10 h yielded no detectable PEDv RNA. Live swine bioassay results confirmed that these samples were not infective while control samples resulted in PEDv infection of piglets. These results indicate that a final manure slurry pH of 10 (equivalent to 50 lbs. of quicklime added to 1000 gallons manure slurry) is sufficient to reduce PEDv RNA to an undetectable concentration after 1 hour of contact time. All pigs receiving limed manure (pH 10 or 12 maintained for 1 or 10 h) during the live swine bioassay tested negative for PEDv infection while control pigs (un-limed treatment) all tested positive for PEDv infection (Figure 1). The pig bioassay results confirmed that the PCR assay is a reliable predictor for the presence of infectious PEDv in these matrices and that lime addition to achieve pH 10 for just one hour is sufficient to deactivate the virus in stored manure.

Soil Incubations: At the completion of the long-term (150-day) soil incubation, a subset of the frozen samples (LIME and CON soil samples collected on day 0 and 30) was selected for RNA extraction and qPCR analysis. The qPCR results from days 0 and 30 yielded no detectable PEDv RNA in either the limed or un-limed manure-amended soils (Figure 1). Furthermore, manure-amended soils did not differ from soil-only controls even though PEDv RNA was still detectable in the original manure slurry at high concentrations. No differences in PEDv abundance were detected on either day when initial soil moisture (10% vs 30% water holding capacity), incubation condition (MN vs. MO vs. OK), or soil type (silty clay loam and loamy fine sand) were varied. For these soils, the concentration of PEDv in limed or un-limed manure decreased immediately to a non-detectable level. These results indicate that manure-amended soil with pH 6.9 or greater is not a vector for transmission of the PED virus.

A consistent finding from all of the studies is that pH of media (slurry or soil) strongly influences PED virus survival.

Future Plans

Additional studies are underway to identify the lowest pH at which the PED virus is rendered non-infectious in slurry manure.

Corresponding author, title, and affiliation

Amy Millmier Schmidt, Assistant Professor, Departments of Biological Systems Engineering and Animal Science, University of Nebraska – Lincoln

Corresponding author email

aschmidt@unl.edu

Other authors

Stevens, E., A. Schmidt, D. Miller, J.D. Loy and V. Jin

Additional information

Dr. Amy Millmier Schmidt, corresponding author, can also be reach at (402) 472-0877.

Acknowledgements

Funding for this research was provided by the National Pork Board. Gratitude is extended to Ashley Schmit for assistance with laboratory activities and animal care. Special thanks to the Nebraska pork producers who granted access to their farms for collection of PEDv-positive manure.

Do Growth Enhancers Affect the Carbon Footprint of Pork Production?

green stylized pig logoIn swine production, maximizing growth rate while minimizing inputs (efficiency) is a top aim of most farmers. This helps an operation become more profitable, but it also has positive environmental benefits in that the amount of water, feed, or energy needed to produce each pound of pork is reduced. This results in fewer greenhouse gases emitted per pound of pork. (For more information on the relationship between efficiency and carbon footprint in animal agriculture see this Animal Frontiers article).

One particular growth enhancer used by pig farms is ractopamine. This is not an antibiotic, but it alters animal metabolism so that pigs produce more lean tissue (muscle) and less fat. For more on this feed additive, see this Texas A&M fact sheet).

A Comparison of Environmental Footprint With and Without Ractopamine

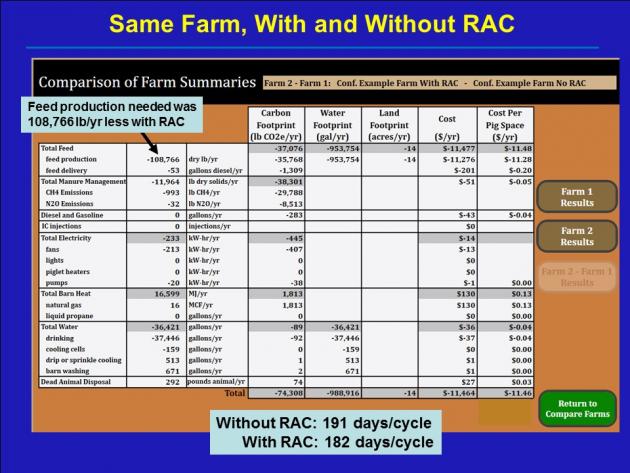
The image below shows a comparison of the same farm system with and without ractopamine. The results are estimated carbon, water, and land footprints as well as economic costs. The numbers were generated by the Pig Production Environmental Footprint Calculator.

The slide shows a smaller carbon footprint; -37,076 lbs of carbon dioxide equivalents per year when using ractopamine. This farm used 953,754 less gallons of water/year with the growth enhancer and required 14 less acres of land to support the farm. The economic implications (using prices from 2015) were a $11,477 advantage with ractopamine.

slide showing a comparison in carbon, water, land, and economic footprint for a farm with and without ractopamine as a growth enhancer

Slide credit: Dr. Rick Ulrich, University of Arkansas.

Are There Other Ways To Improve Growth Besides Ractopamine?

While growth enhances are a proven way to improve efficiency, there are other research-proven recommendations when making management choices to improve growth rate:

  • Phase feeding – diets change due to changing energy, protein, and other nutritional requirements are different as the animal grows
  • Balancing for specific amino acids (and not just crude protein) for each phase
  • Maintaining a clean environment
  • If in a building, keeping temperature in the optimum range

Management choices also impact health status and biosecurity protocols are used to prevent the presence of specific diseases.  In the past, antibiotics could be added to feed or water at low levels to enhance growth rate, but the concern over the proliferation of antibiotic-resistant bacteria resulted in the new policies to only utilize antibiotics to treat (rather than prevent) disease in food animals. The inclusion of antibiotics deemed medically important is being eliminated (federal rules took effect October, 2015 and the policy is in full effect at the end of 2016) for growth-promoting purposes. (For more, see this newsletter from the National Pork Producers explaining the rules to their members).

For More Information

Acknowledgements

Author: Amy Carroll, University of Arkansas

This information is part of the program “Integrated Resource Management Tool to Mitigate the Carbon Footprint of Swine Produced In the U.S.,” and is supported by Agriculture and Food Research Initiative Competitive Grant no. 2011-68002-30208 from the USDA National Institute of Food and Agriculture. Project website.

What Is an Environmental Foot Print? (Ecological Footprint)

green stylized pig logoThe Cambridge dictionary defines environmental footprint as:

the effect that a person, company, activity, etc. has on the environment, for example the amount of natural resources that they use and the amount of harmful gases that they produce

Also referred to as an ecological footprint, this is a measure that attempts to consider multiple impacts of an activity rather than focus on a single one. In relation to the swine industry, this foot print takes into account the results of carbon, water, land and air footprints of pig farming.

Related: Evaluating the environmental footprint of pork production

How do you bring all of these different pieces together? In 2011, the U.S. National Pork Board and many land grant researchers launched a project to develop a science-based decision tool called Pig Production Environmental Footprint Calculator (PPEFC). The PPEFC has the ability to calculate (estimate) impact to greenhouse gas emissions, costs, land use, and water consumption across the pork production chain, including feed formulation and crop production. The combined analysis of all of these factors allows identification of potential ecologically and economically feasible production practices for pork producers.

One of the pieces of this project is developing an environmental footprint, cost, and nutrient database of the US animal feed ingredients and integrating it with the calculator. The calculator is built upon cradle-to-farm gate life-cycle assessment (LCA) of pork production combined with the US National Resource Council (NRC) swine nutrient requirements models (NRC 2012), farm operation inputs, and animal feed database. Farm operation inputs include: barn characteristics, utilities, manure management, dead animal disposal, and farm operation costs. For a description of the inputs, visit this conference presentation at LCA Foods 2014.

Additional Information

Factsheets: What is a water footprint? | What is a land footprint? | What is a carbon footprint?

Pig Production Environmental Footprint Calculator (National Pork Board).

Animal agriculture and:

Acknowledgements

Author: Amy Carroll, University of Arkansas

Reviewers: Jill Heemstra, University of Nebraska; Karl Vandevender, University of Arkansas

This information is part of the program “Integrated Resource Management Tool to Mitigate the Carbon Footprint of Swine Produced In the U.S.,” and is supported by Agriculture and Food Research Initiative Competitive Grant no. 2011-68002-30208 from the USDA National Institute of Food and Agriculture. Project website.

Carbon Footprint, Life Cycle Assessment and the Pork Industry

green stylized pig logoAnimal agriculture in the U.S. contributes approximately 3.5% of all man-made greenhouse gases (GHGs). If you look at pork production, it accounts for just 0.34% of all emissions. (Source: U.S. EPA Greenhouse Gas Inventory released April, 2015).

When you total up all the GHG emissions from a particular activity or process, it is called a carbon footprint. The procedure used to decide which GHG emissions are included in this total is a life-cycle assessment (LCA).

What Is a Carbon Footprint and How Is It Used?

A carbon footprint gives you a snapshot in time of the GHGs produced by the activity or process being evaluated. The number generated is especially useful for comparing different processes or different times.

Some reasons a farm, company, or industry would calculate a carbon footprint include:

  • Identifying “hot spots” in the system to prioritize areas where reductions can be made
  • Creating a baseline measure for comparing over time
  • Looking at “what-if” scenarios and comparing different options to see how each affects GHG emissions

What Goes Into a Life Cycle Analysis?

In order to be able to compare carbon footprints of different farms or different industries, the life-cycle analysis (LCA) needs to use the same parameters. To do this, many people rely upon standardized procedures such as those created by the International Organization for Standardization.

For the pork industry, the pork supply chain is broadly divided into eight stages:

  • feed production;
  • live animal production;
  • delivery to processor;
  • processing;
  • packaging;
  • distribution;
  • retail;
  • consumption/disposal.

The most important thing to remember is that if you compare two or more carbon footprints to each other, the LCA used needs to be the same. If you try to compare footprints generated using different LCAs, you will not get a true comparison.

For more information

Authors: Jill Heemstra, Nebraska Extension and Rick Fields, University of Arkansas

Acknowledgements

This information is part of the program “Integrated Resource Management Tool to Mitigate the Carbon Footprint of Swine Produced In the U.S.,” and is supported by Agriculture and Food Research Initiative Competitive Grant no. 2011-68002-30208 from the USDA National Institute of Food and Agriculture. Project website.

Do We Know the Carbon Footprint of the Pork Industry?

green stylized pig logoA carbon footprint is a total of all the greenhouse gas emissions (GHG) from a process or industry. A life cycle assessment (LCA) is the process used to figure out what GHG emissions will be included in the footprint. More technically, it is systematic way of looking at a product’s complete life cycle and calculating a “footprint”.  In addition to carbon footprints, there are efforts to calculate land, water, and other environmental footprints.

Below are highlights from several different reports that looked at the carbon footprint of the pork industry on a national and international scale. A comparison between different ways to raise pigs was also highlighted.

Snapshot of the Present Time

On a national scale, a report on the National Life Cycle Carbon Footprint Study for Production of Swine in the U.S. was conducted and published in 2011.

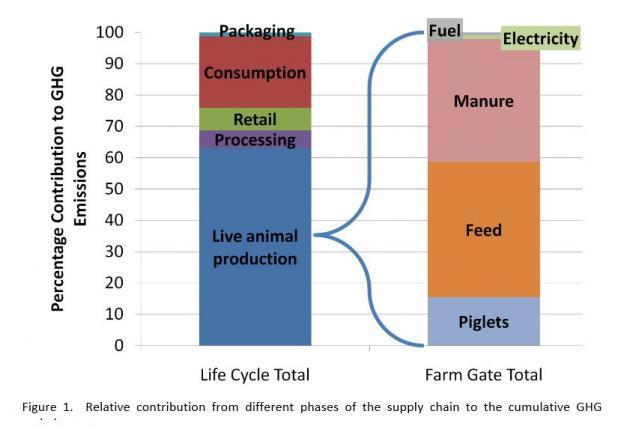
The report concluded that the carbon footprint to prepare and consume a 4 oz serving of pork was ~2.5 lbs of carbon dioxide equivalents. Figure 1 (below) from that report shows the relative breakdown of the industry’s estimated greenhouse gas emissions:

  • Live animal production made up 62.1% of the emissions. That is further broken down and presented in second column (right).
  • Processing – 5.6%
  • Retail – 7.54%
  • Consumption – 23.5% including refrigeration, cooking, and methane from food waste in landfill
  • Packaging (1.3%);

Life cycle assessment of pork production in the U.S.

Comparison Over 50 Years of Production

Another example of an industry-wide analysis, this one comparing over time, is a “50-year comparison of the carbon footprint of the U.S. swine herd 1959 – 2009” (29 pp; PDF). The pork industry overall emits more total greenhouse gases than 50 years ago, but actually emits much less per pound of pork produced because of improvements in efficiency.

From that publication:

The U.S. swine industry produces pigs far more efficiently today (2009) than in 1959. The number of hogs marketed has increased 29% (87.6 million in 1959 to 112.6 million in 2009 after removing market hogs imported directly to harvest) from a breeding herd that is 39% smaller. The efficiency gain is even more impressive when measured against the total dressed carcass weight harvested. Dressed carcass yield leaving the farm has nearly doubled in 50 years from 12.1 billion pounds to 22.8 billion pounds. This increase in productivity has resulted in an increase of 2,231 pounds (2.5x) of carcass harvested annually per sow – year. Today, it takes only five hogs (breeding and market) to produce the same amount of pork that  required eight hogs in 1959.

Comparing Different Ways of Raising Pigs

An example of an LCA that looks at different types of systems is “Life-cycle assessment of commodity and niche swine operations“. (informal Q&A and journal article both available). From the journal article (bottom of page 5):

High-profitability operations have consistently lower impacts compared to low-profitability operations for both commodity and deep-bedded niche piglet production.

Global Assessment from Backyard to Industrial Systems

On an international scale, the report “Greenhouse gas emissions from pig and chicken supply chains” was published in 2013. This study looked at all scales of farms from backyard pigs to industrial production (large confinement operations). Over the entire scale, they estimated that the carbon footprint of pork for every kg (~2.2 lbs) of pig carcass weight has an emissions intensity of 6.1 kg of carbon dioxide equivalent.

This report found that backyard systems, especially in some parts of the world, have low emissions, largely due to by-product or “second-grade” feeds. Industrial pig systems tended to have more emissions intensity than backyard systems, with the emissions from liquid/slurry manure management systems being a big reason. From the conclusion of the report:

When drawing any conclusions about scope for improvement, the following points should be borne in mind: (a)differences in emission intensity may reflect differences in production systems that have arisen over time to enable the system to perform better within a given context, e.g. to make them more profitable, or resilient; (b) focusing on a single measure of efficiency (in this case GHG emissions per kg of output) can lead to positive and negative side effects on, for instance, biodiversity, water quality and animal welfare; (c) reducing GHG emissions is not the only objective producers need to satisfy, as they also need to respond to changing economic and physical conditions.

How Do Carbon Footprints Compare?

It is very important to note that when looking at data and numbers generated from different reports like these, the carbon footprints are difficult to compare unless they use the same LCA. Presenting carbon footprints from different LCA’s is an “apples to oranges” comparison. Only when the same LCA is used, can they be an “apples to apples” comparison.

Additional Information

Acknowledgements

Authors: Amy Carroll, University of Arkansas and Jill Heemstra, University of Nebraska jheemstra@unl.edu

This information is part of the program “Integrated Resource Management Tool to Mitigate the Carbon Footprint of Swine Produced In the U.S.,” and is supported by Agriculture and Food Research Initiative Competitive Grant no. 2011-68002-30208 from the USDA National Institute of Food and Agriculture. Project website.

Analyses of Microbial Populations and Antibiotic Resistance Present in Stored Swine Manure from Underground Storage Pits


Why Study Antibiotic Resistance in Manure?

Antimicrobial compounds have been commonly used as feed additives for domestic animals to reduce infection and promote growth. Recent concerns have suggested such feeding practices may result in increased microbial resistance to antibiotics, which can have an impact on human health. As part of our research project we have been studying the commensal microbial populations present in stored swine manure and the swine GI tract. We have extended this work to include studies on the antibiotic resistance present in these populations.

What did we do?

Predominant microbial populations were identified by both pure culture isolations and direct 16S rDNA sequencing of total DNA from swine feces and stored manure samples. Antibiotic resistance was analyzed using similar pure culture isolation methods. Pure cultures were isolated following plating on anaerobic and aerobic media containing tetracycline, tylosin, or erythromycin. Polymerase chain reaction (PCR) analyses using primers based on a variety of antibiotic resistance genes was carries out with both pure culture isolates and total DNA from swine feces and stored manure.

What have we learned?

Results of pure culture isolation and direct 16S rDNA gene sequence analyses indicate that the bacterial populations of the swine GI tract (feces) and stored manure ecosystems are predominantly composed of anaerobic, low mole %G+C, Gram-positive bacteria, most of which represent novel genera and species. Results of antibiotic resistance gene PCR studies demonstrated the presence of a variety of tet (e.g., tetK, tetO) and erm (e.g., ermA, ermC) resistance gene classes in both anaerobic and aerobic pure cultures and total DNA from both swine feces and stored manure, as well as the identification of novel bacteria containing new resistance genes. Comparison of DNA sequences suggests that horizontal transfer of resistance genes between bacterial strains has also occurred. The data indicate that both the swine gastrointestinal (GI) tract and stored swine manure may serve as reservoirs of known and novel antibiotic resistant bacteria and resistan ce genes.

Future Plans

We are interested in developing methods to reduce antibiotic resistance in the swine GI tract and stored manure, and to determine if antibiotic resistance genes present in these ecosystems can be transferred to bacteria that may affect human health (e.g., E. coli, Salmonella, Campylobacter).

Authors

Terence R. Whitehead, Research Microbiologist, USDA-ARS- National Center for Agricultural Utililzation Research, Peoria, IL 61604 terry.whitehead@ars.usda.gov

Michael A. Cotta, USDA-ARS-National Center for Agricultural Utilization Research, Peoria, IL 61604

Additional information

Terence R. Whitehead, NCAUR, 1815 N. University St., Peoria, IL 61615 309-681-6272

USDA-ARS-NCAUR-Bioenergy Research Unit: http://ars.usda.gov/main/site_main.htm?modecode=50-10-05-20

Cotta, M.A., Whitehead, T.R., and Zeltwanger, R.L. Isolation, Characterization, and Comparison of Bacteria from Swine Faeces and Manure Storage Pits. (2003) Env. Microbiol. 5:737-745. http://onlinelibrary.wiley.com/doi/10.1046/j.1467-2920.2003.00467.x/pdf

Whittle, G., Whitehead, T.R., Hamburger, N., Shoemaker, N.B., Cotta, M.A., and Salyers, A.A. Identification of a new ribosomal protection type of tetracycline resistance gene, tet(36), from swine manure pits . (2003) Appl. Environ. Microbiol. 69:4151-4158. http://aem.asm.org/content/69/7/4151.full

Cotta, M.A., Whitehead, T.R., Falsen, E., Moore, E. and Lawson, P.A. Robinsonella peoriae gen.nov., sp. nov., isolated from a swine-manure storage pit and a human clinical source. (2009) Int. J. System. Evol. Microbiol. 59:150-155. https://pubmed.ncbi.nlm.nih.gov/19126740/

Whitehead, T.R. and Cotta, M.A. Stored Swine Manure and Swine Feces as Reservoirs of Antibiotic Resistance Genes. (2013) Lett. Appl. Microbiol. 56:264-267. http://onlinelibrary.wiley.com/enhanced/doi/10.1111/lam.12043/

The authors are solely responsible for the content of these proceedings. The technical information does not necessarily reflect the official position of the sponsoring agencies or institutions represented by planning committee members, and inclusion and distribution herein does not constitute an endorsement of views expressed by the same. Printed materials included herein are not refereed publications. Citations should appear as follows. EXAMPLE: Authors. 2015. Title of presentation. Waste to Worth: Spreading Science and Solutions. Seattle, WA. March 31-April 3, 2015. URL of this page. Accessed on: today’s date.

PEDV Survivability in Swine Mortality Compost Piles


*Purpose

PEDv has caused significant losses in the Nebraska pork industry and mortality can approach 100%. Disposal of these carcasses is a challenge as they serve as a source of tremendous amounts of infectious virus. Current alternative methods of disposal include rendering, incineration and burial. Rendering trucks may serve as a farm-to-farm vector. Incineration is not feasible for the significant number of mortalities and burial may enable long-term survival of virus in soil and may cause re-infection after disease elimination. Therefore, composting may serve as an ideal solution for disposal and mortalities this would provide a biosecure, safe, and cost-effective method to mitigate on-farm sources of virus. The overall objective of this study was to determine the efficacy of composting as a mortality disposal method following death loss from the porcine epidemic diarrhea virus (PEDv). Validation of time-temperature combinations for PEDv inactivation in mortality compost piles was the primary intended outcome of this project.

What did we do?

PEDv virus challenge protocol modeled one that has shown previous success using weanling pigs (Hesse et al., 2013). Twenty-seven animals (approximately 21-day-old weaned piglets) were sourced from a high-health commercial source that had no history of PEDv and with dams that tested negative for the presence of PEDv-specific antibodies and were negative for fecal virus shedding as determined by PCR. Experimental groups were housed in pens and maintained at appropriate temperature and in accordance with national animal care space requirements. Pigs were given five days of acclimation and maintained on commercial nursery pig diets. Following acclimation, each pig was inoculated orally with 5 mL of virus inoculum (NE 9282) supplemented with gentamicin that had been diluted to a real time PCR assay cycle threshold (Ct) 22. Inocula (feces/intestinal contents) from a natural outbreak of PEDv were used. Pigs were evaluated twice daily for evidence of infection: temperature, pulse, respiration, dehydration, and diarrhea. Fecal samples were collected daily for evaluation of fecal shedding of PEDv. When significant clinical signs of enteric disease were present or pigs became sufficiently ill that the attending veterinarian determined euthanasia was appropriate, animals were humanely euthanized and samples taken for necropsy.

Following necropsy, carcasses from infected and euthanized pigs were composted inside biosecure rooms in the Veterinary and Biomedical Sciences Research Facility at the University of Nebraska – Lincoln. Three compost piles were constructed using commercial sawdust and wood shavings at a target moisture content of 50% w.b. For each pile, an insulated platform with internal dimensions of 121.92 cm (W) x 152.4 cm (L) (48 in x 60 in) was used to contain piles. Platforms were constructed of an outer layer of plywood and an inner layer of PolyBoard sheeting with foam board insulation in between to simulate the linear continuation of the pile and the insulative properties of a compacted soil base. Compost piles were constructed by placing a layer of wood shavings on each base to a depth of 60 cm (24 in), followed by placement of five carcasses in a single layer in the center of the pile followed by a 15 cm (6 in) layer of pile material and a second layer of four carcasses in a single layer. Additional sawdust was placed over and around the carcasses to achieve 60 cm of coverage on the top of the pile. Rooms were maintained at approximately 21°C (70°F) and 25% RH throughout the duration of the project.

Temperature was monitored at ten locations within each pile using Apresys in-transit digital temperature recorders (Apresys, Inc., Duluth, GA) beginning at establishment of the piles and continuing at a 20-min sampling frequency (duration of primary compost cycle not established at time of proceedings submission). Temperature within each pile was also monitored manually using a thermometer at 0, 24, 48, 96 h, and 168 h, and then weekly for the duration of the compost cycle to confirm success of the heating process.

Following completion of the primary compost cycle, temperature loggers will be recovered and each pile will be mixed, sampled for analysis of survivability of PEDv at five locations, moisture will be added, and piles will be re-established for a secondary composting cycle with temperature loggers placed as previously described. At the completion of the secondary composting cycle, piles will again be sampled for analysis of survivability of PEDv (5 samples per pile) and temperature loggers will be recovered.

PEDv survivability will be determined via two independent assay methods. Reverse transcription quantitative polymerase chain reaction (RT-qPCR) is a rapid and sensitive method that will be used to quantify the amount of virus RNA genome in the samples. The Nebraska Veterinary Diagnostic Center currently has a validated RT-qPCR test to assay for the presence of PEDv in manure sample matrices. To validate results from the RT-qPCR in laboratory assays, sawdust simulated compost matrix will be spiked with known concentrations of PEDv target RNA and compared to known standards to ensure no inhibition is present and that proper extraction methods are being used. An alternative method using virus isolation will also be conducted to determine whether viable virus is present in flasks at a smaller subset of time points. To do this, Vero cell monolayers will be infected with filter sterilized aliquots of compost exudate, blindly passaged once after seven days, and examined for virus p resence using IFA with a PED specific monoclonal antibody. At specific time points, RT-qPCR Ct values and Virus Isolation will be run in parallel to ensure sensitivity of testing and to evaluate correlation of the testing modalities under the simulated testing conditions and matrices. If these testing methods show agreement, and/or no virus is isolated, RT-qPCR testing will be utilized to facilitate rapid and consistent assessment of virus persistence during the majority of experimental time points.

What have we learned?

Biosecurity is essential to controlling the spread of PEDv and any facility that is currently positive for PEDv should work diligently to prevent contamination of neighboring facilities. Vehicle transport has been shown as a high-risk activity that may facilitate spread of PEDv (Lowe 2014) and mortalities that are positive for PEDv may be rejected by renderers to protect them from liability for transmitting the disease. Burial of mortalities can be detrimental to water quality (Bartelt-Hunt et al., 2013) and it is unknown how long the PEDv can remain active in the cool, dark, moist environment that accompanies land burial of carcasses, but extrapolation of available data suggests virus may persist for months. Therefore, we believe composting is likely to provide an effective, biosecure, economically viable and environmentally compatible option for disposal of PEDv mortalities. This research will validate the effectiveness of composting through controlled mortality composting trials subsequent to experimental infections. With the completion of this research, our expectation is that we will know what operating parameters are required to ensure inactivation of PEDv during composting of PEDv mortalities.

Future Plans

Using the information generated from this research, we will deliver extension programming and outreach materials to swine producers, veterinarians, and stakeholders within and beyond Nebraska to promote biosecure disposal of PEDv-infected mortalities.

Authors

Amy Millmier Schmidt, Assistant Professor and Livestock Bioenvironmental Engineer, University of Nebraska – Lincoln aschmidt@unl.edu

J. Dustin Loy, Assistant Professor, Veterinary & Biomedical Sciences, University of Nebraska – Lincoln

Additional information

Dr. Amy Millmier Schmidt
(402) 472-0877
aschmidt@unl.edu

Acknowledgements

The authors would like to acknowledge the Nebraska Pork Producers Association and the National Pork Board for providing funding for this research. Special thanks to Jared Korth for helping with laboratory activities on this project and construction of mortality composting platforms.

The authors are solely responsible for the content of these proceedings. The technical information does not necessarily reflect the official position of the sponsoring agencies or institutions represented by planning committee members, and inclusion and distribution herein does not constitute an endorsement of views expressed by the same. Printed materials included herein are not refereed publications. Citations should appear as follows. EXAMPLE: Authors. 2015. Title of presentation. Waste to Worth: Spreading Science and Solutions. Seattle, WA. March 31-April 3, 2015. URL of this page. Accessed on: today’s date.

Time-Temperature Combinations for Destruction of PEDv During Composting


*Purpose

The purpose of this project was to determine the appropriate time-temperature combinations required for inactivation of the porcine epidemic diarrhea virus (PEDv) in composting material as a basis for evaluation of composting for disposal of swine mortalities and/or other PEDv-positive biological material.

What did we do?

In vitro propagation of PEDv for laboratory survivability assays was conducted using a cell culture-adapted isolate received from APHIS-NVSL (Ames, IA) that was free of extraneous agents (5th passage Colorado 2013 PEDv 1303). Propagation was conducted by infection of confluent VERO cell monolayers at a multiplicity of infection (MOI) of 0.1 with a concentration of 5 µg/mL TPCK trypsin. Virus stocks were be amplified following a 2-4 day incubation period on cell monolayers, frozen and thawed, centrifuged, and culture supernatants containing virus were harvested. Virus concentration was calculated and standardized to 1×10⁵-1×10⁶ TCID50/mL using immunocytochemistry and indirect fluorescent antibody assay (IFA) using a PEDV specific mouse monoclonal antibody (MedGene Labs).

The effect of temperature on survivability of PEDv in compost material was evaluated by inoculating compost material and subjecting the material to temperatures of 50°C (122°F), 55°C (131°F), 60°C (140°F), 65°C (149°F), and 70°C (158°F) for 0, 24, 48, 72, 96 h, and 120 h. Sawdust was acquired from a commercial source, autoclaved to eliminate existing microbes, oven dried and used to simulate compost material. One gram of prepared sawdust was placed in each of 140 1-mL centrifuge tubes. Cell culture supernatant containing infectious PEDv was added to phosphate buffered saline and added to each tube achieve a moisture content of 50% w.b. Tubes were randomly assigned to laboratory incubators at the five temperature treatment levels. At each sampling point, four tubes were removed from each incubator and tested to determine virus survivability.

PEDv survivability was determined via two independent assay methods. Reverse transcription quantitative polymerase chain reaction (RT-qPCR) is a rapid and sensitive method that was used by the Nebraska Veterinary Diagnostic Center to quantify the amount of virus RNA genome in the samples. To validate results from the RT-qPCR in laboratory assays, sawdust simulated compost matrix was spiked with known concentrations of PEDv target RNA and compared to known standards to ensure no inhibition was present and that proper extraction methods were being used. An alternative method using virus isolation was also conducted to determine whether viable virus was present in tubes at a smaller subset of time points. To do this, Vero cell monolayers were infected with filter sterilized aliquots of compost exudate, blindly passaged once after seven days, and examined for virus presence using IFA with a PED specific monoclonal antibody. At specific time points, RT-qPCR Ct values and Virus Isolation were run in parallel to ensure sensitivity of testing and to evaluate correlation of the testing modalities under the simulated testing conditions and matrices.

What have we learned?

At the time of proceedings submission, results were not available for inclusion in this report. Results will be presented during the scheduled oral seminar at the conference.

Results of this laboratory study will be used to evaluate appropriate time-temperature combinations necessary during swine mortality composting to inactivate the PEDv virus and determine the feasibility of on-farm mortality composting as a biosecure disposal method for PEDv-infected pigs. Following this laboratory study, mortality composting was initiated using PEDv-positive piglets to confirm the inactivation of PEDv during composting.

Future Plans

Results of this and the full-scale composting study will be used to recommend appropriate swine mortality disposal methods for swine producers with losses due to PEDv as part of their farm biosecurity plan. Additional swine enteric corornaviruses will likely be studied to confirm similar requirements for disposal of mortalities caused by these viruses.

Authors

Amy Millmier Schmidt, Assistant Professor and Livestock Bioenvironmental Engineer, University of Nebraska – Lincoln aschmidt@unl.edu

J. Dustin Loy, Assistant Professor, Clayton Kelling, Professor, Judith Galeota, Virology Laboratory Manager, and Sarah Vitosh, Graduate Research Assistant, Veterinary & Biomedical Sciences, University of Nebraska – Lincoln

Additional information

Dr. Amy Millmier Schmidt
(402) 472-0877
aschmidt@unl.edu

Acknowledgements

The authors would like to acknowledge the Nebraska Pork Producers Association and the National Pork Board for providing funding for this research. Special thanks to Jared Korth for helping with laboratory activities on this project.

The authors are solely responsible for the content of these proceedings. The technical information does not necessarily reflect the official position of the sponsoring agencies or institutions represented by planning committee members, and inclusion and distribution herein does not constitute an endorsement of views expressed by the same. Printed materials included herein are not refereed publications. Citations should appear as follows. EXAMPLE: Authors. 2015. Title of presentation. Waste to Worth: Spreading Science and Solutions. Seattle, WA. March 31-April 3, 2015. URL of this page. Accessed on: today’s date.