Alum has been successfully used in the poultry industry to lower ammonia (NH3) emission from the barns. However, it has not been evaluated to reduce NH3 on beef feedlot surfaces. Additionally, it is not known how it would affect other common emissions from beef feedlot surfaces. The purpose of this study was to determine the effect of adding aluminum sulfate to beef feedlot surfaces on NH3, hydrogen sulfide (H2S), carbon dioxide (CO2), methane (CH4), and nitrous oxide (N2O) emissions.
What Did We Do?
Eight feedlot pens (30 animals per pen) at the U.S. Meat Animal Research Center feedlot were utilized. The pens had a central mound constructed on manure and soil and 3 m concrete apron by the feed bunk and cattle were fed a corn-silage based diet. Four pens (30 cattle/pen) had 10% (g g-1) alum applied to the 6 meters immediately behind the concrete bunk apron and four did not receive alum. The amount of alum added to the area was determined on a mass basis for a depth of 5 cm of feedlot surface material (FSM) using the estimated density of feedlot surface material for Nebraska feedlots (1.5 g cm−3). On sampling days, six representative grab samples were collected from the feedlot surface from the six-meter area behind the bunk apron in each pen; samples were combined within pen to make three representative replicates per pen (N=24). Each of the three pooled samples per pen were measured for pH, NH3, H2S, CH4, CO2, and N2O using petri dishes and wind tunnels in an environmental chamber at an ambient temperature of 25°C (77°F) and 50% relative humidity. Flux measurements for NH3, H2S, CH4, CO2, and N2O flux were measured for 15 minutes using Thermo Fisher Scientific 17i, 450i, 55i, 410iQ, and 46i gas analysis instruments, respectively. Samples were analyzed at day -1, 0, 5, 7, 12, 14, 19, 21, and 26.
What Have We Learned?
Addition of alum lowered pH of FSM from 8.3 to 4.8 (p < 0.01) and the pH remained lower in alum-treated pens for 26 days (p < 0.01). Although the pH remained low, NH3 flux was only lower (p < 0.01) at day 0 and day 5 for alum-treated pens compared to the pens with no alum treatment. Nitrous oxide emission was not affected by alum treatment (6.2 vs 5.7 mg m-2 min-1, respectively for 0 and 10% alum treated pens). Carbon dioxide emission was lower for alum-treated pens than non-treated pens from day 5 until the end of the study (p < 0.05), perhaps due to suppressed microbial activity from the lower pH. Hydrogen sulfide emission was higher (p < 0.05) from alum-treated feedlot surface material (0.8 mg m-2 min-1) compared to non-treated feedlot surface material (0.3 mg m-2 min-1), likely due to addition of sulfate with alum. Methane emission was also higher in alum-treated pens (173.6 mg m-2 min-1) than non-treated pens (81.4 mg m-2 min-1). The limited reduction in NH3, along with increased H2S and CH4 emission from the FSM indicates that alum is not a suitable amendment to reduce emissions from beef feedlot surfaces.
Table 1. pH, ammonia (NH3), hydrogen sulfide (H2S), methane (CH4), carbon dioxide (CO2) and nitrous oxide (N2O) emission from feedlot surface material treated with 0 or 10% alum (g g-1 mass basis).
pH
NH3
(mg m-2 min-1)
H2S
(mg m-2 min-1)
CH4
(mg m-2 min-1)
CO2
(mg m-2 min-1)
N2O
(mg m-2 min-1)
Day
0% Alum
10% Alum
0% Alum
10% Alum
0% Alum
10% Alum
0% Alum
10% Alum
0% Alum
10% Alum
0% Alum
10% Alum
-1
8.1
8.3
229.6d
515.9c
0.3
0.4
136.3 x
73.4w
4,542
3,234
3.1
4.2
0
8.3a
4.8b
163.0c
32.4d
0.2 f
1.8 e
43.1 x
193.8w
4,372
5,294
2.9
1.8
5
8.5a
6.3b
279.5c
83.6d
0.4
0.5
84.1 x
309.5w
404y
1,347z
6.0
6.8
7
8.6a
6.7b
120.2
130.0
0.6 f
1.2e
53.4
61.7
468 y
1,903z
15.3
10.9
12
8.6a
7.2b
418.0
320.3
0.3
0.3
104.5
145.7
3,742y
1,939z
3.3
8.0
14
8.9a
7.6b
229.0
145.5
0.2
0.4
25.4x
180.7w
4,203y
2,018z
11.5
9.3
19
8.6a
7.5b
228.0
225.1
0.1 f
1.1e
132.3x
254.7w
5,999y
3,116z
6.9
5.8
21
8.4a
7.2b
232.0
257.0
0.5
0.8
81.9x
250.0w
4,324y
2,477z
2.2
1.9
26
8.6a
8.0b
584.5c
319.9d
0.1f
0.7e
72.2
92.9
5,534y
3,540z
4.7
2.9
Within a parameter and day, different superscripts indicate a significant difference (p < 0.05) between the emissions from the feedlot surface material treated with 0% and 10% alum.
Future Plans
Future research will evaluate the use of aluminum chloride instead of aluminum sulfate to lower pH of FSM and retain nitrogen. Additionally, microbial amendments are being evaluated to determine if they can reduce gaseous emissions from the feedlot surface.
Authors
Presenting author
Mindy J. Spiehs, Research Animal Scientists, USDA ARS Meat Animal Research Center
Corresponding author
Bryan L. Woodbury, Agricultural Engineer, USDA ARS Meat Animal Research Center
Corresponding author email address
bryan.woodbury@usda.gov
Additional Information
For additional information about the use of alum as a feedlot surface amendment, readers are direct to the following: Effects of using aluminum sulfate (alum) as a surface amendment in beef cattle feedlots on ammonia and sulfide emissions. 2022. Sustainability 14(4): 1984 – 2004. https://doi.org/10.3390/su14041984
Acknowledgements
The authors wish to acknowledge USMARC technicians Alan Kruger and Jessie Clark for their assistance with data collection and analysis.
The authors are solely responsible for the content of these proceedings. The technical information does not necessarily reflect the official position of the sponsoring agencies or institutions represented by planning committee members, and inclusion and distribution herein does not constitute an endorsement of views expressed by the same. Printed materials included herein are not refereed publications. Citations should appear as follows. EXAMPLE: Authors. 2022. Title of presentation. Waste to Worth. Oregon, OH. April 18-22, 2022. URL of this page. Accessed on: today’s date.
Building Environment and Air Quality – Presented by Al Heber
Development of Draft Emission Estimating Methodologies for AFOs: Process Overview – Presented by Ian Rumsy
National Air Emissions Monitoring Study Status Update – Presented by Bebhinn Do
Purpose
The National Air Emissions Monitoring Study, or NAEMS, was conducted from 2007 – 2010 to gather data to develop scientifically credible methodologies for estimating emissions from animal feeding operations (AFOs). It followed from a 2002 report by the National Academy of Sciences that recommended the development of the emission models. NAEMS was funded by the AFO industry as part of a 2005 voluntary air compliance agreement with the U.S. Environmental Protection Agency (EPA). The goals of the air compliance agreement were to reduce air pollution, monitor AFO emissions, promote a national consensus on emissions estimating methodologies, and ensure compliance with requirements of the Clean Air Act and notification provisions of the Comprehensive Environmental Response, Compensation, and Liability Act (CERCLA), and the Emergency Planning and Community Right-to-Know Act (EPCRA). Thus, the design of the study was based both on principles set forth by the National Academy of Sciences and on the needs of EPA and the AFO industry to satisfy the compliance agreement.
What Did We Do
NAEMS monitored barns and lagoons at 25 AFOs in 10 states for approximately 2 years each to measure emissions of ammonia, hydrogen sulfide, particulate matter, and volatile organic compounds. University researchers conducted this monitoring with EPA oversight. The types of AFOs monitored included swine, broiler chickens, egg-laying operations, and dairies. Participating AFOs made their operations available for monitoring for two years and cooperated with the researchers, industry experts, and EPA during the study.
In 2012, EPA used information gathered in NAEMS, along with information provided as part of a 2011 Call for Information, to develop draft emission models for some of the AFO sectors that were monitored. The EPA Science Advisory Board (SAB) conducted a peer review of these original draft emission models and made suggestions for improving the models. Since 2017, EPA began applying the SAB suggestions and developing new draft emission models for each AFO sector. The models estimate farm-scale emissions using information that producers already record or is easy to get (like weather data). The models are not “process-based.” However, the approach aims to estimate emissions from sources based on statistical relationships between air emissions and the meteorological and housing parameters collected that are known to affect processes that generate emissions. The development of process-based models remains a long-term goal of the agency, as we acknowledge process-based models improve the accuracy of emission estimates for the livestock and poultry sectors.
What Have We Learned
During the workshop, panelists will discuss in more detail the lessons learned at various stages of the NAEMS project and how those lessons could inform future work.
Future Plans
The EPA team continues to develop draft emission models using the NAEMS data. It is anticipated that the AFO emission models will be finalized after incorporating input from a stakeholder review period.
Authors
Presenting Authors
Albert J. Heber, Professor Emeritus, Agricultural and Biological Engineering
Ian C. Rumsey, Physical Scientist, Office of Research & Development, U.S. Environmental Protection Agency
Bebhinn Do, Physical Scientist, U.S. Environmental Protection Agency
Corresponding Author
Bebhinn Do, Physical Scientist, U.S. Environmental Protection Agency do.bebhinn@epa.gov
U.S. Environmental Protection Agency – Office of Research & Development Emission Estimating Methodology development team: Maliha Nash, John Walker, Yijia Dietrich, Carry Croghan
The authors are solely responsible for the content of these proceedings. The technical information does not necessarily reflect the official position of the sponsoring agencies or institutions represented by planning committee members, and inclusion and distribution herein does not constitute an endorsement of views expressed by the same. Printed materials included herein are not refereed publications. Citations should appear as follows. EXAMPLE: Authors. 2022. Title of presentation. Waste to Worth. Oregon, OH. April 18-22, 2022. URL of this page. Accessed on: today’s date.
Nutrient recycling is fundamental to agricultural systems (Spiegal et al., 2020). Integration of animal and crop production represents an example of the application of a circular economy to manage nitrogen (N), phosphorus (P), and other nutrients (Figure 1) important to crop and livestock production. An integrated system recycles these critical nutrients from animal feed to manure to soils and back to animal feed. Nutrient additions to the farm, like animals, feed, and fertilizer (input arrow), are necessary to offset the nutrients leaving the farm in animal protein products (output arrow), as well as other nutrient losses in the system (Cela et al., 2014). The efficiency of this nutrient recycling process has both environmental and economic sustainability implications.
Figure 1. Recycling of nutrients is critical to an environmentally sound agricultural “circular economy”.
For many regions of the United States, such as the Corn Belt, animal agriculture remains in relatively close proximity to sufficient crop production to allow agronomic recycling of nitrogen and phosphorus (Gollehon et al., 2001, 2016). However, the sources of manure nutrients (livestock and poultry operations) and the consumers of nutrients (cropland) are often managed as independent businesses. In other regions, separation of feed and animal production by distance and business boundaries creates significant challenges for agronomic nutrient recycling (Spiegal et al., 2020).
The willingness of crop farmers to accept manure as part of their fertility program is dependent upon their perceptions of the benefits and challenges associated with using manure. Likewise, behaviors among farmers and agricultural advisors of information-seeking – “purposive acquisition of information from selected information carriers” (Johnson 1996) – must be considered as a precursor to content delivery. Thus, in early 2020, a faculty team from University of Nebraska, University of Minnesota, and Iowa State University collaborated to implement a survey of farmers and their advisors to guide multi-state outreach programming by identifying:
-Challenges that regularly prevent manure’s use in crop production and
-Perceptions of manure’s benefits that may encourage manure transfers from livestock farmers to crop producers.
What Did We Do
A draft survey was tested with three groups (a stakeholder advisory group, the national Livestock and Poultry Environmental Learning Community, and the Nebraska Animal Manure Management team) leading to the final product. The survey was delivered electronically through QualtricsXM survey application tool using a University of Nebraska-Lincoln licensed product. The survey included questions for the participants on the following subjects of interest:
1. Participant’s role in manure decision making.
2. Perceptions and knowledge of manure’s benefits. Participants were asked to rate the degree to which they considered manure to be harmful or beneficial for crop fertility, soil physical characteristics, soil biological characteristics, crop yields, and environmental quality.
3. Perceptions and knowledge of manure’s challenges. Participants were presented with a list of potential barriers which might prevent manure use in crop fertility programs and asked to identify which factors were barriers for their operations, or for their advisees.
4. The types of supporting resources which would be of most value for the participants’ decision making or advising on manure benefits and barriers.
Surveyed Participants
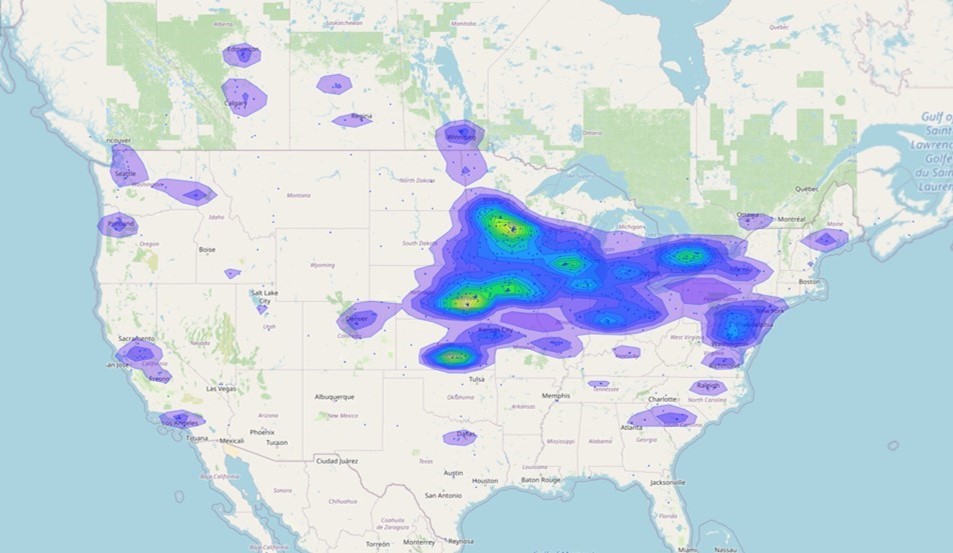
Responses were received from 793 individuals across the U.S. and Canada. The results are heavily weighted towards participants from the Corn Belt and the High Plains regions of the U.S. (44% and 23% of respondents, respectively). Survey participants were 87% male and 13% female. Participants’ experience were reported as 29% with less than 10 years, 22% with 11 to 20 years, and 49% with 21 years or more. Participants self-identified as a crop farmer (13%), animal feeding operation (AFO) (7%), professional advisor for crop fertility or manure management decisions (60%), or some combination of these three roles (20%). Crop farmers indicated that they were an annual user of manure (73%), user of manure within the past 3 years (9%), or user of manure within past 4 to 6 years (9%). Only 10% were not users of manure. Those identifying as advisors suggested that manure management is a primary focus of crop fertility advising (20%), frequent part of crop fertility advising (39%), or an occasional part of a crop fertility advising (36%). Only 4% of advisor responses indicated they did not include manure in their advising.
Figure 1. Region of US and Canada represented by survey participants (N= 793).
A series of five questions were presented to identify real or perceived challenges among respondents that represent potential barriers to using manure in crop fertility programs. Lists of agronomic, economic, neighbor or rural community, regulatory, and logistical challenges were presented based on outcomes of the project team’s advisory group discussions and reviews of previous surveys (Battel and Krueger, 2005; Case et al., 2017; Herrero et al., 2018; Poe et al., 2001). Lastly, respondents were asked to identify the types of supporting resources preferred for information-seeking on manure use in cropping systems.
What Have We Learned
Perceptions and Knowledge of Manure Benefits. Both private sector advisors and crop farmers shared similar positive impressions of manure’s benefits for crop fertility, yield, and soil characteristics while being less positive regarding their impressions of how manure impacts environmental quality. Crop farmers and private sector advisors recognize the complementary role of manure and fertilizer in a fertility program at 74% and 76% frequency, and at slightly higher rates than all survey responses (71%). The complementary role of manure and fertilizer was also similar across regions (Corn Belt – 70%; High Plains-69%; all other regions – 74%).
Figure 2. Perspectives of manure’s beneficial versus harmful impacts on five crop production and natural resource topics as identified by primary decision makers in crop fertility programs.
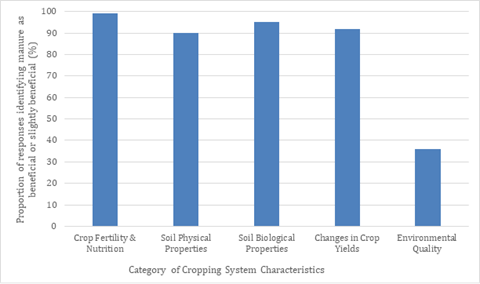
The only audience factors that significantly (p<0.05) influenced participant attitudes toward manure benefits were that participants living in the corn belt were less likely to describe manure as beneficial or slightly beneficial for environmental quality (30%, compared to 46% for high plains, and 35% for all other regions). Similarly, we found that private sector advisors were significantly (p<0.05) less likely to describe manure as beneficial to environmental quality (27%, compared with 58%, 53%, and 30% for livestock producers, crop producers, or public sector advisors respectively). No statistical differences were observed for an influence of audience factors on attitudes towards manure benefits to any of the other characteristics of cropping system benefits (crop yield, soil physical properties, soil biological properties, and crop fertility). However, across all audience sectors participants were unlikely to indicate that they thought manure could be beneficial or slightly beneficial for environmental quality (Figure 2). This data suggests that respondents do not associate improved soil physical and biological characteristics with reduced risk for nutrient transport via runoff, erosion, and leaching. Manure and inorganic fertilizer were perceived as complementary to each other by 71% of respondents, while only 17% believed these two products compete.
Figure 2. Proportion of total respondents who described manure as beneficial or slightly beneficial for different categories of cropping system characteristics. (n=793)
Barriers to Manure Use. As with perceptions of benefits of manure use, audience factors had little effect on the perceived barriers to manure use. There was an observed tendency for more advisors to include most factors as barriers to manure use; however, this tendency was only significant (p<0.05) for six potential barriers: compaction, cost of manure transportation, odors, risks posed by manure application to food crops, accessibility of custom applicators, and use of public roads (Table 1). The overall ranking of barriers to manure use can be found in Table 2. Cost of transportation (68%), odor (58%), timeliness of nutrient availability (55%), concerns related to the field conditions for manure application (50%), and access to labor for manure application (48%) were most frequently indicated as barriers for manure use. Interestingly, several of these factors correspond to those where a difference in the level of concern was observed between advisors and producers (Table 1). However, when considering barrier ranking by agronomic role, 4 of the top 5 barriers are similar between farmers and advisors (cost of transportation, odor, timeliness, and labor availability). Farmers rate concerns with weed seeds as a top 5 barrier, while advisors do not, leaving concerns with field conditions for application as the 6th most selected by crop farmers. This similarity of ranking, even where statistical differences exist, indicates that there is agreement on what are the most significant barriers, but some difference in the perceived seriousness or scale of the barrier. In general, crop farmers less frequently indicated factors as barriers to manure use than did advisors.
Table 1: The frequency survey responses identified selected barriers for manure use. Letters indicated statistical differences in how participants with different roles in agronomic decisions perceived barriers of interest at the alpha = 0.05 level.
Comparison by Role in Agronomic Decisions
Animal Feeding Operator (n=66)
Crop Farmer (n=120)
Private Sector Advisor (n=311)
Public Sector Advisors (n=196)
Compaction from application
36%a
41%a
59%b
40%a
Cost of manure application
55%a
67%ab
84%bc
85%c
Odors an air quality impairment
44%a
56%ab
75%bc
79%c
Manure application to food crop
15%ab
13%a
20%bc
22%c
Accessibility of custom applicators
20%a
19%ab
40%b
3%ab
Use of or crossing of public roads
15%a
11%a
21%b
13%a
Table 2: The frequency all survey responses identified specific factors as barriers for manure use (n=793)
Potential Barrier
% Who perceived as a barrier
Potential Barrier
% Who perceived as a barrier
Potential barrier
% Who perceived as a barrier
Transport
68%
Water Quality
35%
$ of Manure
25%
Odor
58%
Interference with Reduced Tillage
34%
Accessibility
25%
Timeliness
55%
Neighbor Concerns
34%
Legal Issues
25%
Field Conditions
50%
Equipment $
34%
Flies
20%
Labor
48%
Regulation $
32%
Interference with Specialty Crops
19%
Low or Inaccessible Nutrients
47%
Traffic
31%
Risks to Food Crop
15%
Low or Inaccessible Nutrients
47%
Traffic
31%
Risks to Food Crop
15%
Compaction
44%
Planning & Zoning
31%
Road Access
14%
Imbalanced Nutrients
44%
Harm to Local Infrastructure
28%
Foreign Materials
9%
Uniformity
38%
Stockpiles
28%
Reduced Yield
5%
Setbacks
37%
Presence of Applicators
27%
Harmful to Soil
3%
Weed Seeds
37%
Pollution
27%
Preferred Sources of Educational Materials. Among three broad groups of respondents (farmers, advisors, and educators), all identified their peers as an important source of information. Brief factsheets or news articles are identified by educators as their top resource they would use (81% of educator responses and 65% of advisor responses). Recommended research articles also ranked high among all three groups. At this point in time, social media (short videos, podcasts, and Twitter and Facebook) is a preferred resource for a smaller portion of these audiences (26% or farmers, 15% of advisors, and 47% by educators).
Table 3. Most valued resources for agronomic decision making
Resource Type
Farmer (n=197)
Advisor (n=438)
Educator (n=95)
Recommended research articles
49%
53%
55%
Brief fact sheet or news articles summarizing current science
52%
65%
81%
Decision support tool
34%
39%
43%
Short videos or podcasts summarizing current science
20%
12%
36%
Scripted visuals and text for your use on Twitter, Facebook, other
6%
3%
11%
Network of farmers (or advisors or educators) with whom you interact and share experiences
62%
61%
62%
Scripted PowerPoint presentation for use in educational programs
—
—
38%
Future Plans
The intent of this survey was to help our project team and others better understand the characteristics of animal manures that are considered beneficial and barriers to future manure use. Recognition of these benefits and hurdles will be critical as the need to transfer manure nutrients from existing animal feeding operations to crop farms, many with limited previous history of using manure, expands. Matching educational and technical services to the perceptions that impede manure transfer will be necessary.
Future outreach programming should be designed to:
Continue to build general awareness of the agronomic and yield benefits of manure.
Focus on assisting AFO managers and advisors with communication of specific messages such as 1) desirable rates/plans to best meet crop N and P needs, 2) field-by-field estimation of manure’s fertilizer replacement value and nutrients contributing the greatest value, and 3) complementary manure and fertilizer recommendations for optimum yields.
Focus on connecting improved soil health with improved water quality.
Help farmers articulate among themselves and to their rural communities the water quality benefits of organic fertilizers when applied to meet agronomic needs of the crop.
Challenges associated with manure that frequently become barriers to manure use should be addressed through research and outreach. Specifically, the authors wish to suggest that four challenges are commonly regarded as significant barriers to manure use and require focus to overcome:
Transportation Costs: Businesses providing manure hauling and land application services will be important when transferring manure to fields more distant from manure sources, and educational experiences addressing the current costs of transporting manure and the comparative economic benefit achieved by individual fields will be important.
Odor: A farmers’ desire to be a good neighbor is counter to their willingness to create odors for their neighbors. Farmer and advisor education and planning for reducing odor risks is critical. Technology options to forecast, assess, and address potential nuisance odors may help alleviate odor concerns resulting from manure application.
Logistical Barriers: Three logistical issues ranking highest include 1) timeliness of manure application; 2) time/labor availability; and 3) field conditions restricting manure application. Business services for transporting and land applying manure as well as manure brokering services can address many logistical challenges. Alternative application time windows, such as side dressing a crop with manure, will also be valuable.
Agronomic Issues: Manure application comes with a history of agronomic concerns such as compaction, poor uniformity, and potential for weed seed and herbicide resistance concerns. Many issues are likely to be regionally and manure source specific, thus the need to adapt agronomic education to local needs. Education and business services that encourage technologies such as precision manure application and related technologies, designer manures, and manure treatment may have value based upon regional needs. A 4Rs strategy (right rate, source, time, and place) for manure, similar to what is being promoted in the fertilizer industry, may be beneficial.
Authors
Amy Millmier Schmidt, Associate Professor, University of Nebraska-Lincoln
aschmidt@unl.edu
Additional Authors
-Mara Zelt, Schmidt Lab Project Director, University of Nebraska-Lincoln;
-Daniel Andersen, Associate Professor, Iowa State University;
-Erin Cortus, Associate Professor, University of Minnesota;
-Richard Koelsch, Emeritus Professor, University of Nebraska-Lincoln;
-Leslie Johnson, University of Nebraska-Lincoln;
-Siok A. Siek, Undergraduate Student, University of Nebraska-Lincoln; and
-Melissa Wilson, Assistant Professor, University of Minnesota
Acknowledgements
Funding for this project was provided by the North Central Region Sustainable Agriculture Research and Education program. Key partners in survey deployment were the American Agronomy Society Certified Crop Advisor Program, the Fertilizer Institute and Manure Manager magazine.
The authors are solely responsible for the content of these proceedings. The technical information does not necessarily reflect the official position of the sponsoring agencies or institutions represented by planning committee members, and inclusion and distribution herein does not constitute an endorsement of views expressed by the same. Printed materials included herein are not refereed publications. Citations should appear as follows. EXAMPLE: Authors. 2022. Title of presentation. Waste to Worth. Oregon, OH. April 18-22, 2022. URL of this page. Accessed on: today’s date.
Stream Restoration at Mercer County Elks Golf Course, 2019
Grand Lake St. Marys (GLSM), located in Ohio, has experienced harmful algal blooms for decades. In 2010, a massive algal bloom shut down the Lake for the entire summer season. In 2011, the GLSM watershed was declared “distressed,” requiring a new set of rules imposed upon livestock producers in the watershed. These rules required each farm that produced over 350 tons of solid manure or 100,000 gallons of liquid manure per year to create and maintain a nutrient management plan. There was also a winter manure application ban enacted, which prohibits manure application from December 15 to March 1 of each year. These rules still apply to the watershed today.
What Did We Do?
Coldwater Creek Treatment Wetlands, established 2016 (Photo Summer 2021)
An influx of federal and state funds was poured into the watershed to assist the approximately 135 farms with constructing additional manure storage and other best management practices to improve manure management. Over 130 manure storage structures, 80 feedlot covers, 15 waste treatment systems, 20 leachate collection systems and 5 mortality compost structures were built from 2011 through 2019.
KDS Separator Pilot (Swine Manure Solids), March 2018
Other local efforts to improve water quality in GLSM include the restoration and creation of new wetlands to treat stream flow prior to entering GLSM. Since 2010, we have more than doubled the acreage of wetlands along the south side of the lake and have seen an incredible diversification of wildlife in the area. Additional best management practices have also been installed, such as stream restoration projects, saturated buffers, tile phosphorus filters, double cropping, cover crops and much more. Mercer County has also expended a considerable amount of effort to research manure nutrient recovery technologies throughout the last six years. Manure nutrient recovery is challenging due to cost; however, many technologies can achieve a 90+% recovery of phosphorus from manure.
What Have We Learned?
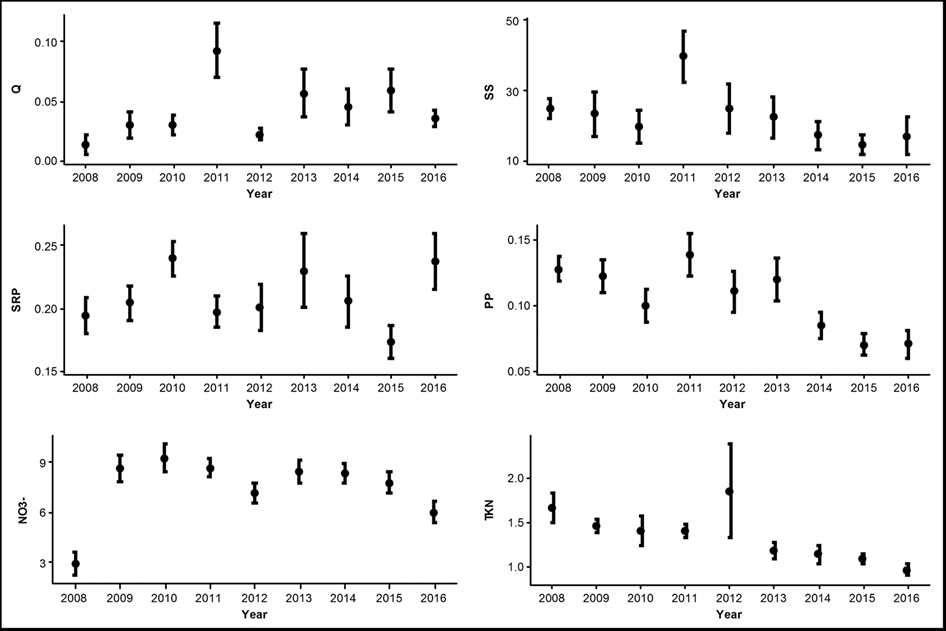
Long-term monitoring data is collected on two streams feeding GLSM, Chickasaw Creek (installed in 2008) and Coldwater Creek (installed in 2010). The data from Chickasaw Creek was used to determine the effects of the best management practices installed along with the effects of the winter manure application ban. The data showed a reduction of 10-40% of nitrogen and phosphorus because of these improved practices (Figure 1).
Figure 1. Nutrient Reduction Trends Pre and Post Distressed Watershed (Pre-Condition 2008-2011; Post-Condition 2012-2016) Jacquemin, etal (2016).
Future Plans
Nutrient management planning is an ongoing effort in the Grand Lake St. Marys watershed and will continue as long as the watershed remains distressed. Research and collaboration continue on manure nutrient recovery and development and adoption of technologies. Monitoring of stream and effectiveness of treatment wetland will also continue to ensure that maintenance and management is conducted appropriately. Additional conservation projects, including wetlands, stream restoration and more are planned in the coming years.
Author
Theresa A. Dirksen, PE, Mercer County, Ohio Agriculture & Natural Resources Director
Additional Information
Jacquemin, Stephen J., Johnson, Laura T., Dirksen, Theresa A., McGlinch, Greg. “Changes in Water Quality of Grand Lake St. Marys Watershed Following Implementation of a Distressed Watershed Rules Package.” Journal of Environmental Quality, January 12, 2018.
Jacquemin, Stephen J., McGlinch, Greg, Dirksen, Theresa, Clayton, Angela. “On the Potential for Saturated Buffers in Northwest Ohio to Remediate Nutrients from Agricultural Runoff.” PeerJ, April 12, 2020.
Dr. Stephen Jacquemin, Wright State University Lake Campus
Mercer Soil and Water Conservation District
Grand Lake St. Marys Restoration Commission
The authors are solely responsible for the content of these proceedings. The technical information does not necessarily reflect the official position of the sponsoring agencies or institutions represented by planning committee members, and inclusion and distribution herein does not constitute an endorsement of views expressed by the same. Printed materials included herein are not refereed publications. Citations should appear as follows. EXAMPLE: Authors. 2022. Title of presentation. Waste to Worth. Oregon, OH. April 18-22, 2022. URL of this page. Accessed on: today’s date.
The objective of this study was to evaluate nutrient dynamics and operational costs within an existing manure Compost Aeration and Heat Recovery system (CAHR) by Agrilab Technologies, Inc. at the Vermont Natural Ag Products (VNAP) compost facility in Middlebury, Vermont in comparison to conventional windrow manure composting where aeration only occurs via turning. Constructed in 2016 and 2017, the CAHR has been fully operational since 2018 and has proven effective at reducing VNAP’s expenditures on #2 heating oil, propane, diesel fuel, and labor (Foster et al., 2018).
The basic design of the CAHR system includes compost windrows placed on a paved pad containing a shallow trench oriented longitudinally with the windrow. The trench contains perforated High Density Poly Ethelene (HDPE) piping bedded in wood chips. These pipes are connected to solid, insulated HDPE piping which runs to a shipping container outfitted with circulation fans and a heat exchanger. While the circulation fans are negatively aerating (i.e., pulling vapor from) the compost, warm vapor entering the system transfers heat energy to water piped through the heat exchanger. Heat recovered from compost windrows has been used to heat the site’s bagging building via radiant floor heating and to dry finished compost prior to the screening and bagging process. Furthermore, due to elevated oxygen levels provided by positive and negative aeration, CAHR-treated compost has been reported to mature more quickly and require less turning, reducing diesel, labor, and equipment maintenance costs (Foster et al., 2018).
What Did We Do?
Two compost windrows of equivalent feedstock contents and ratios were monitored. Our control, denoted as “TRAD”, was a conventionally treated windrow that did not receive aeration aside from periodic windrow turning with a Komptech Topturn x53 compost turner. Our experimental windrow, denoted as “CAHR”, received periodic positive and negative aeration via the CAHR system, as well as aeration through periodic turning. The initial volumes of the TRAD and CAHR windrows were 480.2 CY and 548.8 CY, respectively.
Compost samples were collected between August 24th, 2021 and December 15th, 2021. For the first thirteen weeks of the sampling period, samples were taken thrice weekly from both treatments. At the end of the thirteenth week, on November 19th, VNAP staff deemed the CAHR treatment compost suitable for market and it was pulled for processing. Sampling continued once weekly for the TRAD treatment for another four weeks, terminating on December 15th, when the TRAD windrow was pulled for processing. This resulted in a total of 43 samples of TRAD and 39 samples of CAHR composts.
What Have We Learned?
This study evaluated nutrient status, financial cost, and energy cost for a pair of commercial compost windrows in a normal production setting. From a time and space management standpoint, compost treated with a forced-aeration system was deemed suitable for market in approximately 75% of the time as a conventionally turned windrow; 13 and 17 weeks, respectively. Analysis of nitrogen species status throughout the study suggests that greater nitrogen losses occurred during conventional treatment than during CAHR treatment, presumably due to higher rates of denitrification and ammonia volatilization. Data also suggest a lower risk for phosphorus loss through leaching from CAHR-treated compost, as water extractable phosphorus (WEP) concentrations were consistently higher in the conventional treatment. During the active composting process, it was found that operational costs for CAHR compost were 2.1 times more expensive financially and 5.5 times more energy-intensive than a conventional compost on a per CY basis. However, the energy and infrastructure cost offsets provided by the CAHR system (as operated at VNAP) could provide a net savings of $4.06/CY finished compost. In this study, with paired windrows of approximately 12 feet in width, it was shown that a CAHR system produced a comparable compost product, with higher operational input, in less time.
Furthermore, the data suggest that land application of either compost treatment evaluated in this study may reduce phosphorus loss due to leaching versus direct manure application. For example, WEP concentrations in the finished composts in this study ranged between 0.256 and 0.304 g/kg on a dry weight basis, while WEP concentrations in dairy manures have been found to range between 1.98 and 4.0 g/kg (P. Kleinman et al., 2007; P. J. A. Kleinman et al., 2005). It is probable that either compost treatment, when applied to agricultural land, would release less phosphorus as WEP during rainfall events than direct manure application, providing water quality benefits.
Future Plans
The Newtrient CIG will continue to evaluate 13 more technologies over the next 2 years to determine their effect on water quality.
Authors
Mark Stoermann, Chief Operating Officer, Newtrient LLC
Corresponding author email address
Mstoerm@newtrient.com
Additional authors
Finn Bondeson, Graduate Student, University of Vermont; Joshua Faulkner, Research Assistant Professor and Farming and Climate Change Program Coordinator, University of Vermont; and Eric Roy, Assistant Professor, Interim Director of Environmental Sciences Program, University of Vermont
Additional Information
Newtrient.com
The authors are solely responsible for the content of these proceedings. The technical information does not necessarily reflect the official position of the sponsoring agencies or institutions represented by planning committee members, and inclusion and distribution herein does not constitute an endorsement of views expressed by the same. Printed materials included herein are not refereed publications. Citations should appear as follows. EXAMPLE: Authors. 2022. Title of presentation. Waste to Worth. Oregon, OH. April 18-22, 2022. URL of this page. Accessed on: today’s date.
Animal manures contain nutrients [primarily nitrogen (N) and phosphorus (P)] and organic material that are beneficial to crops. Unfortunately, for economic and logistics reasons, liquid dairy and swine manure tends to be applied to soils near where it is generated. Over time, P concentrations in soils where dairy manure is applied builds up, often in excess of crop demands. We previously (Church et al., 2016, 2017) and have subsequently built, a full-scale version of a MAnure PHosphorus EXtraction (MAPHEX) System capable of removing greater than 90 percent of the P from manures. While originally designed to remove phosphorus, we have also shown that the MAPHEX System was also capable of removing odor and microbes, and of concentrating alkalinity into a solid, economically transported form. We have also lowered daily operating costs by testing the effect of lower-cost chemicals as alternatives to ferric sulfate, and by showing that the diatomaceous earth (DE) filtering material can be recycled and reused. We are currently building a system capable of treating over 100,000 gallons of Dairy Manure per day. This system is planned to be operational for demonstrating starting summer 2022.
Purpose
Swine and dairy manures are typically in slurry form and contain nutrients [primarily nitrogen (N) and phosphorus (P)] and organic material that are beneficial to crops. Unfortunately, the concentrations of nutrients in both manures are too low to make transportation of bulk manures over large distances economically viable. Furthermore, since it must be transported in tanks, that transportation is inconvenient as well. Therefore, these manures tend to be applied to soils near where they are generated, and, over time, P concentrations in soils increase to the point that soil P concentrations are often in excess of crop demands. Furthermore, because of the implication that P runoff from agricultural operations plays an important role in eutrophication of streams and other water bodies, farmers are experiencing increasing pressures and regulation to not apply animal manures to those soils.
We previously reported on an invention that 1) is designed to be a solution to the P overloading that happens when unnecessary P is added to agricultural soils, 2) is scalable such that it can be used as a mobile system, and 3) has shown to be capable of removing greater than 90 percent of the P from a wide range of dairy manures, while retaining greater than 90% of the N in the final effluent for beneficial use by the farmer.
What Did We Do?
We subsequently built a full-scale version of a MAnure PHosphorus EXtraction (MAPHEX) System capable of removing greater than 90 percent of the P from manures and have tested it on dairy manures. We also focused our efforts on lowering the daily operating costs of the system by developing a method to recover and reuse the diatomaceous earth used in the final filtration step, and testing alternative, lower cost chemicals that can be used in the chemical treatment step. We also performed pilot-scale tests on swine manures.
What Have We Learned?
The full-scale MAPHEX System removed greater than 90% of P from a wide variety of dairy manures, while leaving greater than 90% of the N in the final effluent to be used beneficially to fertigate crops. The System was also shown to recover and concentrate alkalinity into a solid form on a farm that used greater amounts of lime during manure handling, remove 50% of the odor from dairy manure and to remove greater than 80% of Total coliforms and E. Coli. Furthermore, the System has not shown to alter the pH of the final effluent respective to raw manures as other treatment technologies can. We have lowered daily operating costs by testing the effect of lower-cost chemicals as alternatives to ferric sulfate, and by showing that the diatomaceous earth (DE) filtering material can be recycled and reused.
In pilot-scale swine testing, we found that the MAPHEX System can remove greater than 96% of the phosphorus in swine manures. This essentially P free effluent can be beneficially used for fertigation without further loading the receiving soils with P. Scaling up the pilot-scale testing has the potential to reduce swine manure storage volumes to allow for mitigation of overflow problems during large storms. Furthermore, the pilot-scale study suggests that capital equipment costs and treatment costs for swine manure would be lower than for treating dairy manure.
Future Plans
We are currently building a simplified version of the MAPHEX System that will be capable of treating over 100,000 gallons of dairy manure per day. This system is planned to be operational for demonstrating starting summer 2022. We plan to use this simplified version for demonstration tests, and use the results obtained to model the effects of using MAPHEX technology compared to conventional manure handling practices on two paired watersheds. We also plan to demonstrate the full-scale system on a wide range of swine manures with on-farm testing.
Author
Clinton D. Church, Research Chemist, USDA-ARS University Park, PA
Corresponding author email address
Cdchurch.h2o@netzero.com
Additional Information
Church, C. D., Hristov, A. N., Bryant, R. B., Kleinman, P. J. A., & Fishel, S. K. (2016). A novel treatment system to remove phosphorus from liquid manure. Applied Engineering in Agriculture, 32: 103 – 112. doi:10.13031/aea.32.10999
Church, C. D., Hristov, A. N., Bryant, R. B., & Kleinman, P. J. A. (2017). Processes and treatment systems for treating high phosphorus containing fluids. US Patent 9,790.110B2.
Church, C. D., Hristov, A. N., Kleinman, P. J. A., Fishel, S. K., Reiner, M. R., & Bryant, R. B. (2018). Versatility of the MAPHEX System in removing phosphorus, odor, microbes, and alkalinity from dairy manures: A four-farm case study. Applied Engineering in Agriculture, 34: 567 – 572. doi:10.13031/aea12632
Church, C. D., Hristov, A., Bryant, R. B., & Kleinman, P. J. A. (2019). Methods for Rejuvenation and Recovery of Filtration Media. USDA Docket Number 129.17. U.S. Patent Application Serial No. 62/548,23
Church, C. D., S. K. Fishel, M. R. Reiner, P. J. A. Kleinman, A. N. Hristov, and R. B. Bryant. 2020. Pilot scale investigation of phosphorus removal from swine manure by the MAnure PHosphorus Extraction (MAPHEX) System. Applied Engineering in Agriculture 36(4): 525–531. doi: 10.13031/aea13698
The authors are solely responsible for the content of these proceedings. The technical information does not necessarily reflect the official position of the sponsoring agencies or institutions represented by planning committee members, and inclusion and distribution herein does not constitute an endorsement of views expressed by the same. Printed materials included herein are not refereed publications. Citations should appear as follows. EXAMPLE: Authors. 2022. Title of presentation. Waste to Worth. Oregon, OH. April 18-22, 2022. URL of this page. Accessed on: today’s date.
Previous evaluations of the technologies investigated were conducted in a batch mode of testing. This program was conducted to demonstrate the viability of the technologies investigated to significantly reduce phosphorus when operated in a continuous mode, pulling manure directly from a deep pit swine operation without agitating the pit. Additionally, this demonstration also explored the ability of several dewatering technologies to produce a stackable product containing the high phosphorus recovered in the form of amorphous calcium phosphate. Considerable data on this final product was collected from multiple off-site takers expressing interest in the final product. Figure 1 is a picture of the pilot setup.
Figure 1: Pilot Setup
What Did We Do?
Mobile test units were employed at a swine operation representative of a typical operation in Mercer County, OH. Manure was directly pulled from the deep pit at the host farm, and after initial dewatering, it was treated under conditions consistent with a detailed program conducted under sponsorship from Ohio Farm Bureau in summer 2019. Treated manure was then sent to multiple dewatering options including passive dewatering (geotextile bags) and mechanical separation. The demonstration program ran for six months and a total of 110,000 gallons of manure was treated continuously with multiple samples collected for analysis at third-party certified labs.
Twenty cubic yards of the initial manure solids were collected for use by a Cleveland off-site taker to investigate its viability as a composting foundational ingredient, while several different off-site takers were sent samples of the final dewatered material containing the recovered phosphorus. An additional three tons of stackable final product were sent to several off-site takers in Allen County, IN for use and evaluation, an additional 20 cubic yards of the geobag containing product were sent to a local farmer for application in a 40 acre wheat field and the remainder of the material (both manure solids and geobag material) were land applied by the host farm.
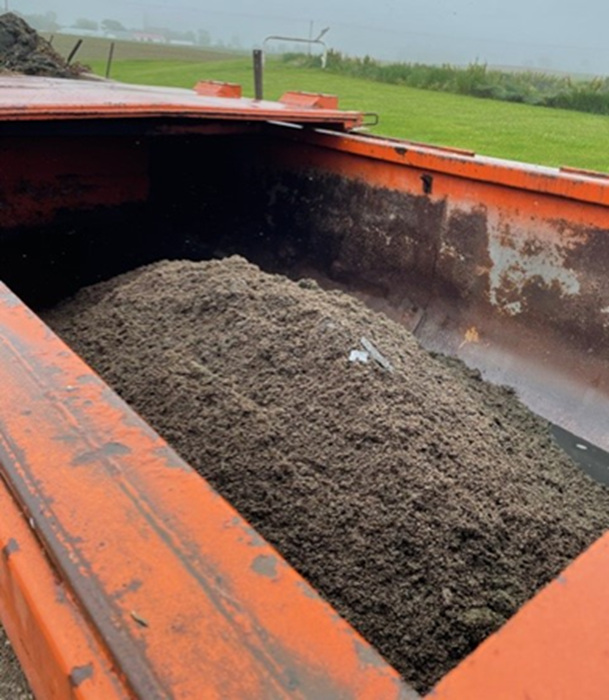
Figure 2 is a picture of the dewatered manure solids collected.
Figure 2: Dewatered manure solids
Figure 3 is a picture of the recovered phosphorus product.
Figure 3: Recovered phosphorus product
What Have We Learned?
We were able to confirm that the technologies demonstrated performed as expected when operating in a continuous mode. An average initial dewatered manure cake of 20.8% solids was obtained without the use of polymers and a consistent stackable product of 24.4% was obtained with the mechanical dewatering equipment used. An average of 96.1% recovery of total phosphorus was obtained during the pilot. This value compares to the average total phosphorus reduction of 95.5% measured at the batch mode operation in summer 2019. Limitations of the equipment used limited operation to approximately 7gpm but with properly sized pumps, this could be increased.
The operating cost of treatment averaged out to $0.0063/gallon (measured at $0.0064 in summer 2019). To dewater the product to stackable form varied depending on the equipment used, but costs of close to $0.01/gallon have been estimated. For the application demonstrated, the use of a geobag for final dewatering was not considered a viable option due to high costs (approximately $0.15/gallon treated) and the space required.
Future Plans
The Maumee Valley Authority was awarded an USDA Conservation Grant in partnership with Allen / Adams County of Indiana and Applied Environmental Solutions to further demonstrate continuous flow operation over an extended duration at a deep pit swine, dairy and mixed manure lagoon operation. A major focus of this effort will be in establishing the value and path to market for co-product streams produced. Additionally, efforts are underway to design and build a portable unit capable of treating 500,000 gpd of manure over a 3-5 day period. This would allow for treatment at smaller farms without the need for capital outlay by the individual farms. One purchaser of this design has already been identified for delivery in 2023.
In addition to the above, initial testing of a companion technology for the recovery of ammonia is also under investigation. Ammonia can be recovered in any number of ammonium salts (such as ammonium sulfate) and represents another opportunity to maximize the resource recovery from agricultural streams.
Authors
Presenting author
Rick Johnson, Director of Commercial Development, Applied Environmental Solutions
Corresponding author
Theresa Dirksen, Agriculture & Natural Resources Director, Mercer County (OH)
The authors are solely responsible for the content of these proceedings. The technical information does not necessarily reflect the official position of the sponsoring agencies or institutions represented by planning committee members, and inclusion and distribution herein does not constitute an endorsement of views expressed by the same. Printed materials included herein are not refereed publications. Citations should appear as follows. EXAMPLE: Authors. 2022. Title of presentation. Waste to Worth. Oregon, OH. April 18-22, 2022. URL of this page. Accessed on: today’s date.
Intensive animal husbandry produces large volumes of liquid manure with significant amounts of phosphorus, ammonium, and potassium as they pass through the feed of farm animals. As a result, direct land application of manure, the current common approach, causes environmental concerns such as soil over-fertilization and groundwater and surface water contamination, which leads to eutrophication. Manure nutrient management is, therefore, necessary to address these problems. While most engineering options are focused on phosphorus and ammonium recovery, few studies have pursued recovery methods for potassium. In this talk, we present an electrochemical technology using a sacrificial magnesium anode and a stainless-steel cathode for simultaneous recovery of phosphorus and potassium in the form of potassium-magnesium-phosphate (KMgPO4·xH2O, K-struvite).
Mg2+ + K+ + HnPO4n-3 + 6H2O = KMgPO4*6H2O + nH+
K-struvite has the potential to be used as a slow-release fertilizer and this technology will add flexibility to the manure management strategies currently available by diversifying the recoverable by-products.
What Did We Do?
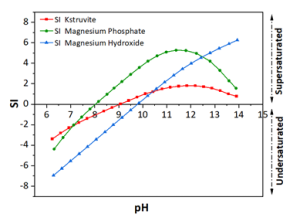
Figure 1. Calculated saturation index values as a function of pH. The water matrix contains 3000 mg/L potassium, 1000 mg/L phosphate, and magnesium with Mg:P ratio of 1.4.
To predict the thermodynamic stability of K-struvite, a thermodynamic model was developed based on the average ion concentrations of phosphorus, and potassium measured in real liquid pig manure (Figure 1). According to this model, magnesium phosphate is a possible by-product of K-struvite precipitation. Also, the probable formation of magnesium hydroxide was enhanced with increasing pH value due to the increase in hydroxide ion concentration. As a result, the ideal range for precipitation of K-struvite lies at pH values between 10 and 11.
To understand the role of pH on K-struvite formation, a 50 mM KH2PO4 solution was used to perform the preliminary batch electrochemical experiments. A constant voltage of -0.8 V vs. the Ag/AgCl reference electrode was applied to the pure magnesium anode using a potentiostat. One experiment was performed on the natural pH of the initial solution, 4.5, while potassium hydroxide was used to raise the initial pH of the second experiment to 9.5.
What Have We Learned?
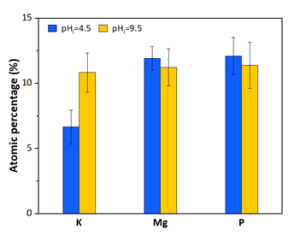
Figure 2. The EDS results obtained of the recovered precipitates (a) pH=4.5, (b) pH=9.5 in 50 mM KH2PO4.
Energy-dispersive x-ray spectroscopy (EDS) of the recovered precipitates (Figure 2) indicate that by raising the initial pH from 4.5 to 9.5 the amount of potassium is increased in the precipitates. Also, due to the equimolar ratios of K:Mg:P at pH=9.5, the produced precipitates are likely K-struvite, while the pH= 4.5 sample likely contains some amount of magnesium phosphate.
This process also eliminates the disadvantages of the commonly used chemical precipitation methods, including magnesium salt dosing, and adding base to the system for pH control, due to in situ magnesium corrosion and hydroxide production at the magnesium anode surface. These advantages could potentially reduce the operating cost of the system and eliminate the addition of unnecessary salinity to wastewater through magnesium salt dosing.
Future Plans
Further investigation by using multiple characterization techniques (e.g., x-ray diffraction (XRD) and Fourier transform infrared spectroscopy (FT-IR)) is necessary to identify the exact nature of precipitates. The initial experiments will be repeated at additional pH values to further understand the role of pH on the precipitation of K-struvite in the simplified synthetic wastewater and to further detail the characterization of the composition and morphology of K-struvite precipitates. These experiments are valuable , particularly because there are few literature reports that detail the physical and chemical structure of K-struvite.
Authors
Presenting author
Amir Akbari, Ph.D. Candidate, Department of Chemical and Biomedical Engineering, Pennsylvania State University
Corresponding author
Lauren F. Greenlee, Associate Professor, Department of Chemical and Biomedical Engineering, Pennsylvania State University
Corresponding author email address
greenlee@psu.edu
Additional Information
Once completed, future publications and data repository information will be available at https://sites.psu.edu/greenlee/
Acknowledgements
The authors would like to thank the U.S. Department of Agriculture, NIFA AFRI Water for Food Production Systems (#2018-68011-28691) for providing the funding support of this research through the “Water and Nutrient Recycling: A Decision Tool and Synergistic Innovative Technology” project.
The authors are solely responsible for the content of these proceedings. The technical information does not necessarily reflect the official position of the sponsoring agencies or institutions represented by planning committee members, and inclusion and distribution herein does not constitute an endorsement of views expressed by the same. Printed materials included herein are not refereed publications. Citations should appear as follows. EXAMPLE: Authors. 2022. Title of presentation. Waste to Worth. Oregon, OH. April 18-22, 2022. URL of this page. Accessed on: today’s date.
As a pollutant in water resources, nitrate is a target contaminant for removal by water treatment technologies. Therefore, it is necessary to develop new techniques of water treatment to remove nitrate from water resources. This study worked on developing a new technique for nitrate reduction and to produce valuable ()/harmless () products without employing energy-intensive processes. To reach this goal, it is necessary to understand the possibilities and the pathways of nitrate reduction by negatively and positively charged, and hydrophobic peptide-coated Au electrodes. Also, stability and kinetics analysis will help us to understand the durability and capability of peptide-coated Au electrodes for nitrate reduction.
What Did We Do?
In this study three different types of peptides including, hydrophobic (V type), negatively charged (E type), and positively charged (K type) peptides were synthesized. The synthesized peptides were coated on the surface of bare Au. To assess the response of peptide- coated Au electrodes, and to compare them with bare Au, cyclic voltammetry (CV) experiments were employed. To do the CVs, an electrochemical cell with the gold electrode (working electrode), platinum (counter electrode) electrode, and a background solution (0.5 M) were used for electrochemical experiments. As a source of nitrate, 0.1 M sodium nitrate was added to the background solution. Cyclic voltammetry trials were done on three different peptide-coated Au electrodes and bare Au electrode, with a scan rate of 20 mV/s. After CV analysis, and to analyze the products of nitrate reduction, potential hold experiments were done on peptides with promising responses to the CV experiments. In other words, a potential hold experiment with a potential equal to the onset potential of peptide-coated Au electrodes were employed for 1 hour. During the potential hold trials, samples were analyzed using Ultraviolet–visible spectroscopy method in time intervals (e.g., every 10 minutes) to measure the concentration of ammonia and nitrite.
What Have We Learned?
Based on the preliminary results, Au electrodes coated by E and V peptides showed promising responses to the applied potential. Results indicate that reduction of nitrate takes place at the onset potentials of -0.35V and -0.23V versus reversible hydrogen electrode (RHE) for E and V types of peptide-coated Au electrodes, respectively. However, bare Au did not show a reduction peak in the voltammogram. Results of potential hold experiment and product analysis indicate that V and E peptide-coated Au electrodes are capable of nitrate reduction to both nitrite and ammonia. However, bare Au electrode can only reduce nitrate to ammonia.
Future Plans
To have a comprehensive analysis of products, gas chromatography will be used to measure the products (e.g., hydrogen and nitrogen) in gaseous phase. Also, to investigate the structure and stability of thiolate– gold bonding on the surface of Au electrodes, Fourier transform infrared (FTIR) method will be employed before CV, and potential hold experiments. A mass balance between products and nitrate available in the background solution will be done. Moreover, the rate and kinetics of nitrate reduction will be assessed using the product analysis data.
Authors
Presenting author
Arash Emdadi, Ph.D. student, Pennsylvania State University
Corresponding author
Lauren F. Greenlee, Associated Professor, Pennsylvania State University
Julie Renner, Assistant Professor, Case Western Reserve University; Amir Akbari, Ph.D. student, Pennsylvania State University
Additional Information
Matteo Duca, Marc T. M. Koper, Powering denitrification: the perspectives of electrocatalytic nitrate reduction, Energy Environ. Sci., 2012, 5, 9726-9742. https://doi.org/10.1039/C2EE23062C
Phebe H. van Langevelde, Ioannis Katsounaros, Marc T. M. Koper, Electrocatalytic Nitrate Reduction for Sustainable Ammonia Production, Joule, 2021, 5, 290–294. https://doi.org/10.1016/j.joule.2020.12.025
Acknowledgements
The authors acknowledge funding from the USDA NIFA AFRI Water for Food Production Systems program, grant #2018-68011-28691.
The authors are solely responsible for the content of these proceedings. The technical information does not necessarily reflect the official position of the sponsoring agencies or institutions represented by planning committee members, and inclusion and distribution herein does not constitute an endorsement of views expressed by the same. Printed materials included herein are not refereed publications. Citations should appear as follows. EXAMPLE: Authors. 2022. Title of presentation. Waste to Worth. Oregon, OH. April 18-22, 2022. URL of this page. Accessed on: today’s date.
Whether at the farm, integrator or industry level, sustainability programs have unique goals, metrics and approaches. In many cases, there is no definitive path for meeting long-term goals, but in the ambiguity is opportunity. Meeting sustainability goals will take a community of persons on and off farm willing to support measurements, communication and technology development. This session builds on the Livestock and Poultry Environmental Learning Community’s (LPELC) September 2021 Webinar, Industry Initiatives for Environmental Sustainability – a Role for Everyone.
This Waste to Worth workshop features small and large group discussions to identify modes for active participation in livestock and poultry sustainability initiatives.
What Did We Do?
Industry-led sustainability programs are in various stages of charting a destination for environmental metrics, like greenhouse gas emissions, water quality, water use, etc. However, with respect for the range of individual farm resources, climates and systems, there is no prescriptive path.
As farmers and organizations chart their own sustainability journey, there is a need for on-farm baseline metrics, goal setting, and technology guidance. LPELC’s mission is to provide on-demand access to “the nation’s best science-based resources that is responsive to priority and emerging environmental issues associated with animal agriculture” (LPELC.org). The LPELC is in a strong position to share science and support communication efforts. However, like sustainability journeys, LPELC needs a roadmap.
This workshop will illuminate what resources are currently available, knowledge, technology and communication gaps, and how LPELC members can support on-farm sustainability initiatives. Participants will collectively shape a logic model for a “Community of Support for Producer Engagement in Livestock Industry Environmental Sustainability Initiatives”.
What Have We Learned?
A summary of the workshop results will be shared following the conference.
Future Plans
We intend the workshop results to foster stronger networks and collaborative directions for advancing on-farm sustainability initiatives. We aim for short, medium and long-term outcomes that include stronger understanding of current efforts within the livestock industries and LPELC, along with support mechanisms for decision making and funding opportunities.
Authors
Erin Cortus, Associate Professor and Extension Engineer, University of Minnesota
Corresponding author email address
ecortus@umn.edu
Additional authors
Marguerite Tan, Director of Environmental Programs, National Pork Board; Hema Prado, Director of Sustainability, American Egg Board; Michelle Rossman, Vice President – Environmental Stewardship, Dairy Management Inc.
The authors are solely responsible for the content of these proceedings. The technical information does not necessarily reflect the official position of the sponsoring agencies or institutions represented by planning committee members, and inclusion and distribution herein does not constitute an endorsement of views expressed by the same. Printed materials included herein are not refereed publications. Citations should appear as follows. EXAMPLE: Authors. 2022. Title of presentation. Waste to Worth. Oregon, OH. April 18-22, 2022. URL of this page. Accessed on: today’s date.
Manage Cookie Consent
To provide the best experiences, we use technologies like cookies to store and/or access device information. Consenting to these technologies will allow us to process data such as browsing behavior or unique IDs on this site. Not consenting or withdrawing consent, may adversely affect certain features and functions.
Functional
Always active
The technical storage or access is strictly necessary for the legitimate purpose of enabling the use of a specific service explicitly requested by the subscriber or user, or for the sole purpose of carrying out the transmission of a communication over an electronic communications network.
Preferences
The technical storage or access is necessary for the legitimate purpose of storing preferences that are not requested by the subscriber or user.
Statistics
The technical storage or access that is used exclusively for statistical purposes.The technical storage or access that is used exclusively for anonymous statistical purposes. Without a subpoena, voluntary compliance on the part of your Internet Service Provider, or additional records from a third party, information stored or retrieved for this purpose alone cannot usually be used to identify you.
Marketing
The technical storage or access is required to create user profiles to send advertising, or to track the user on a website or across several websites for similar marketing purposes.