Yield and Economic Impact of Fall Versus Spring Applied Manure on Wheat

Livestock and Poultry Environmental Learning Center:

Home Page

All articles about:

Research Summaries

Manure Nutrients

Many questions are asked concerning the right time or the right crop to apply manure.

  • Is there a difference in nitrogen (N) availability if it is applied in the spring or the fall?
  • Is there a difference between crops with early season N demand vs. late season N demand?

To answer these questions a study was initiated at the NDSU Carrington Research Extension Center in 2008 and repeated in 2009 to determine the impact of fall vs. spring applied beef feedlot manure on hard red spring wheat yield and kernel protein.

Activities

Treatments included; fall applied manure, spring applied manure, spring applied urea N and a check with no N. In 2008, the treatments were applied in a no-till situation and in 2009 the treatments were incorporated with one pass tillage. The treatments were applied to supply 150 lb N/acre after crediting soil residual N. The manure treatments were applied assuming 50% of the total N would be available in the first crop year of application. The fall manure was applied in early-November both years. Spring manure and urea were applied in mid-April both years preceding planting. To decrease N volatilization under no-till in 2008, the urea was applied during a rain event 4 hours before planting. In 2009, the urea was incorporated at the same time as application.

What Did We Learn?

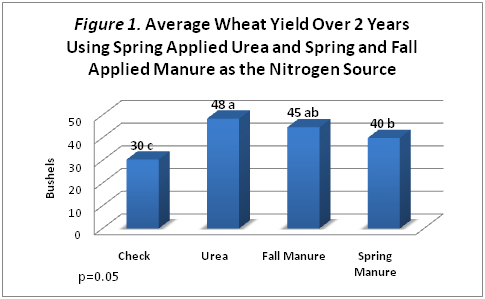
According to Figure 1, the spring applied urea and fall manure treatment had the highest yield. The spring applied manure was significantly less yielding than the urea treatment, but not the fall manure treatment.

Wiederholt spring vs fall manure figure 1.jpg


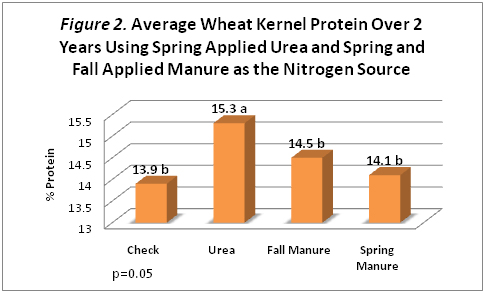
As shown in Figure 2, the urea treatment also had the highest level of kernel protein percentage. The remaining three treatments were all statistically similar and significantly less than the urea treatment.

Wiederholt spring vs fall manure figure 2.jpg


Economics

To provide an economic perspective, nitrogen prices were factored into this study. Area fertilizer dealers provided urea price quotes that equated to $0.45/lb of available nitrogen. An $0.11/lb value of manure nitrogen was determined from manure fertility analysis combined with the cost of hiring a custom manure operator to haul and apply the manure at the Carrington Research Extension Center. The nitrogen input costs were $67.50/ac for urea and $16.50/ac for manure treatments, respectively. Costs associated with urea application were not included since it is often combined with other field operations.

Figure 3. Dollars netted from different nitrogen sources applied on spring wheat.


Gross income was determined by multiplying the price of a bushel of wheat (discounted for protein) by the yield for each treatment. By producing the most and highest quality wheat, the urea treatment grossed the highest at $273.60/ac for 48 bu/ac at $5.70/bu. Gross income on the fall-applied manure treatment was $243.00/ac for 45 bu/ac at $5.40/bu, and the spring-applied manure treatment grossed $198.00/ac for 40 bu/ac at $4.85/bu. The untreated check grossed $141.00/ac for 30 bu/ac at $4.80/bu.

Although the urea treatment grossed the most money the urea nitrogen bill was more than four times greater ($67.50/ac) than the manure treatments ($16.50/ac). Calculating the net return (market price less nitrogen costs) on the use of the fertilizer shows fall-applied manure ($226.50/ac) netted the most with traditional urea ($206.10/ac) second, followed by spring-applied manure ($181.50/ac). The untreated check ($141.00/ac) was last (Figure 3).

Discussion

After two years with different weather conditions, wheat response to manure assuming 50% availability was not as favorable as urea. Manure N needs to be converted by soil bacteria or fungi from an organic to an inorganic form to be available for plant uptake. Wheat is a short season crop with high N demand early in the growing season. Therefore, N mineralized from manure at rates assuming 50% availability may not be available soon enough for the quickly developing wheat crop.

Manure application studies conducted at the Carrington Research Extension Center using corn as the target crop have shown no differences in yield when manure or commercial N was used assuming manure N availability calculated at 50%. Several things happen that may impact the wheat vs. corn response to manure. Assuming 50% of the total N in manure is available for crop uptake in year 1 of application may not meet wheat N needs. More research is needed to determine what plant available N percentage assumption is needed for wheat and other short season cereal grains. Secondly, the spring weather conditions in both 2008 and 2009 were significantly cooler than the average ND spring weather. Since manure N mineralization is driven by biological processes, the cooler than average temperatures may have had more impact on N availability than is typical.

However, while urea out produces manure when only yield is considered, fall-applied manure can return a greater profit per acre because of its cost effectiveness. Producers who do apply manure as a fertilizer for spring wheat, may want to apply a low rate of commercial N fertilizer at planting to maximize yield and return. As a side note, fall manure applications produce higher yields and better quality spring wheat than spring-applied manure.

Authors

Ron Wiederholt and Chris Augustin, NDSU Nutrient Management Specialists
Carrington Research Extension Center, Carrington, ND

This research summary is not peer-reviewed and the authors have sole responsibility for the content.

What’s the P Index?

The P Index is the Phosphorus Index, a risk assessment tool to quantify the potential for phosphorus runoff from a field. The P Index helps to target critical source areas of potential P loss for greater management attention. It includes source and transport factors. Source factors address how much P is available (for example, soil test P level and P fertilizer and manure application amounts). Transport factors evaluate the potential for runoff to occur (for example, soil erosion, distance and connectivity to water, soil slope, and soil texture). The P Index allows for relative comparisons of P runoff risk. When the P Index is high, recommendations are made either to apply manure on a P basis or not to apply manure at all. When the P Index is low, manure can be applied on a N basis. Also, if the P Index is high, the factors that are responsible for the higher risk of P loss are identified, and this information provides guidance for management practices to reduce the risk. For example, if the P Index is high because of high soil erosion, a recommendation to implement soil conservation best management practices (BMPs) may lower the risk and allow safe manure application.

For additional information:

To find your state’s P Index, do a web search for “phosphorus index” plus your state name.

Author: Jessica Davis, Colorado State University

How do you calibrate a manure spreader?

Calibrating a manure spreader is critical to ensure that the appropriate rate of manure nutrients is being applied to a field. For some livestock operations, this practice may be a required practice as part of their permit. Calibration will differ depending on the equipment and type of manure being applied.

If you know the capacity of the spreader, you need to determine the width of each pass and the distance it takes to empty the spreader to determine the rate of application. A measuring wheel is a useful tool and can often be borrowed from a local Cooperative Extension or Natural Resources Conservation Service (NRCS) office. After you have determined both of those measurements, use the charts in the publication linked below to determine application rate.

If the capacity of the manure spreader is unknown and solid manure is being spread, you can use a process that involves setting out plastic sheets or tarps of known size and driving the manure spreader over them and weighing the amount of manure that is collected on the sheets. A 22-square-foot tarp is a convenient size because the net weight of the manure on the sheet will be equal to the application rate in tons per acre. A step-by-step guide on making these calculations for other size tarps is available in the publication linked below.

For more, including specifics on calibrating solid, liquid, and irrigation manure equipment, visit Calibrating Manure Application Equipment.

Author: Jill Heemstra, University of Nebraska Extension Educator

Swine WFNB Tools

Tools

Whole Farm Nutrient Balance Calculator for Swine Farms

This tool is a Microsoft Excel based program that calculates the WFNB.

WFNB is a method for defining the overall nutrient use facility on a livestock facility including both the animal and cropping system. It encourages comparison of all nutrients entering and exiting a livestock farm with the goal of achieving a ratio of 1 lb input to 1 lb managed output. It also can be used to evaluate all nutrient management options for achieving a sustainable production facility for nutrients.

Introduction to Opportunities Checklist for My Farm’s Whole Farm Nutrient Balance

Reductions in nutrient losses to the environment may depend upon the following changes: storage and handling practices, feed management, nutrient management planning, exporting of manure, etc.

Opportunities Checklist for Feed Management

If an estimate of Whole Farm Nutrient Balance for your farm identified opportunities for nitrogen or phosphorus balance improvement, then consider feed management practices for their potential to improve a nutrient balance.

Opportunities Checklist for Cropping System

If an estimate of Whole Farm Nutrient Balance for your farm identified opportunities for nitrogen or phosphorus balance improvement, then consider crop management practices for their potential to improve a nutrient balance.

Opportunities Checklist for Manure Export

If an estimate of Whole Farm Nutrient Balance for your farm identified opportunities for nitrogen or phosphorus balance improvement, then consider manure export practices for their potential to improve a nutrient balance.

Opportunities Checklist Manure Treatment, Storage, and Handling

If an estimate of Whole Farm Nutrient Balance for your farm identified opportunities for nitrogen or phosphorus balance improvement, then consider manure storage and handling practices for their potential to improve a nutrient balance.

Nutrient Planning on Swine Farms

Introduction


LESSONS LEARNED – See links below for more detail.
Mouse over the bottom of the slide to slow or pause slides.

Thirteen swine producers from Corn Belt states participated in a project with faculty from University of Nebraska and Purdue University to understand the movement of nutrients (nitrogen and phohsphorus) on commercial swine facilities. These farms ranged in size from 2,000 to 16,000 head finishing capacity with most farms being wean to finish or feeder pig to finish operations. The project team developed a whole farm nutrient balance for each farm for both 2006 and 2007 based upon farm specific data.

Primary project outcomes include an understanding of the primary sources of nutrients arriving on these farms, the magnitude of imbalances experience by these farms, and the value of specific nutrient management practices to minimizing the nutrient imbalances experienced by swine production.

To learn more about the concept of Whole Farm Nutrient Balance (WFNB), the lessons learned from this on-farm research, and the tools developed for use by producers, the following introduction is suggested:

WFNB for Pork Production – An Introduction

Lessons Learned

Tools

Archived Workshop on WFNB

  • Introduction to WFNB
  • Lessons Learned from 13 Commercial Swine Facilities
  • Introduction to WFNB Tools

Authors:

This project was funded by The National Pork Board. The authors wish to extend their appreciation for the financial support provided for completing this on-farm research project.

Overview of Nutrient Management Lessons Learned

About the Participating Farms

Take Home Message
Thirteen swine farms demonstrated significantly better nutrient management over previous studies as measured by Whole Farm Nutrient Balance. Feed program for phosphorus, manure storage selection, and nutrient plan implementation proved to be the most critical factors.

Thirteen pork production facilities in Indiana, Iowa, and Nebraska were engaged in defining their whole farm nutrient balance (WFNB) for two one-year periods (2006 and 2007). The average balance observed for these farms is reported in Figure 1 with the results of individual farms summarized in Appendix A (2006) and B (2007). These farms ranged in size from 2,000 to 16,000 head finishing capacity with most farms being wean to finish or feeder pig to finish. Two farms included sow facilities. Most farms included a crop production component ranging from 0 to more than 2000 acres. All but two farms were operated by individual families. Eight farms operated a contract swine operation, four were independent and one was an integrated operation.

Information was collected and analyzed independently for 2006 and 2007. While information was shared with producers at the end of 2006, no effort was made to encourage farm management or practice changes by the participating farms. Procedures used for collecting data in 2006 were discussed with farms at the end of 2006 and, if appropriate, modified procedures were implemented in 2007 for data collection only. In all cases, those modified procedures were also applied to the 2006 results.

WFNB Results

On average, 1.5 lbs of nitrogen entered these 13 farms from off-farm sources (Inputs – see green arrow in Figure 1) for every 1 lb of nitrogen leaving as Managed Outputs (see yellow arrow in Figure 1). This ratio ranged from 1.1 to 2.5 lbs input per 1lb managed outputs. Feed was the single largest source of inputs on average (79% of all inputs) followed by fertilizer (11%). Animals, legume fixed nitrogen, and nitrates in irrigation water accounted for the remaining 10%.

On average, phosphorus input to managed output ratio was 1.5 to 1 with a range of 0.8 – 3.3 lbs input to 1 lb managed output for the 25 farm-years of data collected (13 in 2006 and 12 in 2007). Again feed represented the single largest off-farm source of phosphorus (85%) with fertilizer and animals accounting for the remaining phosphorus inputs.

Critical Control Points

An analysis of several critical control points have been reviewed from the results of WFNB for these 13 farms. Based upon these reviews it is our conclusion that the following factors are the most critical control points for avoiding excess accumulations of nutrients on farm or losses from farms:

  • Phosphorus in purchased feeds.
  • Type of manure storage system.
  • Implementation of manure nutrient management plan.

Figure 1. Average whole farm nutrient balance for 13 corn belt farms for 2006 and 2007. See WFNB for Pork Production – An Introduction for additional explanation of Inputs and Managed Outputs.


The results also suggest that some additional factors will influence WFNB and the resulting accumulation of and loses from farms:

  • Crude protein (and nitrogen) in purchased feeds.
  • Density of animals to land base.

Finally the results provide insights that the following factors have little or no influence on WFNB and the resulting accumulation of and losses from farms:

Comparison to Other Species

The WFNB has been applied primarily to dairy farms in previous research. Spears et al. (2003) conducted whole-farm nitrogen balances on 41 Western dairy farms. On average 2.8 lbs of Nitrogen entered the farm for every pound leaving as a managed output. Castillo et al. (2000) estimated whole-farm nitrogen balances from European dairy farms to range from 1.2 – 2.3 to 1. Studies conducted prior to most nutrient management planning efforts also revealed relatively high whole farm imbalances. Fox (et al, 1994) reported whole farm balances for five dairies that ranged from 2.6 – 4.2 to1 (nitrogen) and 2.4 – 4 to 1 (phosphorus). Koelsch (2005) reviewed whole farm nutrient balances on 33 beef finishing and swine farms from 1996. Nitrogen balance ranged from 0.8 – 4.0 to 1 and phosphorus balance from 0.5 – 4.8 to 1.

WFNB values observed in previous research was significantly higher than observed with the 13 swine farms. This may be explained in part by the degree of implementation of nutrient plans, the utilization of feeding technologies such as the use of dietary phytase, and the degree of integration of animal and crop production into the same farm. In general, the results of the swine operations that participated in this study suggest significantly better nutrient management over previous studies.

Literature

Castillo AR, Kebreab E, Beever DE, France J. 2000. A review of efficiency of nitrogen utilization in dairy cows and its relationship with environmental pollution. J Anim Feed Sci 9:1–32.

Koelsch R. 2005. Evaluating livestock system environmental performance with whole-farm nutrient balance. J Environ Qual 34:149–55.

Spears, RA, Kohn RA, Young AJ. 2003. Whole-farm nitrogen balance on Western dairy farms. J Dairy Sci 86:4178–86.

Klausner, S. 1995. Nutrient management planning. p. 383–392. In K. Steele (ed.) Animal waste and the land-water interface. Lewis Publ., New York.


Results of On-Farm Measurement of WFNB

2006 Results – Appendix A

2007 Results – Appendix B

Return to Introductory Page for WFNB Resources

Authors: Rick Koelsch, University of Nebraska; Joe Lally, Iowa State University; Alan Sutton, Purdue University

This project was funded by The National Pork Board Project

Whole Farm Nutrient Balance (WFNB) for Pork Production – An Introduction

Contents


What Is Whole Farm Nutrient Balance?

Take Home Message
WFNB is a method for defining the overall nutrient use facility on a livestock facility including both the animal and cropping system. It encourages comparison of all nutrients entering and exiting a livestock farm with the goal of achieving a ratio of 1 lb input to 1 lb managed output. It also can be used to evaluate all nutrient management options for achieving a sustainable production facility for nutrients.

A Whole Farm Nutrient Balance (WFNB) is a comparison of the quantity of nutrients, typically nitrogen (N) and phosphorus (P) that enter (inputs) and exit (managed outputs) the farm gate. This measure can be visualized as an “Nutrient Yardstick”. In many ways, it is similar to feed input/output efficiency for animal (lbs of feed per lb of gain). These indicators compare inputs used to achieve a useful output. Smaller ratios suggest better performance. A WFNB describes the “whole farm’s” efficiency for utilizing nutrients and is an important indicator of a farm’s environmental performance.

Common sources of nutrients entering a farm (Inputs) include purchased animals, feeds, and fertilizers. Nitrogen fixed by legumes and nitrate contained in irrigation water represent additional N inputs. The Managed Outputs (useful products) include animals and crop sold and manure shipped to off-farm uses.

If there are more Input nutrients than Managed Output nutrients, the difference is a nutrient Imbalance. This Imbalance represents nutrients that may be lost to the environment by either air and water pathways as well as those nutrients that accumulate on the farm (e.g. increased soil P levels). An Imbalance suggests a potential environmental risk.

Whole Farm Nutrient Balance estimates nutrient use efficiency by comparing products entering (inputs) and exiting (managed outputs) the farm. Only products with an N or P component are included.

This balance measures only those nutrients that cross the boundary of the farm and does not directly track nutrients flows within the farm. Using the feed to gain analogy, as a pork producer you are not too concerned about the efficiency of internal organs such as the gastrointestinal tract’s ability to capture nutrients for the pig to utilize. However, you are aware that these internal processes affect the overall feed to gain ratio. Similarly, those internal processes (e.g. efficiency of utilization of manure in the cropping system) affects the quantity of nutrient inputs into the farm (e.g. purchased fertilizer inputs to the farm). Thus, a WFNB measure is reflective of multiple internal on-farm processes affecting nutrient efficiency.

WFNB also provides an indicator of the magnitude of direct nutrient losses (e.g. ammonia into the air or nitrate in the soil) and accumulations that add to a farm’s environmental risk (e.g. P buildup in the soil). Regulatory agencies are increasingly asking questions about these losses and accumulations. WFNB provides a producer with a relatively simple method for understanding these losses and accumulations and a means of tracking management changes that produce environmental benefits.

Why is A Measure of WFNB Important?

Permitted livestock operations are being asked to provide annual reports to a permitting authority (state regulatory agency or EPA) that provide indirect indicators of nutrient plan implementation. Producers are also required to keep extensive records of planning procedures, plan implementation, sampling, and inspections. Again these records provide indirect indicators of environmental performance. Finally, all producers are required to implement the same best management practices (BMP) whether they are producing pork in Nebraska, North Carolina, or Indiana. However, the effectiveness of these BMP is highly site and size specific.

WFNB provides a “potential” opportunity to set a common performance based goal for all livestock producers but allow individual producers latitude in determining how to reach that goal. It also provides a means of measuring an individual farm’s progress towards that goal. Setting environmental goals based upon a WFNB measure may give a producer greater flexibility and control in achieving an environmentally sustainable animal operation. It may also provide a simpler and more accurate means of documenting environmental performance.

It must be emphasized that WFNB only has the “potential” for achieving these goals. It has been used in policy implementation in Europe but has seen only limited application in the US. At this time WFNB is strictly a voluntary tool a producer may chose to use to track environmental performance.

What Decisions Might Result from Understanding WFNB?

  1. A farm’s WFNB can be used to evaluate alternative nutrient strategies. For example by knowing the magnitude of the fertilizer input, the potential improvement in WFNB that might result from an improved manure use plan can be forecasted. Other nutrient strategies contributing to an improved WFNB can also be evaluated including manure export, alternative cropping systems, alternative feeding programs.
  2. A farm’s WFNB provides a mechanism for comparing fertilizer vs. feed inputs, typically the two largest sources of nutrients. A recognition of which input is larger provides guidance as to which of those nutrient strategies that will be most effective for reducing an imbalance.
  3. A farm’s WFNB can be compared to a larger set of farms to gage a farm’s performance relative to its peers.

What Information Would a Producer Need to Assemble?

Several tools are available for estimating WFNB including a pork specific spreadsheet “Calculating My Farm’s Whole Farm Nutrient Balance”. To use this product you will need to have access to the information in table 1.

Table 1. To use the WFNB spreadsheet, you will need certain information.
Nutrient Flow Information Required Information Source Do I Have This?
Nutrient Inputs
Purchased Feed Quantity Farm records space
Protein and P concentration Farm record of feed analysis space
Purchased animals Number of animals Farm records space
Average animal weight Farm records space
N and P concentration Book value in spreadsheet space
Purchased Fertilizer Product type and amount Farm records of purchased fertilizers space
N and P concentration Book value in spreadsheet with option for adjustment space
Legume Fixed Nitrogen Acres not manured Farm records space
Legume crop yield Farm records space
Nitrates in Irrigation Water Amount of water pumped Farm records space
Water sample with nitrate concentration Farm records space
Managed Nutrient Outputs
Crops Sold Type and Quantity Farm records space
Protein and P concentration Book Value in spreadsheet with option for adjustment space
Animals Sold Number of animals Farm records space
Animal weight Farm records space
N and P concentration Book value space
Manure Transferred to Off-Farm Users Amount Farm records space
N and P concentration Farm records – Manure analysis space

Results of On-Farm Measurement of WFNB

2006 Results – Appendix A

2007 Results – Appendix B

Return to Introductory Page for WFNB Resources

Authors: Rick Koelsch, University of Nebraska; Joe Lally, Iowa State University; Alan Sutton, Purdue University

This project was funded by The National Pork Board

Impact of Farm Size on Whole Farm Nutrient Balance (WFNB)


Take Home Message
Both the number of animals and the size of the land base were not observed to influence WFNB. These pork producers have adopted nutrient management strategies that have diminished the importance of size relative to the management of nutrients. These results call into question the value of determining which facilities need a permit based upon size.

Click here for introduction to WFNB

Farm size as measured by animal capacity is often the basis for determining which animal production facilities will be regulated and to what extent. For swine operations, a threshold of 2400 pig capacity (finishing and reproductive herd) often triggers the requirement of a federal permit under Concentrated Animal Feeding Operations rules of the National Pollutant Discharge Elimination System program. However, for the 13 farms involved in this study of Whole Farm Nutrient Balance (WFNB), size proved to be a poor indicator of the efficiency of nutrient utilization or potential for nutrient losses from the farm.

Whole Farm Nutrient Balance (WFNB) vs. Swine Facility Size

Size of the pig operation does not explain the variability in WFNB as illustrated by the flat regression lines in Figure 1 for both nitrogen (N) and phosphorus (P) balances. Based upon an analysis of WFNB, three farms experience N or P whole farm balance ratios of 2 to 1 or greater. They included a 2000-head and a 3,400-head finisher, as well as a 6,200 sow and finish facility. These results suggest that farm size has little impact on the efficiency with which nutrients can be managed.


Figure 1: Whole farm N and P balance for 13 swine farms vs size of pork production unit.
1 WFNB Ratio is a ratio of all nutrients, N and P for this summary, that enter the farm (inputs) to all nutrients that exit the farm as managed products (managed outputs). See WFNB Introduction for a more complete explanation.
2 Grow finish equivalents included nursery pigs and sows. Nursery pigs and sows were converted to a grow-finish equivalent based upon a comparison of average feed intake.


WFNB vs. Cropland Base

Access to a larger land base has often been associated with better utilization of manure nutrients. However, producers have found options for managing manure in situations where the land base is insufficient. In one of the case studies a farm with no land base had a WFNB of 2.1, similar to other producers with much larger land bases. Data from the 13 case farms (Figure 2) demonstrates that access to greater land areas does not result in improved efficiency of nutrient utilization by the participating swine farms.

Manure export was used by seven of the 13 producers in one or more years as a means of accessing land base that they do not own or manage. Others employed diets low in crude protein or phosphorus to partially compensate for limited land access. These modifications to the overall farm’s management of nutrients resulted in a level of WFNB that does not change with the size of the land base owned or managed by the participating producers.


Figure 2: Whole farm N and P balance for 13 swine farms vs crop production land base.
1 WFNB Ratio is a ratio of all nutrients, N and P for this summary, that enter the farm (inputs) to all nutrients that exit the farm as managed products (managed outputs). See WFNB Introduction for a more complete explanation.
2 Grow finish equivalents included nursery pigs and sows. Nursery pigs and sows were converted to a grow-finish equivalent based upon a comparison of average feed intake.

The concentration of animals to the land base is also an important consideration and is reviewed in a separate fact sheet accessible from the Introductory Page.

Results of On-Farm Measurement of WFNB

2006 Results – Appendix A

2007 Results – Appendix B

Return to Introductory Page for WFNB Resources

Authors: Rick Koelsch, University of Nebraska; Joe Lally, Iowa State University; Alan Sutton, Purdue University

This project was funded by The National Pork Board Project

Pig Density Impacts on WFNB

Take Home Message
The density of pigs per unit of crop land is of some importance for determining whole farm nutrient balance. Higher densities tend to result in greater imbalances, although the variability observed was only partially explained by pig density. No recommended or threshold value for pig density per crop acre could be identified from the study.

Click here for introduction to WFNB

The relationship between the numbers of pigs raised on a swine farm to the numbers of acres to support this production unit is often called animal density. This measurement has been used in the past to relate the estimated amount of manure nutrient production from pigs to the amount of land that can utilize these nutrients for productive purposes i.e., crop production. However, using this measurement may give erroneous results because of the variety of nutrient management options available to pork operations. A whole farm nutrient balance (WFNB) study was conducted for two years (2006-2007) on 13 swine farms in the Midwest US. This fact sheet summarizes a comparison of animal density with WFNB or the farms overall measure of nutrient use efficiency. For more information about the farms involved in this study go to Overview of Nutrient Management Lessons Learned. Following are some observations from this study concerning the relationship of pig density to WFNB.

Pig Density

The relationship of pig density (grow-finish pig capacity per acre of available land area that can receive manure applications for crop production) to the WFNB for nitrogen (N) and phosphorus (P) as a ratio of N or P inputs to managed outputs was analyzed for the 13 swine farms during the two year study. Figure 1 shows the results of this relationship. There was a very weak conclusive effect or relationship of pig density per acre of land area on both N and P balance.

Figure 1: Whole farm nutrient balance for 13 swine farms vs. animal density.
1 WFNB Ratio is a ratio of all nutrients, N and P for this summary, that enter the farm (inputs) to all nutrients that exit the farm as managed products (managed outputs). See WFNB Introduction for a more complete explanation.
2 Grow finish equivalents included nursery pigs and sows. Nursery pigs and sows were converted to a grow-finish equivalent based upon a comparison of average feed intake.


Therefore, animal density alone is not effective in describing the nutrient use efficiency as describe by WFNB Ratio of a specific farm. Nutrient balance is also impacted by storage system type, feed program, crop nutrient management plan implementation, and export of manure (see additional fact sheets for details). As noted in Figure 1, there was considerable variation in the relationship of pig density to N and P balance with more variation in P balance than N balance. This reinforces the need to evaluate each specific farm independently for N and P balance considering the unique characteristics of the farm management, resources and other factors that can impact nutrient flow. A spreadsheet is available to determine the WFNB on any specific producer’s swine farm.

Summary

Pig density (pig capacity per acre land) is not a very effective indicator alone for N and P balance on a pork production unit. Many other aspects of the farm must be considered and evaluated to determined direct impact on N and P balance.

Results of On-Farm Measurement of WFNB

2006 Results – Appendix A

2007 Results – Appendix B

Return to Introductory Page for WFNB Resources

Authors: Alan Sutton, Purdue University; Rick Koelsch, University of Nebraska; Joe Lally, Iowa State University

This project was funded by The National Pork Board Project

Impact of Feed Management on WFNB

Contents


Why is Feed Management Important?

Take Home Message
Feed is the single largest source of nutrients brought onto swine farms, averaging 79 to 85% of nutrient inputs for the 13 farms in this study. Feed management decisions that impact dietary nutrient concentration and feed use efficiency are the most significant factors in explaining WFNB. Implementing available feeding technologies will reduce nutrient excretion and improve nutrient sustainability on many swine farms.

Click here for introduction to WFNB

Feeding swine is the highest economic cost (65 to 70%) for the pork operation. In addition, diet formulation and utilization of the nutrients in the ration by pigs has a major influence on the excretion of nutrients and potentially the balance of the nutrients on a farm. If larger amounts of nitrogen (N) and phosphorus (P) are imported (inputs – animals, feed, and fertilizer purchases, legume fixed N, and N in irrigation water) on the farm compared to the amount of N and P exported off the farm (managed outputs – sale of pigs, crops and/or exported manure) then there is a nutrient imbalance which leads to nutrient accumulation on the farm. A whole farm nutrient balance (WFNB) study was conducted for two years (2006-2007) on 13 pork production operations ranging in size from 2,000 to 16,000-head finisher capacity. For more information about the farms involved in this study go to Overview of Nutrient Management Lessons Learned. Following are some observations from this study related to the feeding programs of the farms and feed management.

Table 1. Average Whole Farm Nutrient Balance for 13 swine farms over 2 years.
Average Inputs, Outputs, or Balance (lbs/year) Portion of Total Inputs or Outputs (%) Average Inputs, Outputs, or Balance (lbs/year) Portion of Total Inputs or Outputs (%)
space Nitrogen Balance Phosphorus Balance
Inputs
Animals 7,700 3% 1,700 4%
Feed 175,700 79% 31,900 84%
Fertilizer 24,800 11% 4,200 11%
Legumes 13,300 6% space space
Irrigation 1,800 1% space space
Total Inputs 223,500 100% 37,800 100%
space
Managed Outputs
Animals 69,600 47% 13,600 54%
Crops 67,100 46% 9,800 39%
Manure1 10,000 7% 1,900 8%
Total Outputs 146,800 100% 24,800 100%
Imbalance 76,600 space 12,400 space
Input/Managed Output Ratio2 1.5 to 1 1.5 to 1

Input of Nutrients

Average N and P inputs on the 13 swine farms from feed purchases made up 79% of the total N inputs and 84% of the P inputs for the two year period (Table 1). The range of N inputs from feed was 20 to 95% and the range of P inputs from feed was 23 to 100% for the farms over the two year period. A majority of purchased feed inputs for the farms ranged from 77 to 95% for N and 71 to 100% for P. Farms with lower N and inputs from purchased feed utilized corn grown on the farm versus the purchase of corn for most or all of rations fed. A more common practice is to sell corn grown on the farm and purchase a complete ration including the corn from a feed mill. The average ratio of N and P inputs to managed outputs2 averaged 1.5 for each. However, the range of ratios of N and P inputs to outputs were 1.1 to 2.5 and 0.8 to 2.9, respectively.

Diet Composition

The average dietary crude protein and P levels were measured for the diets fed during the duration of this study. . Figures 1 and 2 demonstrate the relationship of the dietary crude protein and total dietary P levels to the WFNB ratio of N and P inputs to outputs on the pork operations.

Figure 1. Whole farm N balance for 13 swine farms vs. dietary crude protein level.


Average dietary protein levels ranged from 13.8 to 18.6% across all operations. There was no impact of dietary crude protein level on the ratio of N inputs to outputs which was surprising. Apparently, even though it was anticipated that the increased crude protein in the diet would increase N excretion and an imbalance in the N ratio, there are other circumstances that over-shadowed any direct impact of crude protein level on N ratio. While the reasons are unknown, there may have been significant differences on N losses during manure storage or other farm system components (e.g. direct ammonia emission from animal housing) which may have overshadowed these results.

Figure 2. Whole farm P balance for 13 swine farms vs. dietary phosphorus level.


There was an indication of an increase in the WFNB ratio of P inputs to outputs as affected by increases in total P in the diet. Average dietary total P levels ranged from 0.40 to 0.75%. The highest (0.75%) P diet content of one farm was due to being a gilt development operation which required higher dietary P levels for improved bone development and longevity in the breeding herd. Although other P inputs from purchased fertilizer can have an impact on the ratio of P inputs to outputs, it is clear that total dietary P is a major factor impacting this ratio. Therefore, any means of improving ingredient availability of P by the use of phytase or utilizing more biologically available P ingredient sources would reduce the amount of inorganic P in the diet. The widespread adoption of these feeding technologies has likely produced significant improvement in swine WFNB in recent years.

Feed Efficiency

The comparison of feed efficiency with WFNB further suggests the importance of feed management decisions (Figure 3). Lower feed required per pound of gain was associated with farms with better whole farm nutrient balances. The combination of dietary concentration (Figure 2) and feed efficiency (Figure 3) explains more than half of the variability observed in Whole Farm Nutrient Balance.

Figure 3. Impact of feed utilization efficiency on Whole Farm Nutrient Balance. Farrow to finish and gilt finishing results (5 data points) were removed from data set.


Practical Applications

Comparing the total dietary P levels in a swine farm with the ratio of P inputs to outputs reveals that a reduced total dietary P resulted in lower P ratios. For example, a finisher operation that had an average 0.62% total dietary P level across the feeding period the first year was reduced to 0.55% total dietary P the second year and resulted in a change in the ratio of P inputs to outputs from 1.9 the first year to 1.7 the second year. Another example showed that the reduction of the total dietary P for a gilt development farm was from 0.75% total dietary P the first year to 0.66% total dietary P the second year plus no purchase of P fertilizer resulted in the P ratio dropping from 3.3 to 1.8 in one year.

A spreadsheet calculator can be used to determine the potential benefits of reducing the dietary total P level in the diet. Table 2 summarizes an example exercise for one farm. For example, if a 4000 head capacity feeder pig to finish operation with 440 acres in a corn and soybean rotation (Farm A2) currently has a 0.46% total dietary P level. When comparing a lower (0.40% dietary P if phytase and/or ingredients with high P availability is used) and a higher dietary P level (0.60% dietary P), the WFNB ranges from a low of 0.9 to 1 to a high of 1.3 to 1 for P. When the average crude protein levels changed from 16.9% (current practice) to 15.5% or 14.0% (diets based upon crystalline amino acid inclusion or change in dietary ingredients with more digestible amino acids) with this farm, the N balance was reduced and the N ratio for inputs to outputs were reduced from 1.1 to 1.0 and 0.95, respectively. These changes may result in a need for additional N and P purchased fertilizer to meet the needs of the corn/soybean rotation for this 440 acre swine farm no longer met by the nutrients in excreted manure.

Table 2. Cases of impact of diet change on farm A2 whole farm nutrient balance.
Current Ration Change 1 Change 2
% Dietary Crude Protein 16.9% 15.5% 14.0%
N Imbalance (lbs/yr) 18,300 5,100 -9,000
N ratio2 1.11 to 1 1.03 to 1 0.95 to 1
space
% Dietary Phosphorus 0.46% 0.40% 0.60%
P Imbalance (lbs/yr) 700 -2,900 8,800
P ratio2 1.02 to 1 0.90 to 1 1.30 to 1

Summary

Altering the diet formulation of swine rations can have a significant impact on the excretion of nutrients and the WFNB of a farm especially P. Choice of feed ingredients and/or the use of additives that enhance availability of dietary nutrients can help reduce nutrient excretion and reduce farm nutrient imbalances.

Results of On-Farm Measurement of WFNB

2006 Results – Appendix A

2007 Results – Appendix B

Return to Introductory Page for WFNB Resources

Authors: Alan Sutton, Purdue University; Rick Koelsch, University of Nebraska; Joe Lally, Iowa State University

This project was funded by The National Pork Board Project

Note: This page is still undergoing the peer review process.


1Manure exported from farm.
2For explanation of WFNB Ratio, Inputs and Managed Outputs, refer to Introduction to WFNB