
Purpose
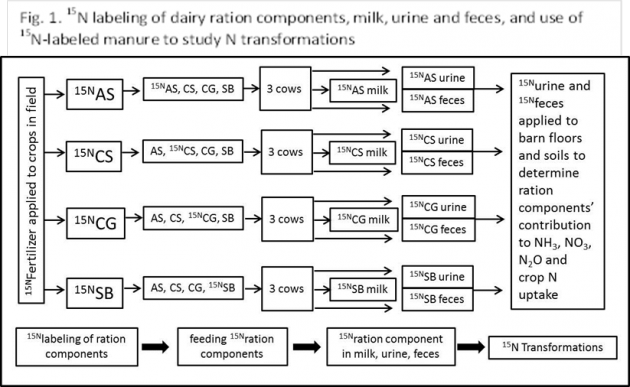
Of the total nitrogen (N) consumed by dairy cows on confinement farms (cows fed in barns), a general range of 20% to 35% is secreted in milk and the remaining N is excreted in manure. The N contained in manure is either recycled through crops after field application, or lost to the environment. To better understand the synergistic nature of feed N and manure N management and environmental N loss from dairy farms, a series of cow, laboratory and field experiments (Figure 1) was undertaken to quantify the relative amounts of N contained in individual ration components that are secreted in milk, excreted in urine and feces, taken up by crops after manure application to soil, and lost as ammonia (NH3) and nitrous oxide (N2O) from dairy barns and soils.
What did we do?
Alfalfa silage, corn silage, corn grain and soybeans were enriched in the field with the stable isotope 15N. Each 15N-enriched component was then fed individually (soybeans were solvent-extracted and the resultant soybean meal was fed) to twelve mid-lactation cows (3 cows per 15N-enriched ration component) as part of a total mixed ration (TMR). The masses of milk, urine and feces produced by each cow were recorded and sampled during the 4 day 15N feeding period, and for 3 days thereafter. This presentation will provide information on the 15N enrichment level of each ration component, the relative amount of each consumed component’s 15N that was secreted in milk and excreted in feces and urine. We will also present the results of a field trial that measured the relative contribution of each ration component’s manure N to corn N uptake during the first and second year after manure application. We will end with explanation of some of the experimental procedures we will use for measuring gaseous N losses after manure applications to barn floors and soils.
What have we learned?
Here we present some preliminary information on 15N labeling of ration components, the TMR that was fed, and some animal responses. Concentrations of fiber, total N and 15N in the ration components are provided in Table 1.

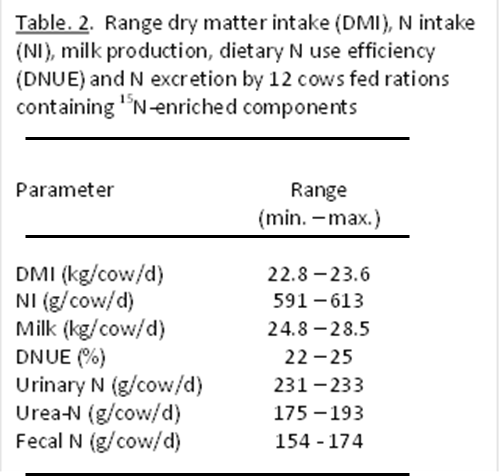
Highest 15N incorporation was achieved with corn (silage and grain) and lowest with alfalfa and soybean. This was due to 15N dilution by the atmospherically-fixed N by these legumes. The methods we used to ensile the 15N-enriched corn and alfalfa, the milling of 15N-enriched corn grain and the extraction of 15N-enriched soybeans to produce soybean meal did not appear to impact TMR intake, milk production or N excretion by dairy cows, as indicated by the narrow range (and non-significant differences among TMR containing the 15N-enriched components) in dry matter intake, N intake, milk production, dietary N use efficiency (relative amount of N intake secreted as milk N) and N excretion in urine, urea and feces (Table 2).
Future Plans
Feces and urine from each 15N enriched ration component will be applied to laboratory emission chambers that simulate barn floors and field soil surfaces, and 15NH3, 15NH4 15NO3 and 15N2O will be measured. Manure-soil incubations, greenhouse and field trials are underway to determine each ration N component contribution to crop N uptake.
Authors
J. Mark Powell, Soil Scientist, USDA-ARS US Dairy Forage Research Center mark.powell@ars.usda.gov
Tiago Barros, Marina Danes, Matias A. Aguerre and Michel A. Wattiaux Dep. Dairy Sci., University of Wisconsin, Madison, Wisconsin USA
The authors are solely responsible for the content of these proceedings. The technical information does not necessarily reflect the official position of the sponsoring agencies or institutions represented by planning committee members, and inclusion and distribution herein does not constitute an endorsement of views expressed by the same. Printed materials included herein are not refereed publications. Citations should appear as follows. EXAMPLE: Authors. 2015. Title of presentation. Waste to Worth: Spreading Science and Solutions. Seattle, WA. March 31-April 3, 2015. URL of this page. Accessed on: today’s date.