
![]() Waste to Worth home | More proceedings….
Waste to Worth home | More proceedings….
Abstract |
| * Presentation slides are available at the bottom of the page. |
Ammonia and odor emissions from land application of liquid dairy manure, and costs associated with manure land application methods are serious concerns for dairy owners, regulators, academic, and the general public. Odor and ammonia samples from agricultural fields receiving liquid dairy manure applied by surface broadcast and subsurface injection methods were collected and analyzed. Costs associated with both of the manure application methods were estimated. The test results showed that subsurface injection reduced both the odor and ammonia emissions compared with surface broadcast; therefore, applying liquid dairy manure by subsurface injection could be recommended as one of the best management practices to control ammonia and odor emissions. The estimated costs associated with subsurface injection were higher than surface broadcast. However the higher costs could be partially compensated by the higher nitrogen fertilizer value captured in the soil by the deep injection method.
Why Study Air Emissions from Dairy Farms?
|
A floating self-propelled mixing pump and a remote controller (yellow) |

Agriculture is the single most important economic sector in Idaho. Dairy production currently stands as the single largest agricultural pursuit in Idaho. Currently, Idaho ranks as the third largest milk production state in the US. Idaho has roughly 550 dairy operations with 580,000 milk cows. Over 70% of milk cows are located in the Magic Valley in southern Idaho (Idaho Department of Agriculture-Bureau of Dairying, 1/22/2013). A number of dairies in the Magic Valley use flushing systems resulting in huge amount of lagoon water which is applied to crop lands near the lagoons via irrigation systems during the crop growing seasons. The volatilization of ammonia (NH3) from the irrigated lands and lagoons is not only a loss of valuable nitrogen (N), but also causes air pollution. Concentrated dairy production in a limited area such as the Magic Valley has caused air and water quality concerns. Controlling odor and capturing N in dairy manure are big challenges facing the southern Idaho dairy industry.
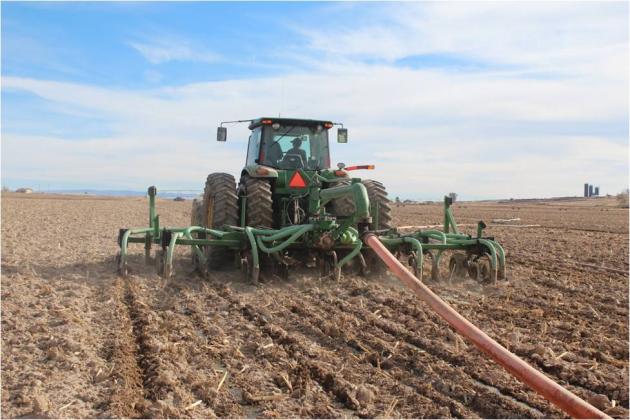
Direct injection incorporates manure directly beneath the soil surface and thus minimizes odor and NH3 emissions during application. Injecting manure decreases soluble phosphorus (P) and N in runoff relative to surface application. Some common types of direct injection applications are liquid tankers with injectors and drag-hose systems with injectors. Manure can be successfully injected in both conventional tillage and non-till systems with currently available equipment. The manure direct injection has been proven in other regions, such as the Midwest, to effectively manage odors and manure nutrients. The purpose of this research was to demonstrate, evaluate, and encourage the widespread adoption of the manure direct injection method in southern Idaho for mitigating odors and managing manure nutrients.
|
Subsurface injection with drag hose system |
What Did We Do?
A manure application field day was held on October 31, 2012 on a dairy in Buhl, Idaho, to demonstrate and evaluate dairy manure land application via a drag-hose system and manure mixing equipment. The dairy had approximately 3,500 milking cows managed in a free-stall and open-lot mix set-up, with about 60% of the cows housed in free stalls. Waste is flushed from lanes running under the feeding alleys and from the milking parlor. The wastewater passes through solids removal equipment and basins and then into three lagoons in series. Manure used for this demonstration study was from the last lagoon, which had about 9 million gallons of manure at the beginning of the demonstration field day and its sludge had been not cleaned for 5 years.
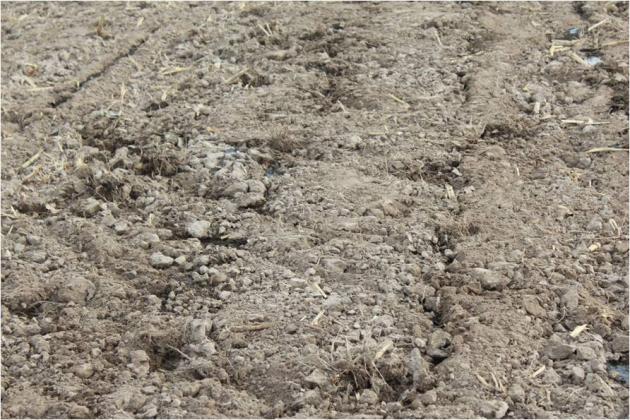
|
Soil after manure subsurface injection |
The on-farm manure application trials conducted at two sites were comprised of two manure application methods: surface broadcast and subsurface injection. At each of the sites, a square plot of approximately 3,600 m2 in the western portion of the site was used for surface broadcast and the rest of the land was used for subsurface injection. The western portion of the site was chosen because the prevailing winds were from the north during the test period. The previous crop at the two sites was corn; both sites had been disked after harvest.
The manure lagoon was agitated before and during application with a floating mixing pump. Manure was pumped from the lagoon directly to the application field via drag hoses. The two manure application methods were demonstrated with the same equipment. Subsurface injection placed manure behind the shank in a band approximately 20 cm (8 inches) deep. Surface broadcast was realized by lifting the shanks above ground so manure was applied on the soil surface. Manure was applied from east to west and back again until the site was finished. The equipment shanks were lifted only when the equipment was in the designated 3,600 m2 square plot for surface application. After manure application in the site, three towers, each 1.5 m high, were placed in a north-to-south orientation with approximately 15 m spacing. The middle tower was placed at the center of the manure surface applied plot. Three towers were placed in the manure subsurface injected field parallel to the ones in the manure surface broadcasted plot and approximately 200 m apart to avoid or minimize cross-contamination between the two manure application methods.
Passive NH3 samplers (Ogawa & Co. USA Inc., Pompano Beach, FL) were installed on each tower at a height of 0.5 and 1 m to determine the NH3 concentration at each location. Ammonia samplers were changed approximately every 24 hours over a two-day period after manure application. Right after collection of NH3 samplers in field, samplers were placed into airtight containers and then shipped back to the U-Idaho Twin Falls Waste Management Laboratory where the NH3 sampler filters were carefully removed from the samplers and transferred into 15-mL centrifuge tubes. Five mL of 1 M KCI was added to each of the centrifuge tubes to extract NH3 trapped in the filters. The extractant was transported to the USDA Northwest Irrigation and Soils Research Laboratory (NWISRL) located in Kimberly, Idaho where it was analyzed for NH4-N using a flow-injection analysis system (Quickchem 8500, Lachat Instruments, Milwaukee, WI). Background concentrations of NH3 were determined by placing three towers 50 m upwind (north) of the site following the same procedure described previously. Concentrations from passive samplers are time-average concentrations for the amount of time the sampler was exposed to the air and were calculated with the following equation:
[NH3-N]air (mg/m3) = 1,000,000 *[NH4-N]extractant (mg/L)/200/time deployed (min)/31.1 (cm3/min)
In this, [NH3-N]air is the concentration of NH3-N in the air, [NH4-N]extractant is the concentration of NH4-N in the extractant, and 31.1 cm3/min is a constant used to calculated diffusion to the trap (Roadman et al., 2003; Leytem et al., 2009). Details regarding the design and calculation of NH3 concentrations can be found in Roadman et al. (2003) and Leytem et al. (2009).
Air samples were collected from the first test site right after manure application using Tedlar bags. One air sample was collected at 1 m above ground from each of the three towers located in the surface broadcast plot, subsurface injection, and background, respectively. A total of nine air samples were collected and then sent via UPS over-night service to Iowa State University Olfactometry Laboratory for odor analysis. The nine air samples were analyzed within 24 hours based on ASTM E679-04 (ASTM, 2004).
For each test site, a grab sample (about 1 L) of liquid manure was collected and transported to a commercial lab (Stukenholtz Laboratory, Inc., located in Twin Falls, Idaho) for pH and total nitrogen analysis. The manure pH, total N, and calculated total N application rates are shown in Table 1. The liquid manure application rate was approximately 20,000 gallons per acre on both the test sites.
Table 1. Manure pH and total N concentrations and application rates of total N at the two test sites
|
Site and Application Method |
Manure pH |
Manure total N concentration (mg/L) |
Manure total N Application Rate (kg/acre) |
|
Site 1 |
7.4 |
3433 |
257 |
|
Site 2 |
7.3 |
3519 |
265 |
A soil temperature probe with data logger (HOBO U23 Pro v2 2x external temperature data logger-U23-003) was placed 3 cm below the soil surface to record soil temperature data in 15-min increments. Wind speed, temperature, and relative humidity data were obtained from local Buhl Airport, located six miles from the test sites, due to failure of the mobile weather station set on the test sites. The ambient weather conditions and soil temperature at the test sites over the test period are shown in Table 2.
Table 2. Ambient weather conditions and soil temperature at the test sites
|
|
Site 1 |
Site 2 |
||
|
Item |
Day 1 |
Day 2 |
Day 1 |
Day 2 |
|
Average wind speed, m/s |
5.0 |
4.2 |
4.2 |
3.1 |
|
Air temperature, average(minimum, maximum),˚F |
61 (42, 78) |
49 (45, 63) |
49 (45, 63) |
47 (38, 61) |
|
Average relative humidity, % |
28 |
53 |
53 |
51 |
|
Soil temperature, average(minimum, maximum), ˚F |
50.9 (51.1, 56.1) |
47.3 (51.1, 51.2) |
46.5 (51.5, 52.1) |
66.7 (51.6, 69.1) |
Cost analysis was carried out for four different manure land application systems as shown in the “What Have We Learned?” section below. Cost calculations are based on 500 hours annual use for the tractor and 200 hours annual use for the injection system. Tractor operator labor is figured at $11.70/hour, diesel is figured at $4.00/gallon. Equipment costs were determined using the MACHCOST program from the University of Idaho’s department of Agricultural Economics and Rural Sociology. The program is available on the AERS web page at https://www.uidaho.edu/cals/idaho-agbiz/resources/tools. Equipment data was provided by John Smith at Smith Equipment Co. Rupert, ID 83350. Some machinery data was taken from “Costs of Owning and Operating Farm Machinery in the Pacific Northwest” PNW 346 available on line at: https://www.extension.uidaho.edu/publishing/pdf/PNW/PNW0346/PNW0346.html.
What Have We Learned?
Odor results from test site 1
T-test for Odor showed there was no significant difference between the background and subsurface injection (P=0.41), there was significant difference between the background and surface broadcast (P=0.03), and P value was 0.08 for the t-test of mean difference between the subsurface injection and surface broadcast. The field day attendees felt there was significant difference in odor perception between the subsurface injection and surface broadcast methods.
Test site 1
First day ammonia sample results from test site 1.
Second day ammonia sample results from test site 1.
The NH3 concentration data from test site 1 showed significant difference between surface broadcast and subsurface injection based on P<0.05. The NH3 concentration data from test site 1 showed 82% and 64% reduction in NH3 concentration for first and second sampling day, respectively when liquid dairy manure was applied by subsurface injection vs. surface broadcast.
Test site 2
First day ammonia sample results from test site 2.
Second day ammonia sample results from test site 2.
The NH3 concentration data from test site 2 showed significant difference between surface broadcast and subsurface injection based on P<0.05. There were 64% and 41% decrease in NH3 concentration for first and second sampling day, respectively when manure was applied by subsurface injection compared with surface broadcast.
The NH3 concentration data from both the test sites showed lower NH3 concentration in the air from the subsurface injected soil vs. surface applied land which means higher nitrogen fertilizer value captured in the soil by the subsurface injection method.
Cost analysis results:
*Fuel and Lubricant Costs are assigned to the Power Unit.
The above fact sheet summarizes probable costs of operation for a 7,400 gallon tank with a 2,000 gpm discharge rate and a 15 foot wide broadcast unit. A 180 PTO HP tractor is needed to pull this unit at an average ground speed of 8 mph. Up to 10 acres per hour can be covered with the unit. The tank is discharged in approximately 4 minutes. Time and equipment to refill the tank is not included in these calculations.
*Fuel and Lubricant Costs are assigned to the Power Unit.
The above fact sheet summarizes probable costs of operation for a 7,400 gallon tank with a 2,000 gpm discharge rate and a 12 foot wide broadcast unit. A 215 PTO HP tractor is needed to pull this unit at an average ground speed of 7 mph. Up to 7 acres per hour can be covered with the unit. The tank is discharged in approximately 4 minutes. Time and equipment to refill the tank is not included in these calculations.
*Fuel and Lubricant Costs are assigned to the Power Unit.
The above fact sheet summarizes probable costs of operation for a 7,400 gallon tank with a 2,000 gpm discharge rate and a 12 foot wide broadcast unit. A 225 PTO HP tractor is needed to pull this unit at an average ground speed of 7 mph. Up to 7 acres per hour can be covered with the unit. The tank is discharged in approximately 4 minutes. Time and equipment to refill the tank is not included in these calculations.
*Fuel and Lubricant Costs are assigned to the Power Unit.
The above fact sheet summarizes probable costs of operation for a system utilizing 5,280 FT of 8 inch hose and 1,320 FT of 5 inch hose. The pump unit capacity is 1,500 gpm to a 16 foot knife injection unit. A 250 PTO HP tractor is needed for the injection unit operating at 75% field efficiency and at an average ground speed of 3.5 mph. The lagoon pump is a 270 HP unit and operating efficiency assumed at 70%. Beyond 2 miles a booster pump would be necessary. Up to 4.75 acres per hour can be covered with the unit. Operation is continuous as no tank refill is needed.
Based on the estimated costs above, the subsurface injection method has higher costs mainly due to the need of larger tractor and lower operating speed. However, we did not include the time and equipment costs associated with refilling the tank for the tank application system. Due to the short time to discharge the tank on the tank broadcast and tank injection systems additional equipment to refill the tank in a timely fashion would be desirable. This would increase the investment in equipment and also would reduce the number of acres that could be covered per hour due to down time while the tank is refilled.
In summary, subsurface injection can reduce both the odor and NH3 emissions compared with surface broadcast; therefore, applying liquid dairy manure by subsurface injection could be recommended as one of the best management practices to control NH3 and odor emissions. The estimated costs associated with subsurface injection were higher than surface broadcast. However, the higher costs could be partially compensated by the higher nitrogen fertilizer value captured in the soil by the subsurface injection method.
Future Plans
We will finish development of educational videos to demonstrate the manure subsurface injection technique and disseminate results from this study to our stakeholders.
Authors
Lide Chen, Waste Management Engineer and Assistant Professor, Biological and Agricultural Engineering Department, University of Idaho lchen@uidaho.edu
Mario de Haro Marti, Extension Educator
Wilson Gray, District Extension Economist and Extension Professor
Howard Neibling, Extension Irrigation and Water Management Specialist and Associate Professor
Mireille Chahine, Extension Dairy Specialist and Associate Professor
Sai Krishna Reddy Yadanaparthi, Graduate student, University of Idaho
Acknowledgements
This project was supported by the USDA Natural Resource Conservation Service through a Conservation Innovation Grant. We would also like to thank Dr. April Leytem and Mr. Myles Miller (USDA Northwest Irrigation and Soils Research Laboratory (NWISRL) located in Kimberly, Idaho) for their help with analysis of ammonia samples.
The authors are solely responsible for the content of these proceedings. The technical information does not necessarily reflect the official position of the sponsoring agencies or institutions represented by planning committee members, and inclusion and distribution herein does not constitute an endorsement of views expressed by the same. Printed materials included herein are not refereed publications. Citations should appear as follows. EXAMPLE: Authors. 2013. Title of presentation. Waste to Worth: Spreading Science and Solutions. Denver, CO. April 1-5, 2013. URL of this page. Accessed on: today’s date.